
Every time we look at WorldView-3 and WorldView-4 (WV3/4) imagery, we are blown away. And we hope you are equally impressed with the data! Last month we fittingly explored a colorful town in South Korea, and for the August WorldView-3/4 Image of the Month we feature an image of the Hotel Capella in Singapore–the site of the historic US-North Korea Summit in June 2018.
 And while we would have preferred to feature an image collected on the actual day of the summit, i.e. June 12th, that was a very cloudy day so we did the best we could! This 30-cm WorldView-4 image was collected over the site of the summit, the Hotel Capella in Singapore, on June 11th at about 11:36am. This image has been processed for improved color and clarity by Apollo Mapping. (Images Courtesy: DigitalGlobe)
PLEASE NOTE: Effective May 2016, WorldView-3/4 prices dropped again! Are you interested in finding out more about these price drops? If so, send us an email at sales@apollomapping.com.
WorldView-3 launched in late 2014 and WorldView-4 launched in late 2016; taken together they are the most advanced satellite constellation the commercial marketplace has ever had access to. Here are a few of the features that really set these satellites apart from the competition:
- Improved Resolution
- Higher resolution means you can see more detail in WV3/4 imagery.
- Data collected at nadir will have 31-centimeter (cm) panchromatic, 1.24-meter (m) visible and near infrared, 3.7-m SWIR (WV3 only) and 30-m CAVIS (WV3 only) bands.
- At 20 degrees off-nadir, the resolution is 34-cm panchromatic, 1.38-m visible and near infrared and 4.1-m shortwave infrared.
- Per US government regulation, all WV3 SWIR orders are produced at a maximum resolution of 7.5-m. CAVIS bands are not available for purchase at this time.
- Additional Spectral Bands
- If spectral analysis is part of your project, then no other satellite can match WV3 with its: 8 bands of visible and near-infrared data; and 8 shortwave infrared bands which are crucial for geological studies.
- Better Positional Accuracy
- With accuracies of 3.5-m CE90% or better (without ground control even!), WV3/4 has no rivals for its enhanced positional accuracy.
- Daily Revisits
- At 40 degrees latitude, WV3/4 will each be able to image every location daily with 1-meter or better resolution and then every 4.5 days at 34-cm resolution or better.
- Increased Collection Capacity
- WV3/4 feature 13.1-km swath widths (at nadir) with the ability to collect up to 680,000 square kilometer (sq km) of high-resolution data per day per satellite.
- Improved control movement gyros translate into larger maximum contiguous collection areas per pass, with up to ~7,500 sq km of mono imagery and ~3,000 sq km of stereo possible.
If you are interested in WorldView-3 and/or WorldView-4 imagery for your next project, please let us know by phone, 303-993-3863, or by email, sales@apollomapping.com.
You can also find more WV3 samples and technical information on our website here and then WV4 samples and information can be found here.
 This map shows the areas imaged by the Pléiades 1 constellation from January 1 to March 31, 2018 over Indonesia and the Philippines. Please note that in many instances, multiple images were collected over the same area which is difficult to portray on this static map.
In this monthly piece, we give our readers a sense of the high-resolution imagery coverage collected over a geography during a specified window. To do this, we pick a high-resolution satellite constellation, a defined time period and area of interest, then report key statistics on the total amount of imagery collected in square kilometers (sq km). Without further delay, let’s jump into our analysis.
Graphic Region of Interest: Indonesia and Philippines plus off-shore islands
Land Mass Covered: 2,180,911.0 sq km
Time Period: January 1 to March 31, 2018
High-Resolution Satellite Constellation: Pléiades 1 (i.e. Pléiades 1A and 1B)
Pléiades 1 Constellation Imaging Statistics–Indonesia and Philippines
Total Area Collected: 3,687,941.6 sq km; 20,488.6 sq km per satellite/per day
Area Collected @ 20% or Less Clouds & 30 Degrees or Less Off-Nadir: 646,374.5 sq km; 3,591.0 sq km per satellite/per day; 17.5% of total
Welcome back to our Map Mavin Methods monthly series! This month we are particularly excited to talk all things web mapping. While traditionally we’ve covered one little piece or tool within our web mapping platform (which is of course still helpful), we’ve received several inquiries as to how some of our more complicated maps used in demos have been made. So we thought, why not let our readers in on a little “secret”? As it turns out, even our most “complicated” maps are in fact not complicated at all! In this demo, we’ll walk through our most popular map, how it was made, and how you too can make something just like it in a matter of minutes!
Before we begin to take a look at the actual steps involved in making our NYC map, let’s briefly discuss a key part of the process: finding data! There are essentially two ways to make a web map. You can A.) find data or B.) create and use your own (or do a combination of both). In this example we use existing data that’s out there in the public domain for anyone to download. Now back to the topic of where to find such data. While we could have a long discussion of the many, many different types of data one can find online and places in which to find them (and eventually will), for now we’re going to focus on open data portals. More and more states, counties and cities are making their GIS data available online, and chances are that the city nearest you has already done so. A simple Google search will generally pull up what you’ll need. Once on a particular city’s GIS portal (see our video for an example), you’ll want to download the layers you find in either KMZ or shapefile format (we support other formats, such as TIFFs but those are discussed in other tutorials).
Once back in your Map Mavin account, click the Layers tab. From here go to the upper right corner of the page and click the green Create Layer button. You can either drag and drop files or find them in their respective folders.
Having uploaded layers you can now stylize them one by one by clicking on a given layer in the Layers tab to open it up. We’ve discussed this in more detail in other FAQ’s as well (see the Layers section of the Map Mavin support page).
To make a map, click the Maps tab and then the green button titled New Map. You’ll be brought to the map creation portal where you can select the layers you want to use, decide whether you want to make it public-facing or private, and permit users to edit the map if desired.
There you have it! The process is described in further detail in the video but essentially all map creation is that straightforward. Upload, select layers and stylize them!
Happy mapping!
Fletcher Berryman
Cloud Tamer
(970) 710-0909
fletcher@apollomapping.com
Launched in late 2016 (and relaunched in mid-2018), Map Mavin is our pay-as-you go GIS cloud that lets users make unlimited public and password-protected web maps. Once you upload your vector and raster files to our secure Amazon cloud, you are ready to make and share your web maps in minutes–just like this demo web map we made with vectors and a base layer TIFF from Boulder, Colorado.

And with our Screen Share function, you can link up with users all around the world to collaborate on a map in real-time. Picture a live webex in your mind but just based around a map that moves and changes as the members of your team update information. Imagine the possibilities of working in real-time with a team of collaborators around the world without any GIS knowledge required!
Priced at just $35 per month with a free trial month, there is no other cloud-based GIS on the market that can compete with Map Mavin on price. For your $35 per month, you are able to store up to 5 gigabytes (5GB) as well as make and share unlimited web maps. As an added bonus, you can cancel your monthly contract at any time.
August 2018 Product Updates
In the past month, we released Map Mavin updates that included but were not limited to the following list of fixes, additions and/or enhancements:
- There is a new free (for now at least) basemap option that lets you stream in high-resolution DigitalGlobe imagery.
- When sharing private web maps with users, you can set an expiration date for their access to the map.
- Legend colors can be customized.
- Added download to multiple formats.
- Map Viewers can now edit vector data in web maps when given the ability to do so.
- You are no longer required to enter a credit card to start a free 31-day Basic Admin trial.
- Added a full attribute table view for vectors.
Stay tuned to this series where we will let you know about the Map Mavin changes that were released in the past month.
If you have an improvement or feature addition you would like to add the Map Mavin product road map, let us know by email at support@mapmavin.com.
Are you interested in trying out Map Mavin? If so, you can sign up here. Or maybe you would like a live demo of the product before you sign up? If so, send us an email at support@mapmavin.com and we will get one scheduled right away!
Have you checked out Image Hunter recently?!?! If not, you should!
Listening to the feedback we received on improving imagery search engines over the years, the new version of Image Hunter features a major overhaul to the user interface as well as to the backend architecture. Image Hunter is now built on open-source technology so now it works on all computers, not just on Windows machines. We slimmed down the user interface to make it easier to find the imagery filters and other available tools. All things said, we really think you will enjoy your browsing experience–plus no other search engine even comes close to the breadth of satellites offered in Image Hunter!

Key August 2018 Improvement(s)
It was in the works for a long time, and finally last month, we were able to get the source files we needed to add in another medium resolution satellite, this time it is the 22-meter multispectral satellite Deimos-1 that we welcome to Image Hunter!
Here is a list of the additional changes we made to Image Hunter in the past month:
- When you search for a catalogue ID, if you have a polygon loaded, it will stay onscreen.
- Added a new feature popup.
- Updated ALOS image metadata to show forward, backward or nadir scan direction.
- Fixed a strange bug where image dates could be duplicated over and over in the results window.
Data Alert–An Automated Daily Imagery Search
We launched our highly anticipated Data Alert service in mid-2015 and it’s a hit! Data Alert lets you define an area of interest anywhere around the globe, the resolution your project requires and the number of months we should keep the alert active. Once an alert is set up, we check for new data over your area of interest every single day, and send you an email when we find coverage that meets your specifications. We have a short YouTube video with directions to set up a Data Alert, check out the second video; and we have written directions for Data Alert here.
The Satellites Available in Image Hunter
As you might have seen in past articles, we now feature hourly updates (seriously!) of GaoFen 1/2, GeoEye-1, KOMPSAT 2/3/3A, Pléiades 1, SPOT 6/7, SuperView-1, TripleSAT, WorldView-1/2/3/4 and ZiYuan-3!
Image Hunter can be accessed 24 hours a day, 7 days a week and is a one-stop shop for every major source of medium and high-resolution satellite imagery on the market today, including:
- Worldview-4
- WorldView-3
- WorldView-2
- WorldView-1
- QuickBird
- GeoEye-1
- IKONOS
- EROS B
- KOMPSAT-3A
- KOMPSAT-3
- KOMPSAT-2
- Pléiades 1 constellation
- Deimos-1
- Deimos-2
- TripleSat
- SPOT 1 to 7 constellation
- RapidEye
- GaoFen-2
- GaoFen-1
- ZiYuan-3 01/02 (mono and stereo!)
- Formosat-2
- ALOS PRISM (stereo)
- SkySat constellation
- SuperView-1 constellation
- Landsat 1-8
- TeLEOS-1
Key Features of Image Hunter
If any of our readers have struggled with other geospatial search engines that are clunky, only query one data source and/or do not provide image previews, then Image Hunter is the solution to your woes as it features:
- Online browsing of satellite imagery from 10 plus data providers and over 30 satellite systems.
- Near-instantaneous loading of low-resolution preview imagery with collection date, cloud cover and other key metadata.
- The ability to define your area of interest by address, coordinates, geometric shape or shapefile/KMZ.
- A responsive basemap with street names to provide spatial context when discovering data as well as crowd-sourced updates for the most accurate map possible.
- Exports of the area of interest you create as well as the scenes you select in shapefile or KMZ format.
- Support for all operating systems, and not just our friends with Windows machines!
Image Hunter can be accessed here all-day and all-night, we are excited to find out what you think about our imagery search engine! So if you have any ideas and/or feedback to improve Image Hunter, please let us know at sales@apollomapping.com or (303) 993-3863.
Do you have an area of interest that requires regularly updated imagery but you do not have time to check daily for this data?
Or perhaps you have a remote location that needs updated imagery but you cannot afford a new collection?
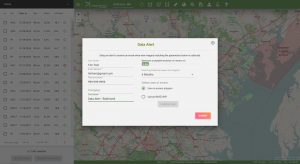
If either of these questions ring true, then you need to check our new Data Alert service on Image Hunter!
Data Alert lets you define an area of interest anywhere around the globe, the resolution your project requires and the number of months we should keep the alert active. Once this is set up, we check for new data over your area of interest every single day, and send you an email alert when we find coverage that meets your specifications.
We have a short YouTube video with directions to set up a Data Alert, check out the second video. We also have written directions for Data Alert here.
It’s that easy to find the data you need for all of your key projects.
If you would like to check out Data Alert, send us an email at sales@apollomapping.com or visit Image Hunter and click on the bell icon in the header to get started using this great service!
Map Mavin is our GIS cloud, have you checked it out yet? If not, you can find out more information about it here.
If Map Mavin looks like a service you could use to create the web maps required for your next project, then you need to check out this monthly article where we give away up to five (5) free subscriptions!
So here is how this will work. Each month, we will give away up to five free one-month subscriptions to Map Mavin–that is a $35 value per subscription! Included in this free one-month subscription is up to 5 gigabytes (GB) of cloud-based storage and download bandwidth, plus you even get an additional free trial month. Then you would pay a base rate of $35 per month for Map Mavin from there if you decide to keep the service active. If you are already a Map Mavin client, we will credit your account $35 if you win the contest.
To win, you will need to submit the correct answer to the trivia question below. You have 24 hours from the time our newsletter sends to submit your answer. We will randomly draw the five winners from the group of readers who answered correctly; and then announce these winners in the next edition of The Geospatial Times.
Okay, ready, set, here we go:
Name a city in the United States that starts with the letter H–it’s that simple folks, we want winners every month until the new overhauled Map Mavin is completely ready to go which should be in the next few months!
You have 24 hours to get us the correct answer to this question by email. Please submit your answers to sales@apollomapping.com.
July 2018 Free For All Answer & Winners!
Last month we had a winner! Mike Leavitt guessed Georgetown which does indeed start with the letter ‘G’ J
We are very excited about the major progress we have made on Map Mavin over the past three months, stay tuned for more exciting updates soon!
Good luck winning our monthly prize and let us know if you have any questions about Map Mavin!