
In this monthly series, I turn my attention to one of the most powerful software packages for raster processing available – the Geospatial Data Abstraction Library (GDAL) – and as an added bonus, it’s free! Each month, I focus on a different utility offered in GDAL, walking the reader through its applications and offering up a series of tips and illustrations so that you can emulate this process in your office and/or home. In this edition of WIG, I show our readers how to use GDAL to create a color relief from a raster digital elevation model (DEM).
About GDAL
GDAL is an open source software application that was launched in 1998 and has been updated multiple times since. While the current version of GDAL (i.e. version 1.9) can be downloaded from multiple locations, I find this site to be the most up-to-date and easy to navigate. I suggest downloading the stable version of the MSVC2010 build for either 32-bit or 64-bit PCs depending on which you have access to. You can also download GDAL as part of an easier to install program, FW Tools, but the version of GDAL included with this installer is usually not the most recent.
GDAL contains a wide array of utilities to help you process raster files. I find that GDAL is more stable and runs quicker than ArcGIS, ENVI and PCI for data production – although the toolkit is more limited than in these applications. GDAL does not rate high for user-friendly functionality as it is command line driven (i.e. words and text, not graphics and mouse clicks); and this is the inspiration for creating the WIG series.
What Is a Color Relief?
When a DEM is created, it is by definition a single layer raster, i.e. a layer with pixels that define the elevation at a given point; and as a single layer, by definition the data is black and white only (or panchromatic). When you load a DEM into many geospatial applications, you can apply color ramps to this single panchromatic layer to get a colorized elevation layer. However, many of these preset ramps have a limited number of color choices and you are not able to control how the colors blend into each other. Further, these color ramps are temporary so they must be applied each time you load the DEM.
The GDAL command, color relief, is a freeware solution to creating a truly colorized DEM – meaning one that you could even open in Photoshop and it would appear in color. The color relief command offers a high degree of control over the colors used to represent each height and how they blend into one another.
A color relief is created by defining various elevation values and assigning a color to these values. GDAL then blends the assigned colors on a smooth linear basis between these elevation values. So for example, if you were to define an elevation of 100 meters as yellow and then 150 meters as blue, GDAL would blend all the values between 100 and 150 meters so that there is a smooth transition from yellow to blue. In other words, at an elevation of 125 meters, the pixel would be green – which is a 50/50 mix of yellow and blue. Users are able to define as many of these elevation value–color pairings as they need so that a complex or simple color relief can be created. The output from GDAL when using the color relief command is an 8-bit color balanced raster file with red, green and blue bands ; or red, green, blue and alpha if your application requires the 4-th alpha band to create color images – most programs do not.
Creating a Color Relief
In order to create a hillshade layer, I employed the GDALDEM functions – you can find out more about them here. Here are the steps I took to calculate a hillshade:
- This is the same data used in last month’s edition of WIG
- I moved my DEM file, a digital terrain model (DTM) produced by DigitalGlobe with 2-meter resolution over Gadara, India, to a folder called, ‘Test,’ located the root of my C: Drive
- I chose a simple folder name and file location (i.e. C:test) for the data to make things easier when working with the command line interface of GDAL
- I also changed the name of the DTM file to ‘DTM.tif’ to make things easier when working with GDAL
- After starting up GDAL, I used the command: cdtest
- This command points GDAL to the folder I created with the DTM
- If you would like to get a list of the files in the folder you are working in, use this command: dir
- To calculate color relief, I used the following command: gdaldem color-relief DTM.tif color_text.txt color_relief.tif
- In this command, the words ‘gdaldem color-relief’ define the utility that GDAL uses to process the data
- ‘DTM.tif’ is the full name of the input (original) DEM file
- ‘color_text.tif’ is the name of the text-based file that will define my output color schema; creating this file is by far the most challenging part of the color relief command, and as such, is the focus of the remainder of the piece below
- ‘color_relief.tif’ is the name I chose for the output color relief TIFF file; you could chose different file extensions if you want to create a JPEG2000, for instance
- I could also add several strings to the end of the command in Step 5 to employ additional GDAL functionality:
- –alpha -> this adds an alpha band to the output raster
- –s scale=value : replace the word value with the proper scaling factor if the horizontal and vertib. –zero_for_flat -> replace 0 for default value of -9999 for flat areas, or areas with no aspect
- –exact_color_entry -> this forces GDAL to color all pixels black if their elevation is not an exact match to a value in the text-based color configuration file; as such, there is no color blending here, only color matches to the values in the configuration file or to black
- –nearest_color_entry -> this forces GDAL to assign each pixel the color of the nearest corresponding elevation in the text-based configuration file; as such, there is no color blending here, only color matches to the values in the configuration file
Tips for Creating a Text-Based Color Figuration File
The most challenging part of using the color relief GDAL command is the creation of a text-based color configuration file. As such, for the remainder of this WIG, I offer as many tips as I can to create effective configuration files. The first step to take is determining the maximum and minimum elevation values in your DEM. Many of you do have access to ArcGIS, so I will walk you through this process in ArcMap. First, you will need to increase the ‘Maximum number of unique values to render’ under the menu chain, Customize -> ArcMap Options -> Raster, to a very large value (I used 100,000,000) in order to render all of the pixel values in your DEM. Now go to the DEM layer, right click, and follow this menu chain, Properties -> Symbology -> Classified. Press the Classify button and let the histograms build if need be. You can get the maximum elevation value for your DEM in the top right under the Classification Statistics. To get the minimum value, zoom in on the values to left-side of the graph (the positive ones if you are working with terrestrial elevation models); keep on zooming in until you can accurately estimate the minimum value. For my DEM, I found a maximum value of 156.91 meters and a minimum of 96.91.
The next step is determining if your DEM has any black fill at the edges. This happens when the polygon used to clip your elevation model is not a rectangle. In the areas where there is not elevation information, false values (often large negative values) will be entered so that they can be ignored in future production. Many applications are ‘intelligent’ enough to recognize these background values on their own, however that is not the case with a color configuration file. In ArcMap, the areas with black fill on my DEM were easy to find using either the Identify button and clicking at the margins; or by using the method described in the paragraph above. In my DEM, the black fill value is -32,767.
Now it is time to create your color configuration text file. I suggest using Wordpad for this as it comes with every Windows-based PC, and then saving the file in .TXT format. Now you need to create this file with a line by line definition of the cut off values for elevation and then the corresponding colors in Red, Green, Blue format. So for example, if I wanted to set the elevation value of 100 meters to white, I would use this code:
100,255,255,255
i.e. [Elevation value],[Red value],[Green value],[Blue value]
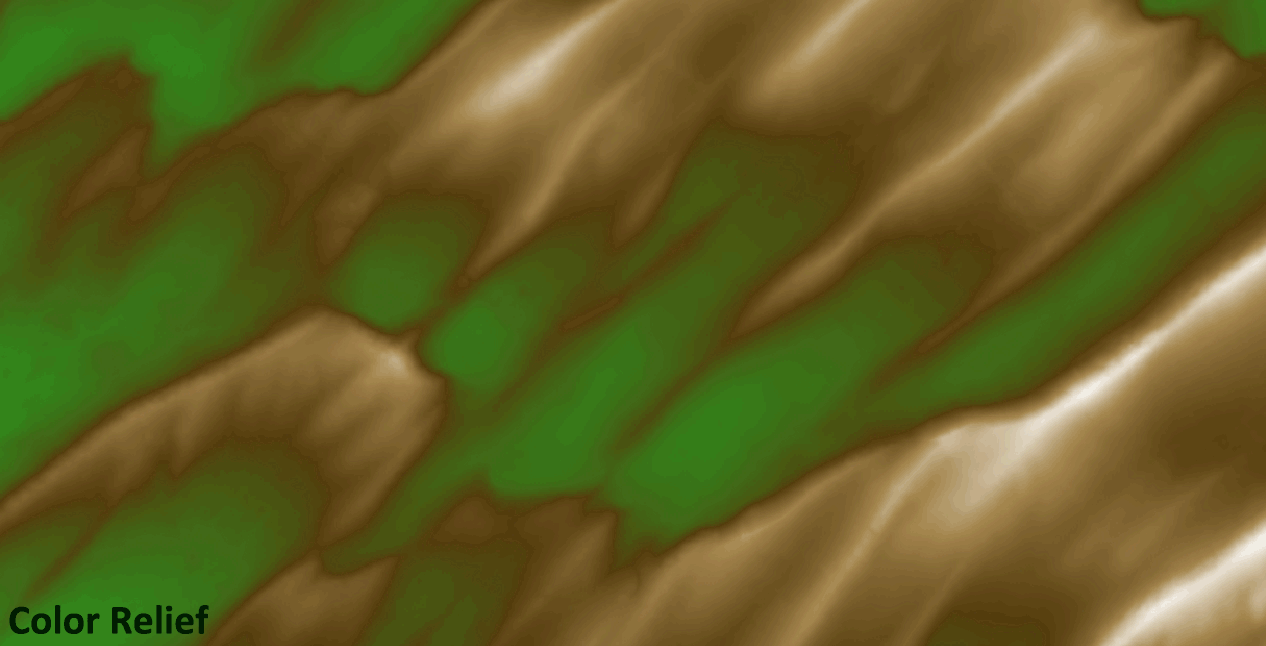
In order to create the color relief you see below, I used the following configuration file; and at the end of each line I put the color this creates in parentheses, you would not add these descriptions to your own configuration file:
-32767,16,161,8 (light green)
96.91,16,161,8 (light green)
111.91,50,135,28 (dark green)
126.91,84,60,14 (dark brown)
141.91,163,133,78 (light brown)
156.91,255,255,255 (white)
Here are some considerations to take when picking the colors for your defined elevation values:
- I added in the background value as the same color as the minimum elevation value. This creates a continuous color at the edge of the color relief. Without this, there would be odd colors at the edge of the color relief.
- I divided the interval of elevation values evenly when deciding where to define colors. While this worked out well in this example, it might not always be effective. In cases where you have lots of elevation values that are clustered closely together, you will need to alter this spacing to create a smooth color transition (if that is your desired outcome).
- I found that defining multiple intermediate colors and elevations resulted in a more pleasing color relief than when I used more basic colors such as yellow and blue. When you use yellow and blue, you end up with multiple colors in between these two points with green as the intermediate color. For some applications, you may well want to emphasize the intermediate elevation values by picking more basic colors.
One word to the wise on a topic that stumped me for quite some time the first time I encountered it. In ArcGIS 10.1, it appears a change was made to the raster management module so that many TIFF images are opened with an auto-stretch that includes a Percent Clip Stretch and in some cases a Gamma Stretch. While this is a great feature if your data is not already balanced, it can have drastic negative effects for those that are already balanced – as is a GDAL color relief! You can check out if this happened to your raster layer by going to, Properties -> Symbology -> Stretched.
As with any map you create, you need to carefully consider the audience and your intended message when you make choices on color and symbology, so please be sure to take all the tips offered in this WIG in light of that fact.
Brock Adam McCarty
Map Wizard
(720) 470-7988

Leave a Reply