
- For all my nerds out there, let me hear a woot woot as it is time for this month’s installment of all things awesome in new technology:
Vinegar could power the next significant antibiotic breakthroughs.
Printed aluminum is lighter and stronger than conventional sources.
While you might not hear as much about GMO crops these days, the work does continue.
Liquid metal for recyclable electronic parts.
Winds created in railway tunnels could be a source of clean energy.
A new super-powerful antibiotic found.
This reusable micro-fiber can remove antibiotics from water.
Fingerprints from fired bullets.
Nature is ‘adapting’ to human trash–a sad statement about modern society.
Breakthrough catalyst for efficient conversion of CO2 into fuel.
 In October 2025, warmer than average temperatures were seen over large parts of northern and western Europe. The most pronounced positive anomalies were recorded over northern Fennoscandia, as well as over the southern Iberian Peninsula. Below-average temperatures were mostly experienced over southeastern Europe. Outside Europe, the largest positive temperature anomalies were recorded over both polar regions, as well as over the Himalayas and the Tibetan Plateau. In the Arctic, anomalies were more than 8°C above average over the Canadian archipelago, around Baffin Bay and over the central Arctic Ocean with below average sea ice cover. Most of eastern Antarctica saw much warmer than average temperatures, with large regions seeing values also more than 8°C above average. (Image Credit: Copernicus Earth Observation Programme)
- While the NOAA global climate report is offline due to the US government shutdown, lets pivot to the European version of this report. The Copernicus Earth Observation Programme’s environmental report for October 2025 reveals further proof that global climate change remains a concern. According to the ERA5 dataset, globally October 2025 was 0.70°C warmer than the 1991-2020 average for October, with an absolute surface air temperature of 15.14°C. October 2025 was the third warmest October on record, 0.16°C cooler than the record October of 2023 and only 0.11°C cooler than October 2024. October 2025 also was 1.55°C warmer than an estimate of the pre-industrial October average for 1850-1900. Globally, the annual average for the latest 12-month period (November 2024 to October 2025) was 0.62°C above the 1991-2020 average and 1.50°C above the estimated 1850-1900 average used to define the pre-industrial level.
- The winter holidays are upon us and many homeowners decorate their properties for the holidays. Whether it’s an inflatable snowman out front, lit outlines of Rudolph and the rest of the reindeer propped up on the ground, or a Santa figure in a giant snow globe, there are plenty of decorations available to brighten the dull and dreary month of December. Some people love driving around, checking out other people’s holiday displays. Instead of looking for a glow of lights in the distance that would make Clark Griswold proud, there are interactive maps created by GIS that pinpoint the Christmas light displays. The maps also can be used for holiday tours, contests and to showcase larger public installations. Whiteside County, Illinois, uses the platform ArcGIS StoryMaps to highlight the Christmas light displays in its jurisdiction. Coon Rapids, Minnesota, also uses the same platform to map out the homes with displays worthy of a drive-by. Columbia County, Georgia, not only uses GIS to map out where properties are located with Christmas lights, but also offers driving directions for their full Christmas light tour by using zip codes. The city of Boston put together an ArcGIS StoryMap to show the locations of Christmas trees, along with dates and times for tree lightings around the city. Other large cities with holiday light display maps include Denver, Phoenix, and Vancouver, just to name a few. There’s also The Original Christmas Light Finder, a searchable database of the most decorated homes, communities, businesses, parks and drive-thru displays around the world.
Brock Adam McCarty
Map Wizard
(720) 470-7988
brock@apollomapping.com
If you are searching for medium and high-resolution satellite imagery, the search is over as Image Hunter is the solution you’ve been looking for! Featuring satellite and aerial imagery as well as digital elevation models (DEMs) from a constantly expanding list of 60+ constellations/datasets and 19 vendors, our database contains more than 200-million images/records meaning there is just no other website out there with this breadth of commercial data products. Our interface is slim-lined and modern, loading quickly on all platforms, browsers and operating systems. Further, our database is updated multiple times an hour with the most recent images collected by WorldView-3, Pléiades 1, PlanetScope, SuperView-1 and many more so you are sure to get the most current view of all the imagery and DEM databases we work with. Once you submit your request, an Apollo Mapping representative will be in touch within 4 Illinois business hours to get you the pricing information you need for your project.
So why wait? Give Image Hunter a try now to find the imagery and/or DEM data you need for your next mapping project!
Key Improvement(s) From The Past Month
We are still busy working on fixing a few non-responsive APIs as well as introducing our new feature, but in the meantime, we tackled a pretty nice list of both front and back-end changes. No single item stands out to us so let’s jump right into the list!
Here is a summary of the changes/improvements we made to Image Hunter during the past month:
- Introduced more accurate Pléiades Neo previews that conform closer to the actual collection geometry.
- Previews for Maxar data now load in the Review/Save interface.
- Augmented the update process for Maxar imagery to improve data reliability.
- Stored a series of Maxar COG TIFF previews for assured catalogue longevity.
- Improved the efficiency of backend imagery updates.

Data Alert–An Automated Daily Imagery Search
Have you checked out Data Alert which lets you define an area of interest anywhere around the globe, the resolution your project requires and the number of months we should keep the alert active? Once an alert is set up, we check for new data over your area of interest every single day, and send you an email when we find coverage that meets your specifications. We have a short YouTube video with directions to set up a Data Alert, check out the last video; and we have written directions for Data Alert here.
The Sensors Available in Image Hunter
As you might have seen in past articles, we now feature hourly updates (seriously!) of GeoEye-1, KOMPSAT 3/3A, Pléiades 1 and Neo, SPOT 6/7, SuperView-1/2/Neo, WorldView-1/2/3/Legion!
Image Hunter can be accessed 24 hours a day, 7 days a week and is a one-stop shop for every major source of medium and high-resolution satellite (and aerial!) imagery on the market today, including:
- WorldView Legion
- WorldView-4
- WorldView-3
- WorldView-2
- WorldView-1
- QuickBird
- GeoEye-1
- IKONOS
- EROS B
- KOMPSAT-3A
- KOMPSAT-3
- KOMPSAT-2
- Pléiades 1 constellation
- Pléiades Neo constellation
- TerraSAR-X (TerraSAR-X, TanDEM-X and PAZ)
- GEOSAT-1
- GEOSAT-2
- TripleSat
- BJ3A
- BJ3N
- SPOT 1 to 7 constellation
- RapidEye
- GaoFen-2
- GaoFen-1
- ZiYuan-3 01/02 (mono and stereo!)
- FORMOSAT-5
- FORMOSAT-2
- ALOS PRISM (stereo)
- AW3D Standard (DEM)
- SkySat constellation
- PlanetScope constellation (including 5-band SuperDove data)
- SuperView-1 constellation
- SuperView-2
- SuperView Neo-1 01/02
- SuperView Neo-3
- Landsat 1-8
- TeLEOS-1
- DS-EO
- Hexagon (HxGN Content Program aerial imagery) imagery + DEM
- WorldDEM
- WorldDEM Neo
- Vricon DEMs
- Orbita Hyperspectral Satellite (OHS)
- KazEOSat-1
- KazEOSat-2
- Jilin-1 Optical
- Jilin-1 Video (including nighttime imagery)
- Jilin-1 GF/DP
- Jillin-1 KF
- Orbita Video Satellites-1/2/3 (OVS-1/2/3)
- BlackSky Global series
Key Features of Image Hunter
If any of our readers have struggled with other geospatial search engines that are clunky, only query one data source and/or do not provide image previews, then Image Hunter is the solution to your woes as it features:
- Online browsing of satellite and aerial imagery from 19 data providers and 56 satellite and aerial imagery derived datasets.
- Near-instantaneous loading of low-resolution preview imagery with collection date, cloud cover and other key metadata.
- The ability to define your area of interest by address, coordinates, geometric shape or shapefile/KMZ.
- A responsive basemap with street names to provide spatial context when discovering data as well as crowd-sourced updates for the most accurate map possible.
- Exports of the area of interest you create as well as the scenes you select in shapefile or KMZ format.
- Support for all operating systems, and not just our friends with Windows machines!
Image Hunter can be accessed here all day and night, we are excited to find out what you think about our imagery search engine! So if you have any ideas and/or feedback to improve Image Hunter, please let us know at sales@apollomapping.com or (303) 993-3863.
 This map shows the areas imaged by the WorldView-2/3 constellation from June 1 to August 31, 2025 over Central America. Please note that in many instances, multiple images were collected over the same area which is difficult to portray on this static map.
In this monthly piece, we give our readers a sense of the high-resolution imagery coverage collected over a geography during a specified window. To do this, we pick a high-resolution satellite constellation, a defined time period and area of interest, then report key statistics on the total amount of imagery collected in square kilometers (sq km). Without further delay, let’s jump into our analysis.
Graphic Region of Interest: Central America (plus small islands)
Land Mass Covered: 2,468,332.1 sq km
Time Period: June 1 to August 31, 2025
High-Resolution Satellite Constellation: WorldView-2/3
WorldView-2/3 Constellation Imaging Statistics–Central America
Total Area Collected: 1,272,249.3 sq km; 6,914.4 sq km per satellite/per day
Area Collected @ 20% or Less Clouds & 30 Degrees or Less Off-Nadir: 406,635.5 sq km; 2,210.0 sq km per satellite/per day; 31.96% of total
In this monthly feature, we span the globe to examine Our Changing Landscape with a time series of medium-resolution PlanetScope satellite imagery. The PlanetScope constellation dates back to 2016 and collects hundreds of millions of square kilometers of four and eight-band 3-meter imagery daily! In November, we headed to the Port of Los Angeles, the busiest container port in North America. For the December edition of this series, we are checking out tidal swings in the Bay of Fundy, Canada.
The PlanetScope Microsat Constellation
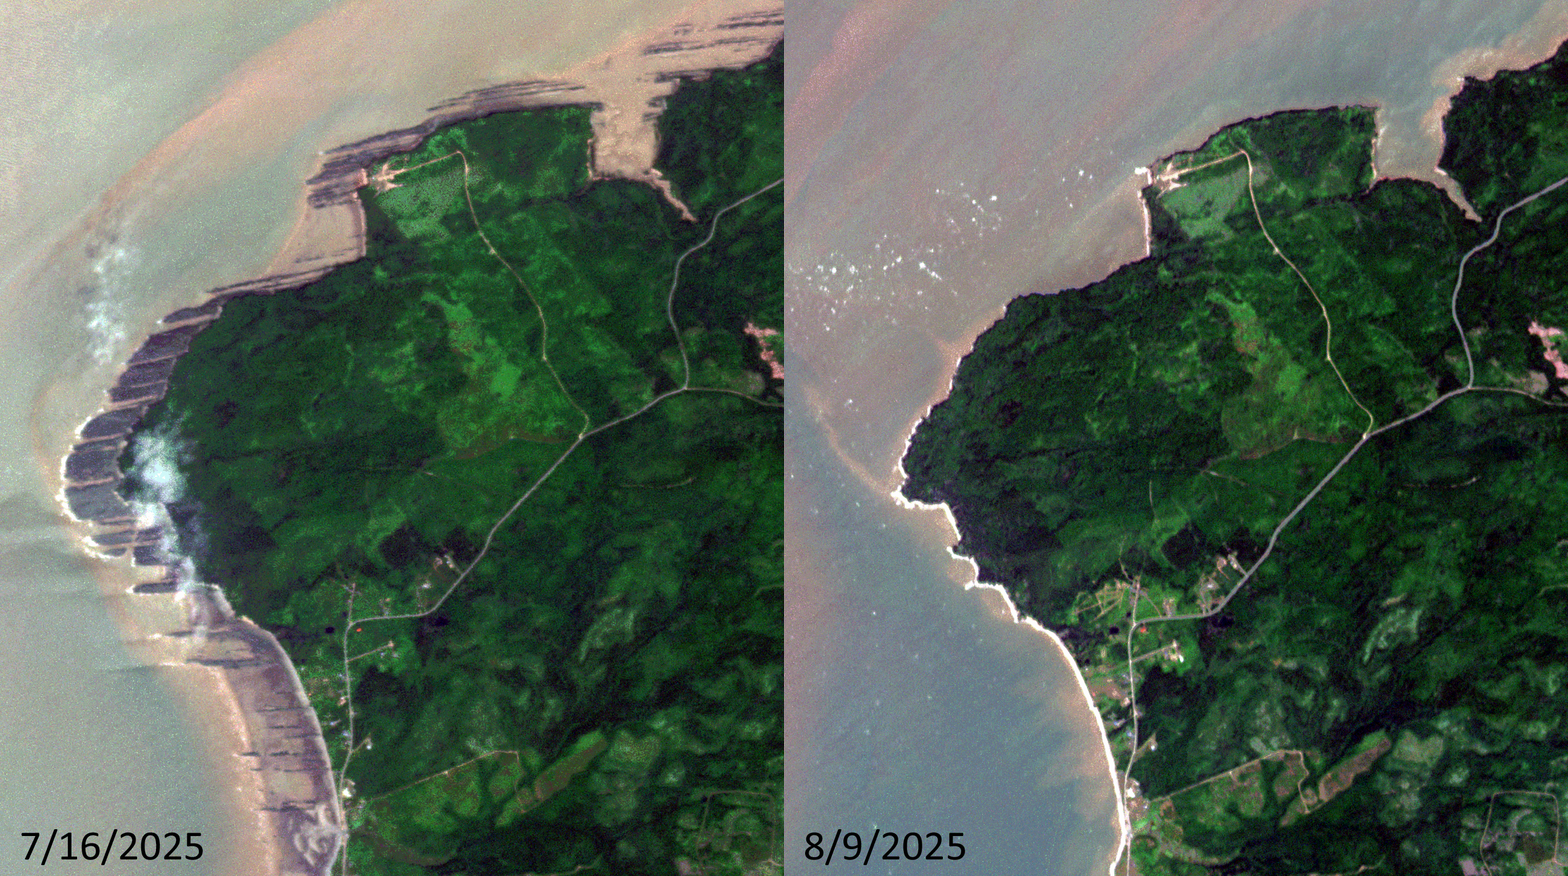
Click on the image above to see an animation of 3-meter natural color PlanetScope image collected over a coastal area on the Bay of Fundy close to Lower Cover, Nova Scotia on July 16 and August 9, 2025. And really just wow nature, as the animation highlights. In the two images you can see that the coastline on the July 16th image goes right up to the edge of the vegetation and then in the August 9th image, tens of meters of coastline have been exposed. Most of us have seen tides in action during our life, but few have likely seen something this drastic in person! (Images Courtesy: © Planet 2025)
PlanetScope is a constellation of more than 240 microsats referred to individually as Doves. Each Dove is able to collect up to 20,000 square kilometers (sq km) per day of 3-meter (m) 4-band multispectral (i.e. blue, green, red and near-infrared [NIR]) imagery; and newly launched SuperDoves collect 8-band multispectral adding in valuable red-edge spectral data. Across the constellation, PlanetScope is archiving more than 200 million sq km of medium-resolution imagery a day, making it the go to source for daily imagery over most locations. This massive archive dates back to 2016, offering the most complete and continuous record of spatial data on the planet since the start of the constellation’s ongoing launch schedule. Collecting 3-meter multispectral imagery is the equivalent of ‘high-resolution’ multispectral data imaged by a 75-centimer (cm) satellite (as this satellite would feature 75-cm panchromatic and 3-m multispectral), making PlanetScope an extremely competitively priced option at just $2.25 per sq km. With well registered images and nearly daily collections of most locations, PlanetScope is the ideal imagery source for this current-events focused series, Our Changing Landscape.
Extreme Tidal Change in the Bay of Fundy, Canada
The Bay of Fundy along Fundy National Park on New Brunswick’s east coast highlights one of nature’s most impressive shows. Twice daily, the most dramatic tides in the world cover the ocean bed with as much as 48 feet every day when 100 billion tons of seawater crash into the shore–the height of a four-story building.
Within six hours, the water slides back to expose the sea bottom that’s mucky, covered with seaweed and blooming with intertidal wildlife. The waterside beach opens up into miles of sand that, according to National Geographic, is great for picnicking. In fact, a special event called the Rising Tide Festival, held in mid-August, brings Maritime musicians inspired by the land into Fundy National Park.
During low tide, visitors can see the iconic Hopewell Rocks, also known as Flowerpot Rocks. They’re sea stacks that rise up from the tide-influenced seabed. There’s a low tide exploration path, a Big Cove panorama route and a Daniels Flats observing path for viewing the special formations. One of the most fun and exciting ways to experience the Bay of Fundy tides–which is found only in Nova Scotia, according to Nova Scotia’s official website, is riding the tidal bore on a tidal bore rafting adventure. When the Bay of Fundy’s incoming tide meets the Shubenacadie River, an abrupt change in the river current turns the calm water into a washing machine of waves. The rolling waves led by the lead wave, the tidal bore, can range from 8 to 20 feet high and creates the perfect roller coaster ride on water.
Not only is the Bay of Fundy famous for high tides, but its shoreline cliffs and beaches are home to the world’s most complete fossil record of life 300 million years ago, making it part of a UNESCO World Heritage Site and a UNESCO Global Geopark. Explore the rocky shoreline with an experienced guide such as Fundy Treasures Tours, Joggins Fossil Cliffs UNESCO World Heritage Site in Joggins or the Fundy Geological Museum in Parrsboro. There’s also a multi-course, white linen, gourmet meal hosted at Burntcoat Head Park at low tide. Guests will enjoy an intimate 3-course meal consisting of local ingredients all paired with local beer and wine.
In addition to the jaw-dropping tides, the Bay of Fundy also is home to several species of whales during the summer months, including the rare right whale. Step aboard a whale watching tour boat departing from Digby Neck, Long Island or Brier Island and head off onto the Bay of Fundy coast to look for whales.
If you would like to find out more about using 3-meter PlanetScope imagery for your academic studies, engineering projects or any landscape analysis, let us know at sales@apollomapping.com or (303) 993-3863.
¡Bienvenidos a diciembre! Nosotros en Apollo Mapping estamos gustosos de tenerlos otro mes aquí en los resúmenes españoles del mes de diciembre.
PRODUCTO DESTACADO Datos PlanetScope + WorldView de 8 bandas
 ¿Te imaginas trabajar con esta colorida imagen de WorldView-2 de 50 cm con 8 bandas? Es el doble de información espectral por el mismo costo reducido. Esta imagen de 50 cm de Maxar WorldView-2 fue capturada en Central City, Pensilvania, el 1 de octubre de 2012.
¿Sabías que, gracias a los recientes cambios en los precios de las imágenes satelitales de alta resolución de 8 bandas: WorldView-2, WorldView-3 y WorldView Legión ahora puedes obtener esta información espectral adicional al mismo precio que los datos de 4 bandas? ¡Así es, lo entendiste bien! ¿Por qué no elevar tu análisis espectral sin costo adicional?
Además, quizá no sabías que la mayoría de las imágenes PlanetScope de 3 metros también pueden entregarse con 4 u 8 bandas por el mismo precio.
Así que, cuando llegue el momento de comenzar un proyecto que incluya detección de cambios, clasificación de uso/cobertura del suelo, análisis de vegetación o cualquier otro tipo de análisis espectral, ¿por qué no usar datos de 8 bandas de WorldView o PlanetScope por el mismo precio?
Envíanos un correo en cualquier momento para elevar tu análisis espectral sin costo adicional utilizando imágenes satelitales de 8 bandas para tu próximo proyecto geoespacial.
Colecciones de Imágenes de Alta Resolución–WorldView-2/3–Centroamérica, junio a agosto de 2025
Este mapa muestra las áreas capturadas por la constelación WorldView-2/3 entre el 1 de junio y el 31 de agosto de 2025 sobre América Central. Ten en cuenta que, en muchos casos, se recopilaron múltiples imágenes sobre la misma zona, lo cual es difícil de representar en este mapa estático.En esta publicación mensual, ofrecemos a nuestros lectores una visión del cobertura de imágenes de alta resolución capturada sobre una región durante un periodo específico. Para ello, seleccionamos una constelación satelital de alta resolución, un periodo definido y un área de interés, y luego informamos estadísticas clave sobre la cantidad total de imágenes recopiladas, medida en kilómetros cuadrados (km²). Sin más demora, pasemos a nuestro análisis.
Región Gráfica de Interés: Centroamérica (incluyendo pequeñas islas)
Superficie Terrestre Cubierta: 2,468,332.1 km²
Período de Tiempo: del 1 de junio al 31 de agosto de 2025
Constelación de Satélites de Alta Resolución: WorldView-2/3
Estadísticas de Imágenes Constelación WorldView-2/3–Centroamérica
Área Total Recolectada: 1,272,249.3 km²; 6,914.4 km² por satélite por día
Área recolectada con 20% o menos de nubes y 30 grados o menos de inclinación: 406,635.5 km²; 2,210.0 km² por satélite por día; 31.96% del total
PRODUCTO DESTACADO–Tareas de Captura DS-EO de 50 cm para la Región Ecuatorial
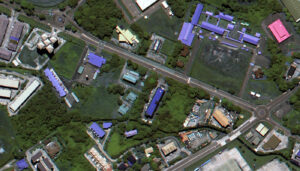 Imagen en color DS-EO de 50 cm capturada el 13 de junio de 2025 sobre Muara, Brunéi.
¿Buscas imágenes de alta resolución diseñadas para aplicaciones de precisión dentro de la región ecuatorial? Lanzado desde India en 2022 por Geo-Insights, el sistema satelital DS-EO de 50 cm puede recopilar las imágenes que necesitas, y hacerlo con alta frecuencia. DS-EO cuenta con una carga útil electro-óptica multiespectral que ofrece imágenes multiespectrales de 4 bandas a 2 metros y pancromáticas de 50 centímetros, ideales para análisis espectrales avanzados. Puede producir imágenes precisas de 4 bandas y cuenta con un rango de longitud de onda pancromático de 450–800 nanómetros, lo que permite capturar imágenes en blanco y negro de amplio espectro con una resolución excepcional de 50 cm.
Gracias a sus dos revisitas diarias, puedes utilizar datos DS-EO confiables y oportunos con un nivel de detalle excepcional en la zona ecuatorial. Con profundidad de 16 bits, resolución pancromática de 50 cm y cuatro bandas multiespectrales de 2 m, es posible realizar análisis que incluyen identificación de objetos, así como evaluaciones de salud de la vegetación y calidad del agua.
Descubre cómo DS-EO ofrece detalles definidos para análisis avanzados, permitiendo identificar objetos complejos en entornos ambientales o marítimos.
Puedes consultar datos DS-EO de 50 cm en cualquier momento en Cazador de Imágenes. Y si tienes preguntas sobre tareas de captura o datos de archivo de este sistema satelital, puedes escribirnos hoy mismo a sales@apollomapping.com.
Fernando Gutierrez
Topographic Translator

We love maps.
We love imagery.
We love work breaks.
We hope you like them as well!
The China International Aviation and Aerospace Exhibition, also known as Airshow China, is the only international aerospace trade show approved by the Chinese central government, with support from Chinese aerospace industries. Featuring a large display of products, trade talks, technological exchange and a flying demonstration, the show takes place biennially in Zhuhai, Guangdong, China.
Since 1996, Airshow China has been held for 14 sessions in a row. The 2026 event will take place November 10th to 15th.
For this month’s Imagery Work Break, we feature a 30-centimeter color Pléiades Neo 3 enhanced photo from November 13, 2022, which was the last day of the 2022 edition of Airshow China. During the 2022 exhibition, approximately $40 billion worth of cooperation agreements were signed for future aviation orders. In this 30-cm image, you can see the planes outside on display, resembling tiny toy planes as seen from this satellite above.
Have a great rest of your workday! 😊
(Image Courtesy: Airbus. Processed by Apollo Mapping for improved color accuracy and clarity.)
 Twenty-eight intriguing art installations are scattered across the 990-acre Gibbs Farm, a North Auckland property nestled near Kaipara Harbor, which is the largest harbor in the southern hemisphere. As the largest collection of large-scale outdoor sculptures in New Zealand, the private art collection belongs to businessman Alan Gibb, but it is open to the public on certain days throughout the year. He bought the land in 1991, and in addition to the artwork, it includes several exotic animals such as emus and giraffes, a garage where visitors can glimpse the Gibbs Aquada through the window, and a full-scale wild west town complete with a saloon that’s found in the installation called Grief. After nearly 20 years of building the art collection, Gibbs Farm includes major works by Graham Bennett, Chris Booth, Daniel Buren, Bill Culbert, Neil Dawson, Marijke de Goey, Andy Goldsworthy, Ralph Hotere, Anish Kapoor, Sol LeWitt, Len Lye, Russell Moses, Peter Nicholls, Eric Orr, Tony Oursler, George Rickey, Peter Roche, Richard Serra, Kenneth Snelson, Richard Thompson, Leon van den Eijkel and Zhan Wang. Most works in the collection are commissioned specifically for Gibbs Farm. Gibbs’ architect son-in-law, Noel Lane, now cares for the property with Gibbs’ daughter, Amanda. The sculpture Electrum, by Eric Orr, is the world’s largest Tesla coil (11.6 meters or 38 feet tall) and numerous artworks are large enough to be seen from high-resolution satellite imagery. In the image featured here, we can see the sprawling green grass of the farm dotted with colorful outlines of the 28 art installations varying in height and width. This 30-cm WorldView Legion image was collected on May 3, 2025, and has custom processing and color balance applied by Apollo Mapping. (Satellite Imagery © 2025 Vantor)
In this monthly article, we travel the world to check out unique, fun and sometimes a bit weird 30-centimeter (cm) color imagery samples from the WorldView constellation. In November, we looked at Shandur Polo Field in Pakistan. For this edition of the 30-cm Color WorldView Image of the Month, we feature an image of Gibbs Farm in Makarau, New Zealand.
30-cm WorldView-3 (WV3) launched in late 2014, WorldView-4 (WV4) launched in late 2016 and then the first WorldView Legion satellites launched in 2024. Taken together, this is the most advanced satellite constellation the commercial marketplace has ever had access to. Here are a few of the features that really set these satellites apart from the competition:
- Improved Resolution
- Higher resolution means you can see more detail in WorldView imagery.
- Data collected at nadir will have 31-centimeter (cm) panchromatic, 1.24-meter (m) visible and near infrared, 3.7-m SWIR (WV3 only) and 30-m CAVIS (WV3 only) bands.
- Additional Spectral Bands
- If spectral analysis is part of your project, then no other satellite can match WorldView-3 and WorldView Legion with their 8 bands of visible and near-infrared data; and then 8 shortwave infrared bands (WV3 only) which are crucial for geological studies.
- Better Positional Accuracy
- With accuracies of 3.5-m CE90% or better (without ground control even!), the 30-cm WorldView constellation has no rivals for its enhanced positional accuracy.
- Daily Revisits
- With multiple WorldView-3 and WorldView Legion satellites orbiting our planet, daily revisits are available for most locations.
- WV4 is no longer collecting new imagery.
- Increased Collection Capacity
- WV3/4 feature 13.1-km swath widths (at nadir) with the ability to collect up to 680,000 square kilometers (sq km) of high-resolution data per day per satellite (though WV4 is dead now).
- When fully launched, WorldView Legion will feature six 30-cm satellites, significantly boosting the collection capacity of this leading high-resolution constellation.
If you are interested in WorldView-3, WorldView-4 and/or WorldView Legion imagery for your next project, please let us know by phone, 303-993-3863, or by email, sales@apollomapping.com.
You can also find more WV3 samples and technical information on our website here; WV4 samples and information can be found here; and then finally here is more information about WorldView Legion.
One of the most puzzling attacks on education has been that students aren’t learning anything, their performance on competency tests keeps getting worse, and their critical thinking and communication skills continue to falter. The burden is put on educators to fix these problems, even as teachers and faculty pay doesn’t keep up with inflation and cost of living, and as schools and universities get fewer resources every year.
Concurrently, regardless of where critics fall along the political spectrum, one thing that there seems to be some agreement on are the existential problems brought on by the omnipresence of smartphones, social media, and screen proliferation. These concerns have been more than credibly linked to mental health issues like anxiety, depression, and suicidal ideation, and while the biggest worries are saved for the kids (understandably so), they apply to adults, too.
In light of this, there has been no concerted national effort to intervene, Big Tech gets bigger and more integrated into every facet of our society, and the wellbeing of Americans get evermore unstable. There is a parallel problem tracking with our screen- and social media-induced mental and social health problems, and that is the rapidly declining pastime of reading, as recently and astutely documented in an essay by James Marriott on his Substack titled, “The dawn of the post-literate society.”
Marriott states that, “The reading revolution represented the greatest transfer of knowledge to ordinary men and women in history, [and now] the screen revolution represents the greatest theft of knowledge from ordinary people in history.” His concerns are that as individuals read less and less, we lose our critical thinking and reasoning abilities, as well as our capability to process complex ideas and sort through diverse arrays of information to determine what’s true and what’s not.

The only light most people see is that which comes from their screen. (Image retrieved from here and comes courtesy of Dayan Rodio.)
He ties the importance of reading to writing for establishing clear lines of communication and conveying well-supported positions that are intended to sway people to support important positions. Citing Walter Ong’s Orality and Literacy, Marriott said that, “Certain kinds of complex and logical thinking simply cannot be achieved without reading and writing. It is virtually impossible to develop a detailed and logical argument in spontaneous speech–you would get lost, lose your thread, contradict yourself, and confuse your audience trying to re-phrase ineptly expressed points.” These types of exchanges and debates used to be embraced in American society, but since 2010 with the rapid explosion of smartphones, apps, and social media, and then turbocharged with Trump’s entry into the political sphere in 2015, these forums and the tolerance for reasoned debates have dissipated in taste for the citizenry, instead replaced with the ephemeral indulgence of the media life cycle, an embrace of the polarizing and shocking, and a continued loss of attention spans and a collective lack of willingness to consider the alternative when it runs in the face of one’s beliefs. Marriott says we’ve entered a post-literate society.
He goes on, stating that, “If the literate world was characterized by complexity and innovation, the post-literate world is characterized by simplicity, ignorance and stagnation. It is probably not an accident that the decline of literacy has ushered in an obsession with cultural ‘nostalgia’; a desire to endlessly recycle the cultural forms of the past: the television shows and styles of the nineties, for instance, or the fashions of the early 2000s.” Instead, “our culture is being transformed into a smartphone wasteland.”
Peppered with graphs and tables from numerous large datasets, Marriott maps the declining arcs of reading, intellectual curiosity and engagement, and the loss of civil society in the United States. Putting the onus for this problem primarily on the big tech companies, he suggests that they, “Like to see themselves as invested in spreading knowledge and curiosity. In fact, in order to survive they must promote stupidity. The tech oligarchs have just as much of a stake in the ignorance of the population as the most reactionary feudal autocrat. Dumb rage and partisan thinking keep us glued to our phones.” This is not an especially groundbreaking assessment, but his tying it to another very real problem that has managed to escape our collective awareness–the decline in reading and the problems it has created–because of all of the other problems that capture our attention these days.
Marriott claims that, “These companies are actively working to destroy human enlightenment and usher in a new dark age,” a statement that seems hyperbolic on its surface but not unrealistic when one surveys the state of things in this country these days.
As an educator, I have to admit I’m part of the problem. Every year the amount of reading I “require” my students to do gets less and less–and the amount I actually expect that they’ll read declines precipitously, too. In the last decade I haven’t required a paper longer than 5 pages in a class, and those papers are becoming harder for me to read.
But the reality is, as much as formal education and educators bear some responsibility, we’re up against a seemingly insurmountable force–a society that doesn’t believe reading is important anymore but simultaneously berates educators for the state of kids’ intelligence and abilities. Marriott said that, “The result is not only the loss of information and intelligence, but a tragic impoverishing of the human experience.”
When people lose the ability–or worse, the curiosity and desire–to understand problems through the act of reading, to learn about our world, to challenge our beliefs, to really think about the complexities of that which surrounds us, then Marriott is right, we’ve lost a major aspect of what it means to be human. In its place populists, technocrats, and authoritarians rush in to fill the void, and they don’t want us to think. “Thinking is where certainty goes to die.”
Marco Esquandoles
Bookworm