
In this monthly feature, we span the globe to examine Our Changing Landscape with a time series of medium-resolution PlanetScope satellite imagery. The PlanetScope constellation dates back to 2016 and collects hundreds of millions of square kilometers of four and eight-band 3-meter imagery daily! In September, we were at Gressan, Italy, and the popular Giro d’Itaia. For the October edition of this series, we are looking at the beautiful and very remote island of Tristan da Cunha.
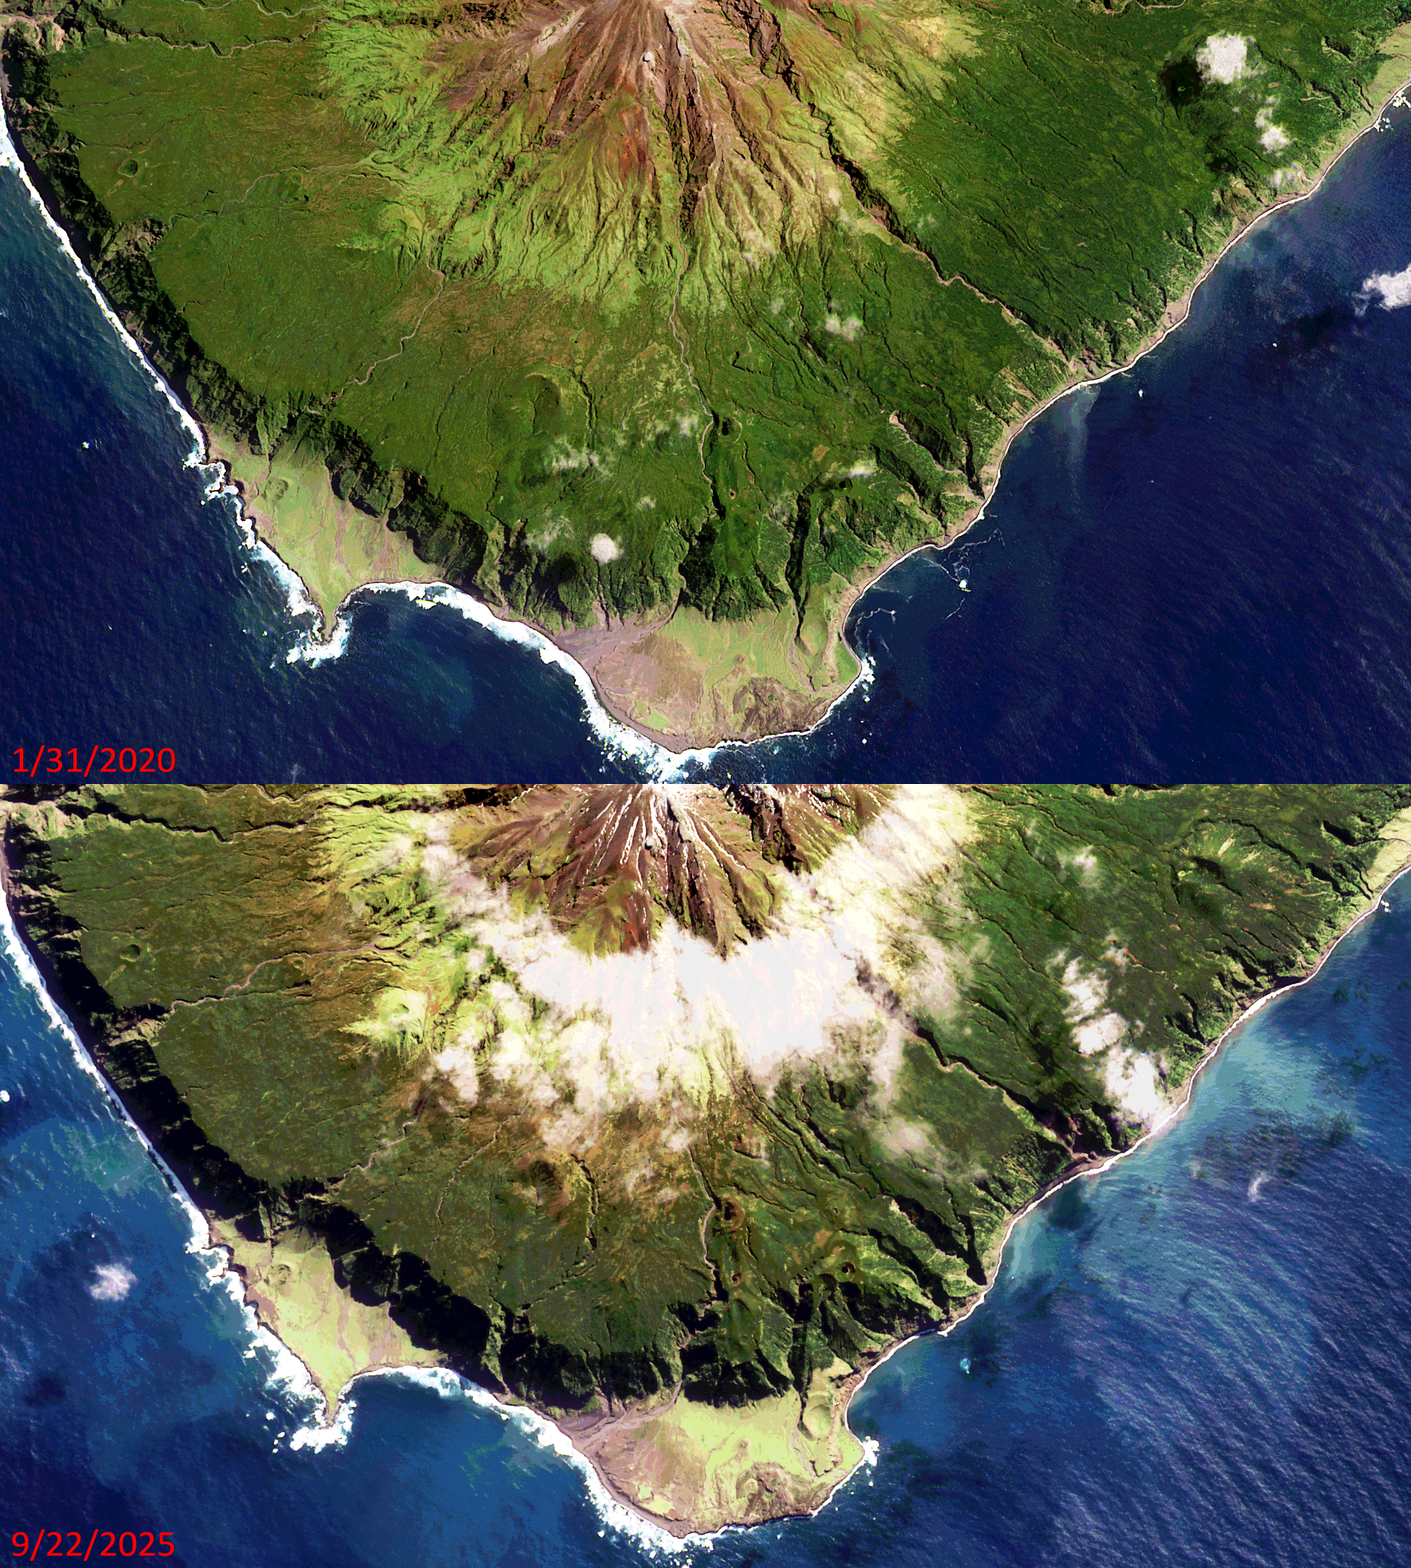 Click on the image above to see an animation of 3-meter natural color PlanetScope image collected over Tristan da Cunha on January 31, 2020 and September 22, 2025. In this animation, well to be upfront there is not much to see! Which is refreshing and quite unusual in this rapidly changing world of ours. Being one of the most remote locations on the planet has a way of doing that to a landscape – enjoy the views of this pristine volcanic island covered in lush, mostly untouched forests. (Images Courtesy: © Planet 2026)
Do you enjoy the high-resolution satellite imagery we post monthly in this article and elsewhere in The Geospatial Times? If so, head over to our Reddit subgroup, HighResSatelliteImage, where we post some our favorite high-resolution satellite images on a weekly basis.
The PlanetScope Microsat Constellation
PlanetScope is a constellation of more than 240 microsats referred to individually as Doves. Each Dove is able to collect up to 20,000 square kilometers (sq km) per day of 3-meter (m) 4-band multispectral (i.e. blue, green, red and near-infrared [NIR]) imagery; and newly launched SuperDoves collect 8-band multispectral adding in valuable red-edge spectral data. Across the constellation, PlanetScope is archiving more than 200 million sq km of medium-resolution imagery a day, making it the go to source for daily imagery over most locations. This massive archive dates back to 2016, offering the most complete and continuous record of spatial data on the planet since the start of the constellation’s ongoing launch schedule. Collecting 3-meter multispectral imagery is the equivalent of ‘high-resolution’ multispectral data imaged by a 75-centimer (cm) satellite (as this satellite would feature 75-cm panchromatic and 3-m multispectral), making PlanetScope an extremely competitively priced option at just $2.25 per sq km. With well registered images and nearly daily collections of most locations, PlanetScope is the ideal imagery source for this current-events focused series, Our Changing Landscape.
Tristan da Cunha
Tristan is an active volcanic island with rare wildlife and happens to be home to 222 British Citizens living in the world’s most isolated settlement of Edinburgh of the Seven Seas. The territory consists of the inhabited island Tristan da Cunha, which has a diameter of roughly 11 kilometers (6.8 miles) and an area of 98 square kilometers (38 sq miles); the wildlife reserves of Gough Island and Inaccessible Island; and the smaller, uninhabited Nightingale Islands.
Tristan da Cunha is a British Overseas Territory – one of the remaining former colonies that has not yet asked for independence and wants to remain linked to the United Kingdom. For Tristan, the connection dates back to 1816 when the island was garrisoned by Britain. Tristan da Cunha’s economy is based on traditional subsistence farming and fishing to provide islanders with their own food. Valuable foreign earnings come from the royalties off commercial crawfishing (or Tristan Rock Lobster) and the sale of postage stamps and coins, especially to philatelists and collectors worldwide.
Anyone wanting to visit Tristan da Cunha will have to plan ahead. All visitors need the prior approval of the administrator/Island Council, and should be prepared, upon request, to obtain a local police certificate in advance for your arrival on the island. On July 7, 2026, the island was hit by a severe storm that caused some damage and limited visitors. In fact, high winds in the storm grew to hurricane-force winds with gusts exceeding 100 mph.
If you would like to find out more about using 3-meter PlanetScope imagery for your academic studies, engineering projects or any landscape analysis, let us know at sales@apollomapping.com or (303) 993-3863.

We love maps.
We love imagery.
We love work breaks.
We hope you like them as well!
What happens when a beer festival and fair combine? You end up with Oktoberfest, the world’s largest Volksfest. It’s held annually in Munich on the Theresienwiese from mid-September to the first Sunday in October, and it serves as the world’s largest celebration of Bavarian culture.
The event draws around seven million visitors each year. In 2023, attendance reached a record 7.2 million. No surprise – visitors consumed approximately 7.4 million liters of beer that year. The festival features amusement rides, games, food stalls, and traditional Bavarian dishes.
The first Oktoberfest was held October 12, 1810, to celebrate the wedding of Crown Prince Ludwig and Princess Therese of Saxony-Hildburghausen. Today, many communities host their own local Oktoberfest celebrations, but none as huge as the one and only authentic Oktoberfest in Munich. This year’s Oktoberfest runs from September 19th through October 4th. Organizers note that this year, the beer prices range from €14.80 to €15.90, with two tents opting for a price freeze and one even deciding to lower prices.
In 2026, for the first time ever, the large festival tents will be allowed to play music on weekdays starting at 11 a.m. and on weekends starting at 10 a.m. – with the exception of opening day, of course. This year, The Fisherman’s Place is a new fun house featuring water effects. Shake & Roll also marks the return of a ride type popular with past Oktoberfest-goers.
As wildly popular as Oktoberfest is, Apollo Mapping has captured images of past events that you can view online now.
For this month’s Imagery Work Break, we feature a WorldView Legion 30-centimeter color-enhanced photo taken September 21, 2025 when the 2025 edition of the festival was underway! In the WorldView Legion image, we can see people milling about, likely sampling the adult beverages and snacks sold at Oktoberfest, as well as all the vendor tents set up for the big festival. The event, located inside a bean-shaped area, shows how popular and well attended Oktoberfest is.
Have a great rest of your workday! 😊
(Image Courtesy: Vantor. Processed by Apollo Mapping for improved grey-scale accuracy and clarity.)
¡Bienvenidos a octubre! Nosotros en Apollo Mapping estamos gustosos de tenerlos otro mes aquí en los resúmenes españoles del mes de octubre.
Productos Destacados BJ3A de 50 cm y 4 bandas
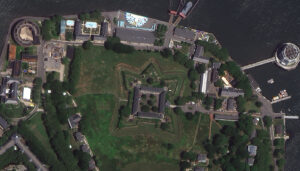 Una imagen a color de 50 cm de BJ3A capturada sobre Governor’s Island, en la ciudad de Nueva York, Nueva York, EE. UU., el 15 de junio de 2022.
¿Ha visto recientemente imágenes BJ3A de 50 centímetros (cm) y 4 bandas en Cazador de Imágenes?
Si no, ¡debería consultar el archivo ahora mismo, ya que el BJ3A de 50 cm es uno de los satélites de 50 cm con mayor nitidez disponibles en el mercado! Lanzado por Twenty First Century Aerospace Technology, con sede en Singapur, el 11 de junio de 2021, el satélite BJ3A captura datos pancromáticos con una resolución de 50 cm y datos multiespectrales con una resolución de 2 metros (m), incluidos los espectros rojo, verde, azul e infrarrojo cercano. Con un ancho de franja de 23,5 kilómetros (km), el BJ3A puede capturar una impresionante superficie de 750.000 km² al día. Puede obtener más información sobre BJ3A en nuestro sitio web y buscar el archivo de BJ3A en Cazador de Imágenes.
BJ3A forma parte de la constelación de satélites de Twenty First Century Aerospace Technology, que incluye TripleSat de 80 cm y 4 bandas, así como BJ3N de 30 cm y 4 bandas. Ahora, estos son algunos de los componentes principales del BJ3A de 50 cm:
- Bandas espectrales:
- Pancromática
- Multiespectral de 4 bandas (azul, verde, rojo e infrarrojo cercano [NIR])
- Resolución del sensor:
- En el nadir – 50 cm pancromática y 2 m multiespectral
- Rango de longitud de onda de las bandas espectrales: (en nm)
- Pancromática – 450 a 700
- Azul – 450 a 520
- Verde – 520 a 590
- Rojo – 630 a 690
- NIR – 770 a 890
- Rango dinámico: 12 bits
Si está interesado en obtener más detalles sobre cómo las imágenes satelitales BJ3A de 50 cm pueden ayudar en su próximo proyecto de cartografía, envíenos un correo electrónico a sales@apollomapping.com y nos pondremos en contacto con usted de inmediato.
Vista de Pájaro – Ciudad del Cabo, Sudáfrica

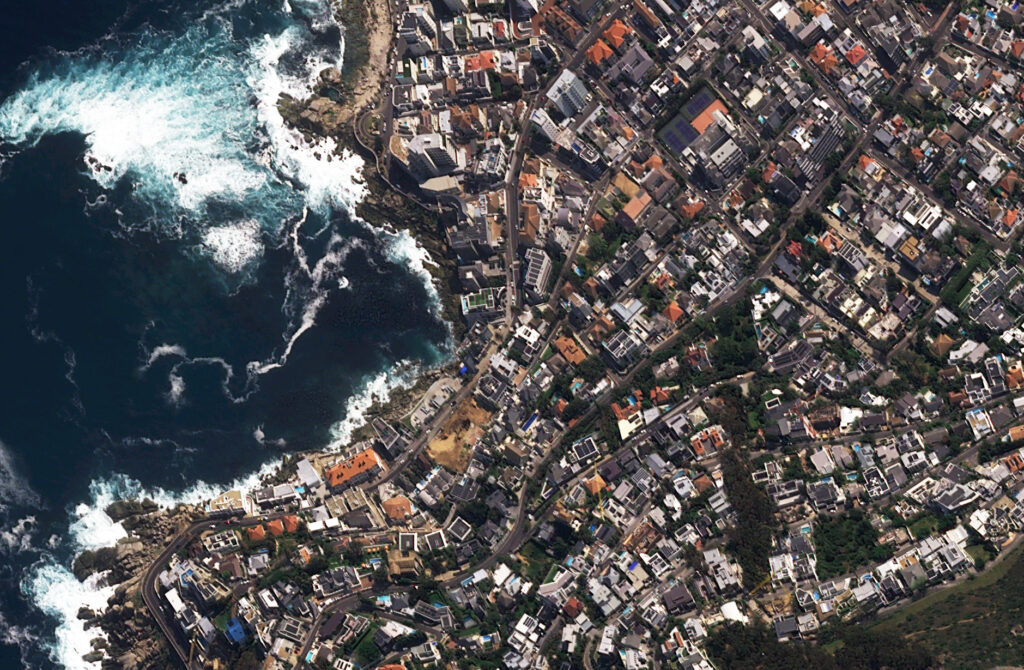 Este mes presentamos una imagen satelital con vista de pájaro de Pléiades Neo 3, capturada sobre Ciudad del Cabo, Sudáfrica, el 6 de octubre de 2024. Estas imágenes oblicuas cuentan con una resolución nativa de aproximadamente 50 centímetros. ¡Estamos listos para pasar un tiempo en la playa de Ciudad del Cabo… siempre y cuando los grandes tiburones blancos también estén de vacaciones! (Imágenes satelitales © 2026 Airbus)
En este artículo habitual, presentamos una nueva imagen satelital con vista de pájaro de un lugar seleccionado alrededor del mundo; y este mes nos dirigimos al otro lado de África con una vista oblicua de Ciudad del Cabo, Sudáfrica.
¿Qué es una imagen satelital con vista de pájaro?
¡Es una excelente pregunta y con gusto la respondemos! Cuando un satélite captura imágenes de la superficie terrestre, siempre existe cierta inclinación de la cámara mientras observa hacia abajo. Esta inclinación se denomina ángulo fuera del nadir (off-nadir) y se mide en grados a partir de 0. Por lo tanto, un ángulo de 0° fuera del nadir significa que el satélite apunta directamente hacia el suelo cuando captura la imagen, mientras que un ángulo de 90° fuera del nadir significa que el satélite apunta hacia un lado y ni siquiera está observando el terreno debajo de él. La gran mayoría de las imágenes satelitales se capturan con un ángulo fuera del nadir inferior a 30°. Sin embargo, en ocasiones poco frecuentes, ya sea por solicitud de un cliente o para capturar un desastre natural u otro acontecimiento importante, un satélite puede inclinarse y capturar imágenes con un ángulo de entre 35° y 50°, lo que consideramos ideal para imágenes con un alto ángulo fuera del nadir, también conocidas como imágenes con vista de pájaro o imágenes oblicuas. Estas imágenes con vista de pájaro ofrecen una perspectiva única de las imágenes satelitales, proporcionando una vista amplia del paisaje desde un ángulo lateral. Esperamos que disfrute las imágenes satelitales con vista de pájaro que compartimos en este artículo. Si tiene alguna pregunta sobre este tipo de datos o sobre cualquiera de los productos de imágenes que podemos ofrecerle, envíenos un correo electrónico en cualquier momento a sales@apollomapping.com.
Si está interesado en imágenes satelitales adicionales con vista de pájaro de esta ubicación, visite nuestro subgrupo de Reddit, BirdsEyeViewImagery, y únase a la comunidad. Publicamos imágenes satelitales con un alto ángulo fuera del nadir todos los viernes en el subgrupo BirdsEyeViewImagery, la mayoría de las cuales no se publican aquí.
PRODUCTO DESTACADO – Datos WorldView + PlanetScope de 8 bandas
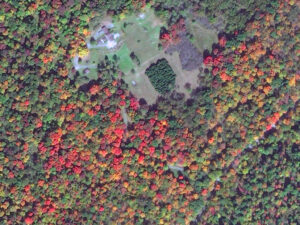 Imagine trabajar con esta colorida imagen WorldView-2 de 50 cm con 8 bandas. Eso significa el doble de información espectral por el mismo bajo costo. Esta imagen WorldView-2 de 50 cm de Maxar fue capturada sobre Central City, Pensilvania, el 1 de octubre de 2012.
¿Sabía que, debido a los recientes cambios en los precios de las imágenes satelitales de 8 bandas y alta resolución de WorldView-2, WorldView-3 y WorldView Legion, ahora puede solicitar esta información espectral adicional por el mismo precio que los datos de 4 bandas? ¡Sí, lo escuchó bien! Entonces, ¿por qué no mejorar su análisis espectral sin ningún costo adicional?
Además, quizá no sepa que la mayoría de las imágenes PlanetScope de 3 metros también pueden entregarse con 4 u 8 bandas por el mismo costo.
Entonces, cuando llegue el momento de comenzar un proyecto que incluya detección de cambios, clasificación de uso y cobertura del suelo, análisis de vegetación y/o cualquier otro tipo de análisis espectral, ¿por qué no utilizar datos WorldView o PlanetScope de 8 bandas por el mismo costo?
Envíenos un correo electrónico en cualquier momento para mejorar su análisis espectral sin costo adicional, utilizando imágenes satelitales de 8 bandas en su próximo proyecto geoespacial.
Fernando Gutierrez
Topographic Translator
As an educator and curriculum theory enthusiast, I found that understanding students as individuals improved both my teaching and their long-term success. Personality types and natural preferences can shape how productive, collaborative, and positive people feel. Popular assessments I’ve used or been asked to complete include the Enneagram, True Colors, the Myers-Briggs Type Indicator, and Clifton Strengths. Understanding ourselves and one another influences how we work, analyze, and respond. Social media platforms attempt something similar by tracking the content that holds our attention, then using algorithms to show us more of it and keep us engaged.
If you work with students, the semester’s novelty may have faded into schedules, deadlines, and perhaps concern about grades at the halfway point. In the office, the glow of vacation may have given way to meetings and routine frustrations. It may be time for a boost – a positively powered pep rally. How can we create one here? We can turn to memorable quotes, practical wisdom, and healthy perspectives from people who are smart, successful, kind, famous, or unexpected. Inspirational quotes offer quick perspective, emotional validation, and a mental spark that can shift your mindset.
 Created in Canva by BD.
Why can quotes inspire us? A Fast Company article notes, “If your teacher, coach, or mentor believes you can do something, you’re more likely to do it.” People are drawn to “well-expressed wisdom,” and rhyme or parallel phrasing can make ideas more memorable. Confession: I keep a thick folder and a growing collection of inspirational Instagram stories, along with a box of kind notes labeled, “Need a lift?” I know – it’s a problem. So, let’s have some fun pairing traditional encouragement with mappy and geospatial wisdom.
Courage & Affirmation
- “I am in the right place at the right time, doing the right thing.” Louise Hay
- “Courage starts with showing up and letting ourselves be seen.” Brené Brown
- “Make way for the unprecedented and watch your reality rearrange itself.” Yrsa Daly-Ward
- “You are loved just for being who you are, just for existing.” Ram Dass
- “The chance to love and be loved exists no matter who you are.” Oprah
Map Fun
- “Born to map, forced to attend meetings.”
- “ELLIPSOID – Perfect in Theory, Distorted in Reality.”
- “Friends don’t let friends use the Mercator projection.”
- “I map, therefore I am.”
- “I have many layers.”
GIS Pick-Up Lines & Puns
- “How do GIS folks find a spouse? They datum.”
- “You complete my polygon.”
- “Ay, baby, are you an attribute table? ‘Cause I’d like to join and relate myself to you.”
- “Your contours are so fine, I’m delineating watersheds all over your body.”
GIS Office
- “Save work early and often.”
- “Everything is related to everything else, but near things are more related than distant things.” Tobler
- “Everything is somewhere. But understanding why things are where they are is a different story.”
- “The application of GIS is limited only by the imagination of those who use it.” Jack Dangermond
- “GIS is waking up the world to the power of geography, this science of integration, and has the framework for creating a better future.” Jack Dangermond
- “GIS is not just a tool, it’s a way of thinking.” Tanish Brown
- “GIS is not just about mapping, it’s about understanding the world around us.”
Maps
- “I wisely started with a map and made the story fit (generally with meticulous care for distances).” J. R. R. Tolkien
- “A map is the greatest of all epic poems. Its lines and colors show the realization of great dreams.” Gilbert H. Grosvenor
- “Knowing where things are, and why, is essential to rational decision making.”
I hope you found some inspiration, shared a laugh, discovered someone new, created a little cubicle art, or simply paused to reflect – all worthwhile outcomes. I’ll leave you with my favorite reminder: “Bloom where you’re planted.” Life takes us to places that are both rewarding and challenging. When we learn to thrive wherever we are, we keep moving forward and make the best of our circumstances.
If you need me, I’ll be reorganizing my folder…maybe it’s time to go digital.
Barbaree Duke
Geospatial Crusader
If you are searching for medium and high-resolution satellite imagery, the search is over as Image Hunter is the solution you’ve been looking for! Featuring satellite and aerial imagery as well as digital elevation models (DEMs) from a constantly expanding list of 70+ constellations/datasets and 19 vendors, our database contains more than 500-million images/records meaning there is just no other website out there with this breadth of commercial data products. Our interface is slim-lined and modern, loading quickly on all platforms, browsers and operating systems. Further, our database is updated multiple times an hour with the most recent images collected by WorldView-3, Pléiades 1, PlanetScope, SuperView Neo and many more so you are sure to get the most current view of all the imagery and DEM databases we work with. Once you submit your request, an Apollo Mapping representative will be in touch within 4 Illinois business hours to get you the pricing information you need for your project.
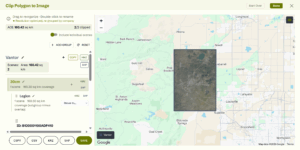
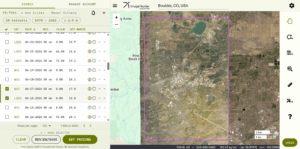 Our new Clip Polygon To Image tool is live! Give it a try to automatically calculate the coverage areas of a complex set of imagery from various data vendors and satellite constellations.
So why wait? Give Image Hunter a try now to find the imagery and/or DEM data you need for your next mapping project!
Key Improvement(s) From The Past Month
We have been quite busy working on Image Hunter in the past month as we introduced a new, more user-friendly GUI that features both a light and dark mode. In fact, this new GUI is a sneak preview of our new website which should launch in the next month or two. On top of redesigning the entire GUI, we crushed a plethora of bugs as you will see in the list below – see you next month!
Here is a summary of the changes/improvements we made to Image Hunter during the past month:
- Introduced a new, user-friendly GUI for Image Hunter with both light and dark modes, as well as improved support for mobile devices.
- Improved backend API stability for vendor updates and AOI queries.
- The KOMPSAT API can go offline at times and impact query speeds, we implemented a fix so speed is not impacted.
- Some SuperView and SuperView Neo images were displayed with the wrong collection date, not anymore.
- The unsubscribe link did not work in Data Alert emails, now it does.
- Vantor previews now render faster with improved reliability.
- Tweaked the area calculation in the Clip Polygon To Image tool so it closer matches vendor calculations.
- Restored sanity in the mapping world by changing Lake America to its correct name, Lake Ontario.
Data Alert – An Automated Daily Imagery Search
Have you checked out Data Alert which lets you define an area of interest anywhere around the globe, the resolution your project requires and the number of months we should keep the alert active? Once an alert is set up, we check for new data over your area of interest every single day, and send you an email when we find coverage that meets your specifications. We have a short YouTube video with directions to set up a Data Alert, check out the last video; and we have written directions for Data Alert here.
The Sensors Available in Image Hunter
As you might have seen in past articles, we now feature hourly updates (seriously!) of GeoEye-1, KOMPSAT 3/3A, Pléiades 1 and Neo, SPOT 6/7, SuperView-1/2/Neo, WorldView-1/2/3/Legion!
Image Hunter can be accessed 24 hours a day, 7 days a week and is a one-stop shop for every major source of medium and high-resolution satellite (and aerial!) imagery on the market today, including:
- WorldView Legion
- WorldView-4
- WorldView-3
- WorldView-2
- WorldView-1
- QuickBird
- GeoEye-1
- IKONOS
- EROS B
- KOMPSAT-3A
- KOMPSAT-3
- KOMPSAT-2
- Pléiades 1 constellation
- Pléiades Neo constellation
- TerraSAR-X (TerraSAR-X, TanDEM-X and PAZ)
- GEOSAT-1
- GEOSAT-2
- TripleSat
- BJ3A
- BJ3N
- SPOT 1 to 7 constellation
- RapidEye
- GaoFen-2
- GaoFen-1
- ZiYuan-3 01/02 (mono and stereo!)
- FORMOSAT-5
- FORMOSAT-2
- ALOS PRISM (stereo)
- AW3D Standard (DEM)
- SkySat constellation
- PlanetScope constellation (including 5-band SuperDove data)
- SuperView-1 constellation
- SuperView-2
- SuperView Neo-1 01/02/03/04
- SuperView Neo-3 01/02
- Landsat 1-8
- TeLEOS-1
- DS-EO
- Hexagon (HxGN Content Program aerial imagery) imagery + DEM
- WorldDEM
- WorldDEM Neo
- Vricon DEMs
- Orbita Hyperspectral Satellite (OHS)
- KazEOSat-1
- KazEOSat-2
- Jilin-1 Optical
- Jilin-1 Video (including nighttime imagery)
- Jilin-1 GF/DP
- Jillin-1 KF
- Orbita Video Satellites-1/2/3 (OVS-1/2/3)
- BlackSky Global series
Key Features of Image Hunter
If any of our readers have struggled with other geospatial search engines that are clunky, only query one data source and/or do not provide image previews, then Image Hunter is the solution to your woes as it features:
- Online browsing of satellite and aerial imagery from 19 data providers and 56 satellite and aerial imagery derived datasets.
- Near-instantaneous loading of low-resolution preview imagery with collection date, cloud cover and other key metadata.
- The ability to define your area of interest by address, coordinates, geometric shape or shapefile/KMZ.
- A responsive basemap with street names to provide spatial context when discovering data as well as crowd-sourced updates for the most accurate map possible.
- Exports of the area of interest you create as well as the scenes you select in shapefile or KMZ format.
- Support for all operating systems, and not just our friends with Windows machines!
Image Hunter can be accessed here all day and night, we are excited to find out what you think about our imagery search engine! So if you have any ideas and/or feedback to improve Image Hunter, please let us know at sales@apollomapping.com or (303) 993-3863.

Cricket’s Chirp is created for Apollo Mapping by Ron Ruelle, a Northwest Ohio (formerly Boulder, CO) based cartoonist, lllustrator and teacher. No animals are harmed in the creation of these comics, but Ron sometimes breaks a pencil in frustration. He has a new collection of his weekly Skelton Comics available at www.ronruelle.com
- Are you ready for your monthly does of all-things technology? If so, please do read on!
Chewing this gum could help you fight cancer.
A new planet-searching telescope clears last major launch hurdle.
First material with quantum properties at room temperature.
Bacteria can clean radioactive uranium from groundwater.
Our diets can influence our evolution as well.
Wool could help us regrow human bones.
Nature can process bioplastics in multiple ways.
These tiny robots hunt bacteria.
Wow, a soft tissue sample some 450 million years old!
New catalyst to break plant waste down into valuable byproducts.
Microbial life could survive on the Moon.
This tiny satellite could observe some of the oldest signals in the Universe.
A lower-energy method to print a crucial metal alloy for extreme environments.
Ultra-thin diamond layers can transmit electricity.
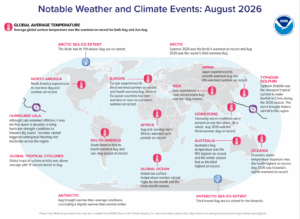 The summer of 2026 was the Arctic’s warmest on record and August 2026 was the region’s third warmest August. The Antarctic saw its third lowest August ice extent in 2026. In Africa, August and June-August were Africa’s warmest such periods on record. North America experienced its warmest August and summer on record. Hurricane Lala remained offshore, but was the first storm in decades to bring hurricane-strength conditions to Hawaii’s Big Island. Torrential rainfall triggered widespread flooding and mudslides across the region. Global tropical cyclone activity was above average with 19 named storms in August. Typhoon Dolphin was the strongest tropical cyclone to make landfall in China during the 2026 season. The storm brought historic rainfall to the region. (Image Credit: NOAA Global Climate Report)
- The Global Climate Change Report for August 2026 has been released by NOAA’s National Centers for Environmental Information and reveals further proof that global climate change remains a concern. In August 2026, the global surface temperature was 1.32°C (2.38°F) above the 20th Century average – the warmest August in the 1850 to 2026 record, eclipsing the previous tied records set in 2023 and 2024 by 0.08°C (0.14°F). It marked the 48th consecutive August with global temperatures above the 20th Century average (the last below-average August occurred in 1978). All 10 of the warmest Augusts on record have occurred since 2016, with the last four years (2023–2026) representing the four warmest. Notably, August 2026 was the fourth-consecutive August with a temperature departure exceeding +1.0°C (+1.8°F), ranking as the sixth-highest temperature departure for any month in the 2,120-month record. Global oceans set an all-time high temperature departure for any month on record at 1.08°C (1.94°F) above average. Driven by record-high surface temperatures across the central and eastern tropical Pacific Ocean zone, alongside record warmth across parts of the Arctic, Atlantic, Indian, and Southern oceans, the global ocean surface temperature surpassed the previous August 2023 record by 0.06°C (0.11°F); and the previous tied all-time monthly high set in January and February 2024 by 0.05°C (0.09°F). August 2026 marked the third consecutive month of record-breaking global ocean heat and only the second time an August ocean temperature departure surpassed 1.0°C (1.8°F).
- Long before today’s state lines, cities and highways appeared on maps, Indigenous people lived across the lands that later became the United States. This Indigenous Peoples’ Day, Americans can use interactive maps and Geographic Information System, or GIS, to learn more about tribal lands, Indigenous geography and the Native communities that remain an important part of the country today. Indigenous Peoples’ Day is observed on the second Monday in October and recognizes the histories, cultures and contributions of Native American and Indigenous people. Maps offer one way to explore that history, but they also show that Indigenous America isn’t simply part of the nation’s past. Tribal nations exist throughout the United States still today, and federal agencies and tribes use sophisticated GIS technology to map and manage land and natural and cultural resources. The U.S. Bureau of Indian Affairs’ Branch of Geospatial Support maintains public GIS datasets and mapping tools related to Indian Country. Among the resources is the BIA Tract Viewer, which displays mapped tribal, individually allotted and jointly managed tracts and parcels associated with tribal land area codes. The agency’s GIS program has a practical purpose beyond creating maps. The BIA says it provides GIS software, training and technical assistance to federally recognized tribes and Indian Affairs offices to help manage cultural and natural resources. Tribes use GIS for land management and analysis involving forests, wildfires, irrigation, flood plains, oil and gas resources and other issues. The U.S. Census Bureau provides another nationwide source of Indigenous geographic information. Its cartographic boundary files include downloadable national GIS data for American Indian and Alaska Native areas and Hawaiian homelands. The Census Bureau also provides geographic files for American Indian tribal subdivisions, Alaska Native Regional Corporations, tribal census tracts and tribal block groups. The Census Bureau’s TIGER/Line program provides detailed geographic datasets that can be downloaded and used with GIS software. Available American Indian geographic datasets include American Indian, Alaska Native and Native Hawaiian areas; tribal subdivisions; Alaska Native Regional Corporations; tribal block groups; and tribal census tracts. The connection between GIS and Indigenous Peoples’ Day isn’t limited to looking at historical maps. GIS also is used by tribal governments today. The Bureau of Indian Affairs provides ArcGIS and other geospatial resources to participating federally recognized tribal governments. According to the agency, tribes use GIS to map and manage cultural and natural resources and contribute to datasets benefiting Indian Country. The technology can be used for everything from forestry and real estate to natural-resource management and land surveying. The BIA also is working on a parcel-mapping project designed to improve how geographic information about tribal lands is collected and shared.
Brock Adam McCarty
Map Wizard
(720) 470-7988
brock@apollomapping.com

If any of our clients have tried to order high-resolution imagery during the past six months over the Middle East (and even some places in Europe and North America), you might have run into significant hurdles given the implementation of no-go security zones where high-resolution imagery and digital elevation models (DEMs) just cannot be delivered. These security zones are the direct results of the ongoing regional conflict between the Trump administration and Iran. As tensions have come down a bit in the past weeks, these security zones have shrunk significantly in geographic coverage.
So if you still need high-resolution satellite imagery and/or DEM’s over sensitive regions around the Middle East (or the rest of the globe), please send us your area of interest and project description in a quick email to sales@apollomapping.com and we would be happy to check if we can deliver the mapping products you need!