
 This map shows the areas imaged by the WorldView-2/3 constellation from March 1 to May 31, 2025 over the Middle East. Please note that in many instances, multiple images were collected over the same area which is difficult to portray on this static map.
In this monthly piece, we give our readers a sense of the high-resolution imagery coverage collected over a geography during a specified window. To do this, we pick a high-resolution satellite constellation, a defined time period and area of interest, then report key statistics on the total amount of imagery collected in square kilometers (sq km). Without further delay, let’s jump into our analysis.
Graphic Region of Interest: Middle East
Land Mass Covered: 6,674,329.3 sq km
Time Period: March 1 to May 31, 2025
High-Resolution Satellite Constellation: WorldView-2/3
WorldView-2/3 Constellation Imaging Statistics–Middle East
Total Area Collected: 2,367,187.5 sq km; 12,865.1 sq km per satellite/per day
Area Collected @ 20% or Less Clouds & 30 Degrees or Less Off-Nadir: 1,717.954.2 sq km; 9,336.7 sq km per satellite/per day; 72.57% of total
During my travels, I began to observe an increasing number of roundabouts appearing in various communities. Each time I encounter one while driving, it brings back memories of my very first experience navigating a roundabout. I was a freshman in college, twelve hours from home without a car. Whenever anyone was going shopping, I easily volunteered to join. When my new friend down the hall offered a ride around town on a beautiful spring day, the answer was easily, “Yes!” I didn’t know the roads or have my bearings…or a paper map handy. That initial drive stands out in my memory–windows down, music playing, and a sense of adventure. The excitement, however, quickly turned to confusion when I realized we had no idea where we were.
 A screenshot from Image Hunter and modified in Canva by Barbaree.
How do we get back to campus? No map. “Let’s go this way” led us to “The Circle.” This type of road was a first for both of us. This one was particularly complex with 5 roads, each two to four lanes. We zoomed on and after one round, we realized that we didn’t know how to exit, especially in the thick traffic. We must have zoomed around that circle at least 5 times shouting and screaming before bravely shooting off in a direction to try. We survived and discovered that we were about a mile and a half way from campus. Go ahead and laugh. We did! And still do.
I’m encountering more and more of these traffic structures, not all created evenly. Just this week I encountered one that was two laned with concrete medians to navigate upon exit from the center circle. I felt like I was in a scene at the Arc de Triomphe in Paris. I entered and exited incorrectly multiple times. There were only 4 exits, but I was out of practice. Of course this makes me think! How many other weird, time-saving, mind bending traffic gadgets are there?
Traffic is an interesting rabbit hole filled with traffic flow maximization, congestion theory, and mathematical modeling. The U.S. Department of Transportation acknowledges a few intersection types: roundabouts, stop-controlled, signalized, reduced left-turn conflict, crossover, and other designs. Their site even has a video of the roundabout rules. (I could have used this one 40 years ago!) I certainly can identify with the disadvantages: learning curve (check), confusion potential (check), and potential costs. I can agree with one advantage: slows traffic. (because we’re confused…hello!) Near my home we have other options, among the “other category,” starting to appear. The reduced left-turn conflict feels very odd as it forces a controlled U-turn down and beyond the road for all traffic turning left. We also have a diverging diamond that seems like someone moved the road for construction (driving on the wrong side) and forgot to put the regular pattern back. Research shows that these innovative designs can keep us up to 80% more safe. That’s a statistic we like to see.
Where in the world are some of the most interesting intersections? The Top 5 video group created the top, most complex road intersections. The list of global locations ranges from beautifully lit and designed to downright scary to me. I encourage you to watch the video or zoom in with your favorite satellite view to see them for yourself.
- The Nanpu Bridge Interchange in Shanghai, China
- Meskel Square near Addis Ababa, Ethiopia
- The Gravelly Hill Interchange in Birmingham, UK
- Kathipara Junction, Chennai, India
- Jacksonville’s Turbine Interchange in Jacksonville, FL
- The Judge Harry Pregerson Interchange, Los Angeles, CA (made famous in the 90s movie Speed)
- The Eysturoy Tunnel in Faroe Islands, Denmark (home to the world’s first undersea roundabout)
- The Plough Roundabout, Hemel Hempstead, UK
- High Five Interchange in Dallas, TX (one of first and tallest interchange of its kind)
- The Magic Roundabout in Swindon, UK (seven roundabouts in one interchange!)
- Times Square in New York, NY
- Origami Intersections in Santa Monica, CA (public art carved into the roadway)
- Shibuya Crossing in Tokyo, Japan (1000-3000 people cross during a given traffic stop; also near the faithful dog Hachiko’s famous post)
- The Arc de Triomphe made number one on their list. (12 radiating avenues)
How many of these have you experienced? Do you have some fun traffic adventures? Are you the geospatial professional responsible for these crazy “adventures”?
I enjoy a roadtrip! Even now, every roundabout I pass reminds me of my dear friend. Our bond remains strong, often leading us to laugh together about that spring day in Texas when getting “lost” became a joyful adventure.
If you need me, I’ll be plotting my next trip. I have new tires on my car and I’m ready to roll!
Barbaree Duke
Geospatial Crusader

Cricket’s Chirp is created for Apollo Mapping by Ron Ruelle, a Wilmington, NC (formerly Boulder, CO) based cartoonist, lllustrator and teacher. No animals are harmed in the creation of these comics, but Ron sometimes breaks a pencil in frustration. You can see more of his work at www.ronruelle.com
 A 50-cm color SuperView Neo-3 image collected over Washington, DC on December 12, 2024.
Have you noticed 50-centimeter (cm) 8-band SuperView Neo-3 in Image Hunter? If you have used our imagery search engine recently, I bet you have seen tons of SuperView Neo-3 (SVN3) data given its massive footprint that is some 130-kilometers (km) wide, as well as an aggressive speculative tasking program by the vendor!
A part of the SuperView Neo constellation, Neo-3 differentiates itself from its satellite twins, Neo-1 01/02, with 2-meter (m) 8-band multispectral imagery as well as an industry-leading 130-km wide footprint. SuperView Neo-3 also images at 10° or less off-nadir so there is less tilt in the data, which is crucial in areas with tall buildings, trees, and mountains as well as those with deep, narrow passages. A massive 130-km wide footprint allows Neo-3 to collect an impressive 1.4 million sq km of 50-cm 8-band data daily.
Here are a few of the specifications that set SuperView Neo-3 apart from the competition:
- 50-cm panchromatic and 2-m 8-band multispectral, including blue, green, red and near infrared (NIR) plus coastal blue, yellow, red edge and NIR2.
- All images collected at 10° off-nadir or less.
- 130-km wide image footprint.
- 1.4-million sq km per day collection capacity.
So, if you are looking to uplevel your next spectral analysis, 50-cm 8-band SuperView Neo-3 is sure to be one of your go-to satellites.
You can query 50-cm SuperView Neo-3 on Image Hunter at any time! And if you have additional questions about using SuperView Neo-3 for your next mapping project, you can contact us now at sales@apollomapping.com.
If you are searching for medium and high-resolution satellite imagery, the search is over as Image Hunter is the solution you’ve been looking for! Featuring satellite and aerial imagery as well as digital elevation models (DEMs) from a constantly expanding list of 60+ constellations/datasets and 19 vendors, our database contains more than 200-million images/records meaning there is just no other website out there with this breadth of commercial data products. Our interface is slim-lined and modern, loading quickly on all platforms, browsers and operating systems. Further, our database is updated multiple times an hour with the most recent images collected by WorldView-3, Pléiades 1, PlanetScope, SuperView-1 and many more so you are sure to get the most current view of all the imagery and DEM databases we work with. Once you submit your request, an Apollo Mapping representative will be in touch within 4 Illinois business hours to get you the pricing information you need for your project.

So why wait? Give Image Hunter a try now to find the imagery and/or DEM data you need for your next mapping project!
Key Improvement(s) From The Past Month
It’s been a big month for Image Hunter! First, we welcome in the final two satellites of the 30-cm WorldView Legion constellation with the additions of WorldView Legion 5 and Legion 6. This means that more than 3 million square kilometers of 30-cm WorldView Legion data is added to our archive daily, woot woot!! And then, just at the end of the month, we pushed the first step of our next big Image Hunter improvement live, which is exact image footprints, bye bye minimum bounding rectangles. What this means for our users is that you will see less false results which were caused by these minimum bounding rectangles; in the future these exact footprints will let us introduce our next big tool–we are so excited!
Here is a summary of the changes/improvements we made to Image Hunter during the past month:
- Added in 30-cm, 8-band WorldView Legion 5 and Legion 6.
- Introduced exact image footprints for the vast majority of imagery and DEM datasets.
- Improved the stability of multiple high-resolution satellite imagery updates.
- Updated several backend code bases.
Data Alert–An Automated Daily Imagery Search
Have you checked out Data Alert which lets you define an area of interest anywhere around the globe, the resolution your project requires and the number of months we should keep the alert active? Once an alert is set up, we check for new data over your area of interest every single day, and send you an email when we find coverage that meets your specifications. We have a short YouTube video with directions to set up a Data Alert, check out the last video; and we have written directions for Data Alert here.
The Sensors Available in Image Hunter
As you might have seen in past articles, we now feature hourly updates (seriously!) of GeoEye-1, KOMPSAT 3/3A, Pléiades 1 and Neo, SPOT 6/7, SuperView-1/2/Neo, WorldView-1/2/3/Legion!
Image Hunter can be accessed 24 hours a day, 7 days a week and is a one-stop shop for every major source of medium and high-resolution satellite (and aerial!) imagery on the market today, including:
- WorldView Legion
- WorldView-4
- WorldView-3
- WorldView-2
- WorldView-1
- QuickBird
- GeoEye-1
- IKONOS
- EROS B
- KOMPSAT-3A
- KOMPSAT-3
- KOMPSAT-2
- Pléiades 1 constellation
- Pléiades Neo constellation
- TerraSAR-X (TerraSAR-X, TanDEM-X and PAZ)
- GEOSAT-1
- GEOSAT-2
- TripleSat
- BJ3A
- BJ3N
- SPOT 1 to 7 constellation
- RapidEye
- GaoFen-2
- GaoFen-1
- ZiYuan-3 01/02 (mono and stereo!)
- FORMOSAT-5
- FORMOSAT-2
- ALOS PRISM (stereo)
- AW3D Standard (DEM)
- SkySat constellation
- PlanetScope constellation (including 5-band SuperDove data)
- SuperView-1 constellation
- SuperView-2
- SuperView Neo-1 01/02
- SuperView Neo-3
- Landsat 1-8
- TeLEOS-1
- DS-EO
- Hexagon (HxGN Content Program aerial imagery) imagery + DEM
- WorldDEM
- WorldDEM Neo
- Vricon DEMs
- Orbita Hyperspectral Satellite (OHS)
- KazEOSat-1
- KazEOSat-2
- Jilin-1 Optical
- Jilin-1 Video (including nighttime imagery)
- Jilin-1 GF/DP
- Jillin-1 KF
- Orbita Video Satellites-1/2/3 (OVS-1/2/3)
- BlackSky Global series
Key Features of Image Hunter
If any of our readers have struggled with other geospatial search engines that are clunky, only query one data source and/or do not provide image previews, then Image Hunter is the solution to your woes as it features:
- Online browsing of satellite and aerial imagery from 19 data providers and 56 satellite and aerial imagery derived datasets.
- Near-instantaneous loading of low-resolution preview imagery with collection date, cloud cover and other key metadata.
- The ability to define your area of interest by address, coordinates, geometric shape or shapefile/KMZ.
- A responsive basemap with street names to provide spatial context when discovering data as well as crowd-sourced updates for the most accurate map possible.
- Exports of the area of interest you create as well as the scenes you select in shapefile or KMZ format.
- Support for all operating systems, and not just our friends with Windows machines!
Image Hunter can be accessed here all day and night, we are excited to find out what you think about our imagery search engine! So if you have any ideas and/or feedback to improve Image Hunter, please let us know at sales@apollomapping.com or (303) 993-3863.
- All of my nerds out there, get ready for your favorite part of our monthly newsletter, i.e. our list of technological advances!
Plants can create their own limestone mineral source.
Super-charged photosynthesis in bacteria.
Ancient rivers mapped below Antarctic ice sheets.
Bacteria can weave materials stronger than steel with the flexibility of plastic.
This sugar from a marine bacteria causes cell cancers to self-destruct.
Converting carbon dioxide in seawater into usable products.
New, more environmentally friendly plastic developed.
Here is another sustainable bioplastic.
Is this molecule the one that sparked life on Earth (and beyond)?
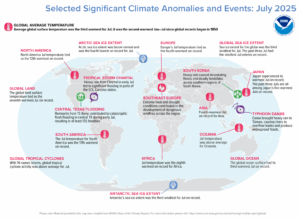
The sea ice extent for the globe was the third smallest for July. The past three July measurements had the smallest July measurements on record for that year. The global ocean surface had its third warmest July on record while Antarctica’s sea ice extent with the third smallest for July on record. With 14 named storms, global tropical cyclone activity was above average for July. Remnants from Tropical Storm Barry contributed to catastrophic flash flooding in central Texas during early July, leading to at least 135 fatalities. Extreme drought and heat contributed to the development of dangerous wildfires across southeast Europe. (Image Credit: NOAA Global Climate Report)
- The NOAA Global Climate Change Report for July 2025 has been released by the National Centers for Environmental Information and reveals further proof that global climate change remains a concern. July 2025 recorded a global surface temperature 1°C (1.80°F) higher than the 20th Century average, making it the third warmest July since records began in 1850. Only July 2024 (warmest) and July 2023 were warmer. All 10 warmest Julys on record have occurred since 2016. July 2025 also marks the 49th consecutive July with above-average global temperatures. The global ocean-only surface temperature for July 2025 was the third highest on record at 0.92°C (1.66°F) above average. This was cooler than July 2023 (warmest) and July 2024. For land areas, the global land-only surface temperature in July tied as the seventh warmest on record at 1.20°C (2.16°F) higher than the 20th Century average. This was the smallest July land temperature anomaly since 2019 and the smallest for any month since December 2022 (+1.16°C / +2.09°F). In July 2025, most of the globe experienced warmer-than-average temperatures. The most significant high temperature anomalies, exceeding 1.0°C (1.8°F) above average, happened over Europe, southern Asia, the northern Pacific Ocean, and parts of North and South America, central-western Antarctica, and the North Atlantic Ocean. Record-high July temperatures were limited to areas within southern and eastern Asia, the Arctic region, the western and southern Pacific Ocean, and parts of the Southern Ocean. Overall, record-high July temperatures were observed across close to 6% of the Earth’s surface. Regionally, Asia and Europe (tied) had their fourth warmest July on record. The Arctic region, Africa, and the Caribbean region had their seventh warmest, eighth warmest, and ninth warmest (tied) July on record, respectively. North America, South America, Oceania, and the Hawaiian region all had above average July temperatures, though none ranked among their ten warmest Julys on record. Contrasting with other regions, the Antarctic region had a slightly below-average July temperature departure of -0.02°C (-0.04°F). This was the coldest July for the region since 2016.
- King–queen–rook–bishop–knight. All are pieces in the game of chess, which is celebrated September 1 during American Chess Day. Using a checkers-style board, players take turns strategically moving their pieces about the 64-square board. To win, a player must use their pieces to capture those of their opponent with the ultimate goal of taking over the other player’s king. That’s when the player shouts: checkmate! Often called “The Game of Kings,” you can play chess with another player in person or on the computer with opponents from all over the world. But that’s not the only technological tool used in the game of chess. GIS tools can be used to analyze and visualize data related to chess, such as player locations, game patterns, and tournament distribution. GIS can be used to map the geographic locations associated with different chess openings, showing where specific opening strategies are popular. GIS can map the locations of chess players, revealing concentrations of chess skill or activity in certain areas. GIS can be used to analyze the spatial distribution of moves in chess games, potentially revealing patterns related to player skill or strategies. GIS can map the locations of chess tournaments, helping to understand the geographical reach and participation in chess events. So, you can either use GIS to advance your chess-playing proficiency or try your hand the old-fashioned way.
Brock Adam McCarty
Map Wizard
(720) 470-7988
brock@apollomapping.com
In this monthly feature, we span the globe to examine Our Changing Landscape with a time series of medium-resolution PlanetScope satellite imagery. The PlanetScope constellation dates back to 2016 and collects hundreds of millions of square kilometers of four and eight-band 3-meter imagery daily! In August, we headed to Saudia Arabia to see how the NEOM Campus changed from 2016 to present time. For the September edition of this series, we feature images of the Camp House Fire that broke out in northern Minnesota in May 2025.
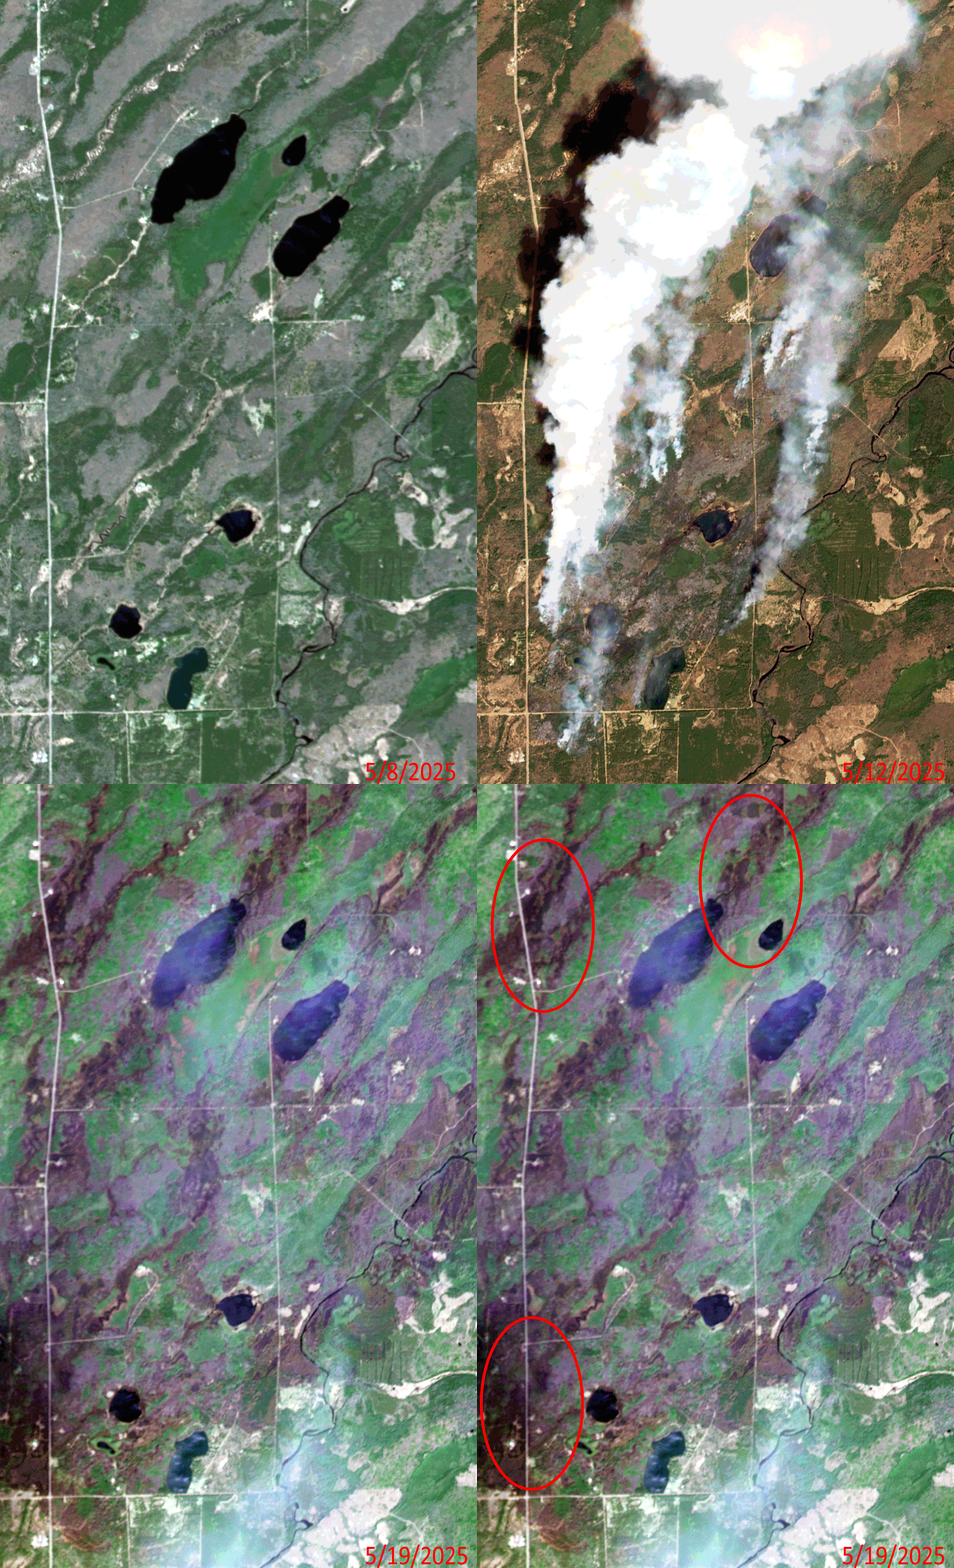 Click on the image above to see an animation of 3-meter natural color PlanetScope image collected over the Camp House Fire in northern Minnesota on May, 8, 12 and 19, 2025. In the May 8th image, you can see lush green agricultural fields here and then in the May 12th image, you can see several active burn sights from the Camp House Fire. By May 19th, the fires here have been put out, but you can see significant fire scars which have been left behind–we circled some of the worst damage in the final slide. (Images Courtesy: © Planet 2025)
The PlanetScope Microsat Constellation
PlanetScope is a constellation of more than 240 microsats referred to individually as Doves. Each Dove is able to collect up to 20,000 square kilometers (sq km) per day of 3-meter (m) 4-band multispectral (i.e. blue, green, red and near-infrared [NIR]) imagery; and newly launched SuperDoves collect 8-band multispectral adding in valuable red-edge spectral data. Across the constellation, PlanetScope is archiving more than 200 million sq km of medium-resolution imagery a day, making it the go to source for daily imagery over most locations. This massive archive dates back to 2016, offering the most complete and continuous record of spatial data on the planet since the start of the constellation’s ongoing launch schedule. Collecting 3-meter multispectral imagery is the equivalent of ‘high-resolution’ multispectral data imaged by a 75-centimer (cm) satellite (as this satellite would feature 75-cm panchromatic and 3-m multispectral), making PlanetScope an extremely competitively priced option at just $2.25 per sq km. With well registered images and nearly daily collections of most locations, PlanetScope is the ideal imagery source for this current-events focused series, Our Changing Landscape.
The 2025 Camp House Fire in Minnesota
Last month, three separate wildfires burned an estimated 37,000 acres in northern Minnesota. The Jenkins Creek Fire northwest of Duluth burned nearly 20,600 acres while the Camp House Fire–the first fire to be reported–torched nearly 15,000 acres. The Three Lakes/Munger Shaw Fire, the smallest of the trio, had spread to 1,700 acres, according to CBS News.
The fires destroyed dozens of structures positioned in their paths. The weather that typically rolls off the nearby lake posed problems for firefighters battling the blazes. Governor Tim Walz activated the Minnesota National Guard and its helicopters to help fight the fire. The fires also prompted the closing of part of the Laurentian Ranger District in Superior National Forest, meaning no visitors could enter campsites, trails and recreation sites. In Saint Louis County, 1,000 homes were evacuated ahead of the wildfires.
By the end of May, the Camp House wildfire was around 90% contained. The Eastern Area Incident Management Team said the fire initially started on private land and moved into the Superior National Forest. St. Louis County Sheriff Gordon Ramsay told Fox 9 it was started by a campfire that was left unattended. He added that the DNR has identified the person who started the fire. The St. Louis County sheriff also said the Jenkins Creek wildfire appears to have been started by a discarded cigarette along Highway 16 as it began near a roadway.
If you would like to find out more about using 3-meter PlanetScope imagery for your academic studies, engineering projects or any landscape analysis, let us know at sales@apollomapping.com or (303) 993-3863.
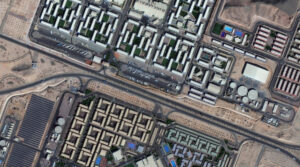 A 30-cm WorldView Legion image courtesy of Maxar collected over the NEOM Campus in Saudia Arabia on December 2, 2024. Apollo Mapping has applied custom color balance and image enhancements.
We are very excited to announce that the final two satellites in the 30-centimeter (cm), 8-band WorldView Legion constellation are live as welcome both Legion 5 and Legion 6 to Image Hunter! With six 30-cm satellites in orbit, this constellation adds an impressive 3.2 million square kilometers of high-resolution satellite imagery to Image Hunter every single day, wow. Further, with industry-leading 8-band multispectral imagery, WorldView Legion is ready to tackle your next geospatial project, even if spectral analysis is the need.
With six active satellites in orbit, the WorldView Legion constellation sets itself apart with these unique specifications:
- A six-satellite constellation with four middle-orbit (MIO) satellites.
- 30-cm panchromatic band plus 1.2-meter (m) 8-band multispectral including coastal, blue, green, yellow, red, red edge 1, red edge 2, and near-infrared (NIR).
- Each satellite in the constellation images over 500,000 sq km per day.
- The WorldView Legion constellation averages 3 accesses per day to locations between 40° North and South latitudes.
- With four MIO satellites, WorldView Legion images throughout the day, not just during the morning as most satellite systems do.
If you would like to find out more about using 30-cm WorldView legion for your next mapping and/or remote sensing project, you can send us an email at anytime to sales@apollomapping.com.
Or you can query the entire 30-cm WorldView Legion archive at anytime on Image Hunter!