
If you are searching for medium and high-resolution satellite imagery, the search is over as Image Hunter is the solution you’ve been looking for! Featuring satellite and aerial imagery as well as digital elevation models (DEMs) from a constantly expanding list of 70+ constellations/datasets and 19 vendors, our database contains more than 500-million images/records meaning there is just no other website out there with this breadth of commercial data products. Our interface is slim-lined and modern, loading quickly on all platforms, browsers and operating systems. Further, our database is updated multiple times an hour with the most recent images collected by WorldView-3, Pléiades 1, PlanetScope, SuperView Neo and many more so you are sure to get the most current view of all the imagery and DEM databases we work with. Once you submit your request, an Apollo Mapping representative will be in touch within 4 Illinois business hours to get you the pricing information you need for your project.

 Our new Clip Polygon To Image tool is live! Give it a try to automatically calculate the coverage areas of a complex set of imagery from various data vendors and satellite constellations.
So why wait? Give Image Hunter a try now to find the imagery and/or DEM data you need for your next mapping project!
Key Improvement(s) From The Past Month
In the past month we added in three new SuperView Neo satellites to Image Hunter! The new additions included a 50-centimeter (cm) 8-band SuperView Neo-3 satellite and then two 25-cm 4-band SuperView Neo-1 satellites, which would be our first sub-30-cm imagery collected from space. With these three new satellites, the SuperView Neo constellation amasses 5.8 million square kilometers of high-resolution imagery each and every day, wow! We are also busy working on a new feature for our Clip Polygon To Image tool which we hope will be ready next month, stay tuned.
Here is a summary of the changes/improvements we made to Image Hunter during the past month:
- Added 25-cm 4-band SuperView Neo-1 03/04 and 50-cm 8-band SuperView Neo-3 02.
- Simplified the Data Alert modal and added an easier way to create a Data Alert in the search results.
- Improved the area calculation accuracy of the Clip Polygon To Image tool.
Data Alert – An Automated Daily Imagery Search
Have you checked out Data Alert which lets you define an area of interest anywhere around the globe, the resolution your project requires and the number of months we should keep the alert active? Once an alert is set up, we check for new data over your area of interest every single day, and send you an email when we find coverage that meets your specifications. We have a short YouTube video with directions to set up a Data Alert, check out the last video; and we have written directions for Data Alert here.
The Sensors Available in Image Hunter
As you might have seen in past articles, we now feature hourly updates (seriously!) of GeoEye-1, KOMPSAT 3/3A, Pléiades 1 and Neo, SPOT 6/7, SuperView-1/2/Neo, WorldView-1/2/3/Legion!
Image Hunter can be accessed 24 hours a day, 7 days a week and is a one-stop shop for every major source of medium and high-resolution satellite (and aerial!) imagery on the market today, including:
- WorldView Legion
- WorldView-4
- WorldView-3
- WorldView-2
- WorldView-1
- QuickBird
- GeoEye-1
- IKONOS
- EROS B
- KOMPSAT-3A
- KOMPSAT-3
- KOMPSAT-2
- Pléiades 1 constellation
- Pléiades Neo constellation
- TerraSAR-X (TerraSAR-X, TanDEM-X and PAZ)
- GEOSAT-1
- GEOSAT-2
- TripleSat
- BJ3A
- BJ3N
- SPOT 1 to 7 constellation
- RapidEye
- GaoFen-2
- GaoFen-1
- ZiYuan-3 01/02 (mono and stereo!)
- FORMOSAT-5
- FORMOSAT-2
- ALOS PRISM (stereo)
- AW3D Standard (DEM)
- SkySat constellation
- PlanetScope constellation (including 5-band SuperDove data)
- SuperView-1 constellation
- SuperView-2
- SuperView Neo-1 01/02/03/04
- SuperView Neo-3 01/02
- Landsat 1-8
- TeLEOS-1
- DS-EO
- Hexagon (HxGN Content Program aerial imagery) imagery + DEM
- WorldDEM
- WorldDEM Neo
- Vricon DEMs
- Orbita Hyperspectral Satellite (OHS)
- KazEOSat-1
- KazEOSat-2
- Jilin-1 Optical
- Jilin-1 Video (including nighttime imagery)
- Jilin-1 GF/DP
- Jillin-1 KF
- Orbita Video Satellites-1/2/3 (OVS-1/2/3)
- BlackSky Global series
Key Features of Image Hunter
If any of our readers have struggled with other geospatial search engines that are clunky, only query one data source and/or do not provide image previews, then Image Hunter is the solution to your woes as it features:
- Online browsing of satellite and aerial imagery from 19 data providers and 70+ satellite and aerial imagery derived datasets.
- Near-instantaneous loading of low-resolution preview imagery with collection date, cloud cover and other key metadata.
- The ability to define your area of interest by address, coordinates, geometric shape or shapefile/KMZ.
- A responsive basemap with street names to provide spatial context when discovering data as well as crowd-sourced updates for the most accurate map possible.
- Exports of the area of interest you create as well as the scenes you select in shapefile or KMZ format.
- Support for all operating systems, and not just our friends with Windows machines!
Image Hunter can be accessed here all day and night, we are excited to find out what you think about our imagery search engine! So if you have any ideas and/or feedback to improve Image Hunter, please let us know at sales@apollomapping.com or (303) 993-3863.
 This map shows the areas imaged by the WorldView-2/3 constellation from July 1 to September 30, 2025 over South America. Please note that in many instances, multiple images were collected over the same area which is difficult to portray on this static map.
In this monthly piece, we give our readers a sense of the high-resolution imagery coverage collected over a geography during a specified window. To do this, we pick a high-resolution satellite constellation, a defined time period and area of interest, then report key statistics on the total amount of imagery collected in square kilometers (sq km). Without further delay, let’s jump into our analysis.
Graphic Region of Interest: South America plus off-shore islands
Land Mass Covered: 17,750,994.2 sq km
Time Period: July 1 to September 30, 2025
High-Resolution Satellite Constellation: WorldView-2/3
WorldView-2/3 Constellation Imaging Statistics – South America
Total Area Collected: 9,634,167.4 sq km; 52,359.6 sq km per satellite/per day
Area Collected @ 20% or Less Clouds & 30 Degrees or Less Off-Nadir: 3,331,940.2 sq km; 18,108.4 sq km per satellite/per day; 34.58% of total
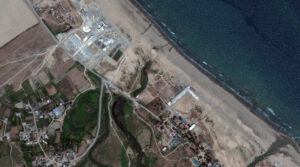 Stranded on the western shoreline of the Caspian Sea for more than a year, the “sea monster” – also known as a “Lun-class Ekranoplan” – doesn’t look like it could actually take flight. It weighs 320 tons but was abandoned after the 1990s collapse of the Soviet Union at Kaspiysk naval base, approximately 60 miles up the cost from Derbent. Decades ago, the Lun actually took flight. An ekranoplan, also known as a ground effect vehicle, is a hybrid of an airplane and ship. It glides over the water without actually going in it. The International Maritime Organization classifies them as ships, but they derive their high-speed capabilities from the fact that they skim the surface of the water at a height of between three to 16 feet, utilizing an aerodynamic principle called ground effect. Flying so low right over the water made them difficult to detect by radar, which is why the Soviet military experimented with different versions of the machine during the Cold War. As they were deployed on the inland body of water between the Soviet Union and Iran, they ended with their nickname, the Caspian Sea Monster. But after lying dormant along the coast of the Caspian Sea for more than three decades, in July 2020, the sea monster was dragged 14 hours by three tug boats and two escort vessels slowly along the seashore to its final destination – a stretch of coast near Russia’s southernmost point that’s part of Patriot Park, a theme park in Kubinka, that is themed around equipment of the Russian military and the Soviet Union’s victory in World War II. The park, which officially opened in 2016, features interactive exhibits with military equipment (including a mini-Reichstag to storm). In the image above, we can see the sea monster parked in a special spot at Patriot Park, its final resting place. The 30-cm WorldView Legion image was collected on July 18, 2025, and has custom processing and color balance applied by Apollo Mapping. (Satellite Imagery © 2026 Vantor)
In this monthly article, we travel the world to check out unique, fun and sometimes a bit weird 30-centimeter (cm) color imagery samples from the WorldView constellation. In March, we looked at the 21st Century Museum of Contemporary Art in Kanazawa, Ishikawa, Japan. For this edition of the 30-cm Color WorldView Image of the Month, we feature an image of the Caspian sea monster, officially known as a Lun-class Ekranoplan.
30-cm WorldView-3 (WV3) launched in late 2014, WorldView-4 (WV4) launched in late 2016 and then the first WorldView Legion satellites launched in 2024. Taken together, this is the most advanced satellite constellation the commercial marketplace has ever had access to. Here are a few of the features that really set these satellites apart from the competition:
- Improved Resolution
- Higher resolution means you can see more detail in WorldView imagery.
- Data collected at nadir will have 31-centimeter (cm) panchromatic, 1.24-meter (m) visible and near infrared, 3.7-m SWIR (WV3 only) and 30-m CAVIS (WV3 only) bands.
- Additional Spectral Bands
- If spectral analysis is part of your project, then no other satellite can match WorldView-3 and WorldView Legion with their 8 bands of visible and near-infrared data; and then 8 shortwave infrared bands (WV3 only) which are crucial for geological studies.
- Better Positional Accuracy
- With accuracies of 3.5-m CE90% or better (without ground control even!), the 30-cm WorldView constellation has no rivals for its enhanced positional accuracy.
- Daily Revisits
- With multiple WorldView-3 and WorldView Legion satellites orbiting our planet, daily revisits are available for most locations.
- WV4 is no longer collecting new imagery.
- Increased Collection Capacity
- WV3/4 feature 13.1-km swath widths (at nadir) with the ability to collect up to 680,000 square kilometers (sq km) of high-resolution data per day per satellite (though WV4 is dead now).
- WorldView Legion features six 30-cm satellites, significantly boosting the collection capacity of this leading high-resolution constellation.
If you are interested in WorldView-3, WorldView-4 and/or WorldView Legion imagery for your next project, please let us know by phone, 303-993-3863, or by email, sales@apollomapping.com.
You can also find more WV3 samples and technical information on our website here; WV4 samples and information can be found here; and then finally here is more information about WorldView Legion.
We love maps.
We love imagery.
We love work breaks.
We hope you like them as well!
In 1885, 29-year-old Eliza Ruhamah Scidmore returned to the United States following her first visit to Japan, where her brother George worked for the U.S. Consular Service. While there, she developed a great appreciation for Japanese culture, and the beauty of the Japanese flowering cherry trees. She brought back with her a desire to introduce the beauty of Japanese cherry blossoms to Americans. She unsuccessfully petitioned superintendents of the Tidal Basin to plant cherry blossoms there for 24 years.
U.S. Department of Agriculture Plant Explorer David Fairchild began experimenting with and advocating for the introduction of Japanese flowering cherry trees in the United States. Following the successful planting of several varieties on his personal property in Chevy Chase, Maryland, and in the neighboring area, he began promoting the idea of planting Japanese flowering cherry trees along avenues in the nation’s capital. His efforts included supplying cherry trees to children to plant in Washington, D.C. schoolyards on Arbor Day in 1908.
On the day before the big event, Scidmore spoke with Fairchild about her dream of planting Japanese cherry trees on the newly reclaimed land of Potomac Park. Both Scidmore and Fairchild began working on plans to acquire trees for the park. At the White House, First Lady Helen Taft was working on plans to beautify this area. Fairchild offered to import Japanese cherry trees for the project. Taft also had fallen in love with the cherry blossoms when she visited Japan.
At the time, Japanese chemist Dr. Jokichi Takamine learned of the plan to acquire cherry trees for America’s capital city. He was in Washington, D.C. at the time with New York’s Japanese consul general Kokichi Mizuno. Takamine offered a gift of 2,000 trees for the city to Taft to be donated in Tokyo’s honor. Sadly, the first shipment in 1910 included trees that were infested with insects and had to be burned. A second shipment of 3,020 trees from 12 varieties were shipped to the U.S. in 1912.
Fewer than 100 of these original trees survive today among the nearly 4,000 cherry trees growing in West and East Potomac Parks, on the Washington Monument grounds, and in several other park locations.
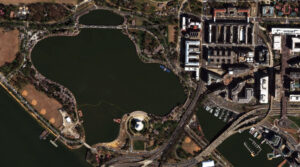
For this month’s Imagery Work Break, we feature a WorldView-3 30-cm color enhanced photo from March 27, 2025. It was taken over the Tidal Basin in Washington, D.C., which is peak season for cheery blossoms. The Cherry blossoms captured here look almost white in the image with a few pinks popping through.
Have a great rest of your workday! 😊
(Image Courtesy: Vantor. Processed by Apollo Mapping for improved color accuracy and clarity.)
In the early 2000s, I showed teachers Google Earth – recently renamed from Keyhole – and we explored real aerial images using its basic tools. Like most novices, they zoomed into home and other places that were familiar. One in particular started waving excitedly. As I approached her, she began waving at the screen saying, “Hey grandma! Here I am!” I reminded her that we hadn’t quite reached that level of live interaction. It’s funny now, but thanks to satellites equipped with stellar cameras, we can access regular imagery updates of the planet. If we knew when grandma was working in the yard, we might be able to see her. This idea of being seen sent me down a different path. In a culture of Instagram worthy versions of life, who is the real you. Do the pictures paint an accurate view like something from a satellite, or in spite of the digital presence, are we feeling invisible?
We might start feeling invisible sometime during our school years based on popularity. We work hard to find our place in the world through careers and volunteer passions. As we make life choices, silos of belonging begin to form. Do you have children? Did you choose a well-acknowledged career? Do you have a life partner? Where are you from? Are you retiring? These questions lead to some bias whether you answer, “Yes” or “No.” Your brain might begin to spin up more questions. Why did they ask that question? Do I look or sound like I need to retire? Even with a satisfying career and home life, many still struggle to find their voice and visibility. Dr. Allison Cook recommends a healthy dose of curiosity and awareness to turn around invisibility in relationships. Some reasons for these feelings that Debra Smouse shares on her website resonated with my personal experiences:
 Canva creation by B. Duke.
- You learned at an early age to be physically present, but not call attention to yourself
- You fail to honor your feelings and ignore your intuition
- You’re sacrificing your visibility in the hopes of making other people happier
- You’re so good at your role in the family that you’ve become invisible to them
- You’ve kind of checked out of your own life
- You don’t matter in your social circles
- You need to work on your self-confidence
You can turn it around! Macy Baxi, a Cherry Creek High School student, shared a TED talk with some lovely insights that can work for any age. When thinking through, “How do you get there?”, she shares some simple but valuable nuggets to transform your communication skills, a key element to improving visibility:
- See yourself clearly first
- Recognize your worth and capabilities along with growth areas
- Listen and engage actively to steer the conversation
- Have focused goals
- Learn to reflect and value input from any conversation
If you’re serving in leadership, you can have a tremendously positive impact on those in your care. Leaders can help others evolve and feel impactful…seen. Jamie Kern Lima has some encouraging tips that help you see yourself and others more effectively:
- Give an honest compliment
- Notice and acknowledge someone
- Express appreciation
Even the most introverted folks can wrap their heads around these simple approaches. Wouldn’t we all like to feel appreciated? Don’t you stand a little taller with a kind, honest compliment from even a stranger? Knowing that someone sees and acknowledges your hard work, and time spent goes a long way to improving your invisibility lens.
It’s early in the year, so let’s all endeavor to help each other be seen and heard. Spread around a few more compliments and express your appreciation far and wide! We need each other.
Barbaree Duke
Geospatial Crusader
In this monthly feature, we span the globe to examine Our Changing Landscape with a time series of medium-resolution PlanetScope satellite imagery. The PlanetScope constellation dates back to 2016 and collects hundreds of millions of square kilometers of four and eight-band 3-meter imagery daily! In February, we visited Kalamurina Wildlife Sanctuary in the Outback of Australia. For the March edition of this series, we check out the development of the High Roller Sand Mine in Texas of the United States.
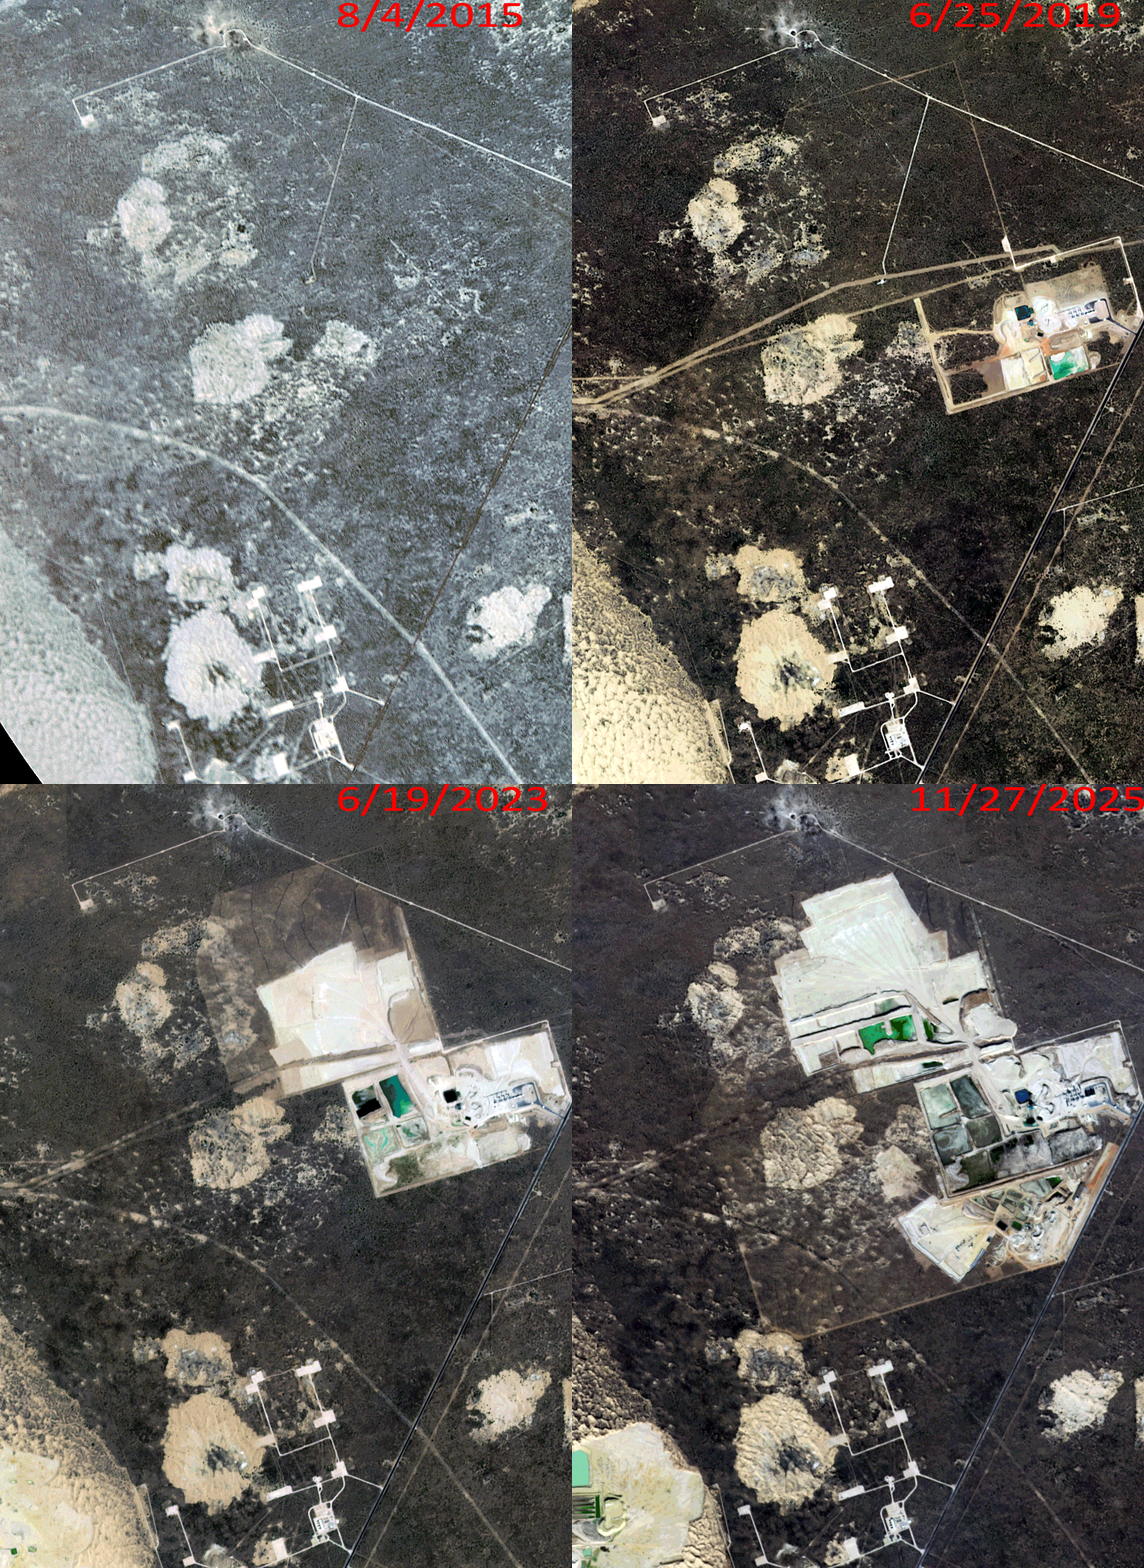
Click on the image above to see an animation of 3-meter natural color PlanetScope imagery collected over High Roller Sand Mine in Texas on August 4, 2015, June 25, 2019, June 19, 2023, and November 27, 2025. In this animation, you can see that the area is quite remote in the 2015 data with just a few well pads present. Over the years, the High Roller Sand Mine is established and grows rapidly as does a nearby mine site to the southwest. And it seems the sand mine is set to expand its footprint in 2026 as there is construction on a new extension to the mine on its southwest edge. (Images Courtesy: © Planet 2026)
The PlanetScope Microsat Constellation
PlanetScope is a constellation of more than 240 microsats referred to individually as Doves. Each Dove is able to collect up to 20,000 square kilometers (sq km) per day of 3-meter (m) 4-band multispectral (i.e. blue, green, red and near-infrared [NIR]) imagery; and newly launched SuperDoves collect 8-band multispectral adding in valuable red-edge spectral data. Across the constellation, PlanetScope is archiving more than 200 million sq km of medium-resolution imagery a day, making it the go to source for daily imagery over most locations. This massive archive dates back to 2016, offering the most complete and continuous record of spatial data on the planet since the start of the constellation’s ongoing launch schedule. Collecting 3-meter multispectral imagery is the equivalent of ‘high-resolution’ multispectral data imaged by a 75-centimer (cm) satellite (as this satellite would feature 75-cm panchromatic and 3-m multispectral), making PlanetScope an extremely competitively priced option at just $2.25 per sq km. With well registered images and nearly daily collections of most locations, PlanetScope is the ideal imagery source for this current-events focused series, Our Changing Landscape.
High Roller Sand Mine in Texas
High Roller Sand Mine is a state-of-the-art hydraulic fracturing sand facility in Kermit, Texas, which is located in the heart of the Delaware Basin. Iron Oak Energy bought High Roller Sand in April 2025 from the Higher Roller Group, describing its location as one of the highest-quality sand reserve deposits in the Permian Basin.
The Permian Basin accounts for more than half of the total proppant demand in the U.S. and continues to increase. The High Roller Sand facility produces up to four million tons of proppant annually for oil and gas operators throughout the region, specifically high-quality 40/70 and 100 Mesh natural sand proppants for oil and gas fracking.
The High Roller Sand Mine in Texas was strategically located near Kermit, Texas, in the Permian Basin, specifically around County Road 308, to serve oil and gas drilling operations sprawled across the Northern Delaware and Midland Basins.
Interestingly, when it was first established, the High Roller Sand Mine received the Texas Conservation Plan (TCP) Certificate of Inclusion. They were one of the only producers approved in the northern sections of the deposit and plan to continue to operate under a sand dunes sagebrush lizard (DSL) Conservation and Habitat Improvement Plan.
If you would like to find out more about using 3-meter PlanetScope imagery for your academic studies, engineering projects or any landscape analysis, let us know at sales@apollomapping.com or (303) 993-3863.
- If you are a nerd like I am, then this should be your favorite part of our newsletter as here is a list of the coolest technology advancements we have seen in the past month:
Evolution is a not a linear process.
A natural sunscreen discovered in hot springs.
Bamboo shoots are a new possible superfood.
Did a deadly poison help spark life in a frozen, barren landscape?
A new soybean variety could improve modern dairy farming.
A new way to investigate hurricane winds.
Fungi could replace non-renewable building materials in the near future.
New research on why some folks over 80 are as sharp as ever.
Scientists film a state of matter between liquid and solid.
Rocks found on Mars suggest a tropical climate exists in the past.
The hidden connection between exercise and bone health.
New electrode converts CO2 to usable products even at atmospheric concentrations.
A possible breakthrough in cancer research.
Electrons proven to be influenced the geometry of space-time.
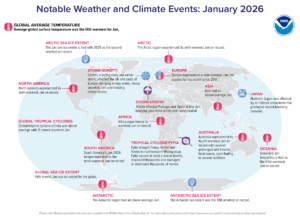
Australia endured its fourth warmest January on record and subsequently experienced several wildfires. Tropical Cyclone Fytia dumped heavy rainfall and flooding in northwestern Madagascar, causing at least a dozen deaths, damaging thousands of homes and displacing thousands. The Arctic Sea ice extent is tied with 2025 as the second smallest on record while the Antarctic Sea extent was the 13th smallest on record. (Image Credit: NOAA Global Climate Report)
- The Global Climate Change Report for January 2026 has been released by NOAA’s National Centers for Environmental Information and reveals further proof that global climate change remains a concern. The January 2026 global temperature was 1.12°C (2.02°F) above the 20th Century average, ranking as the fifth warmest January since global recordkeeping began in 1850. Drier-than-average conditions characterized January 2026 across much of the contiguous U.S. and elsewhere around the world. In contrast, wetter-than-average conditions were observed across south-central U.S. extending northeastward, and elsewhere around the globe.
- March means spring break has arrived and for lots of families, that equates to a fun trip somewhere. It could be a tropical location with scuba diving and poolside drinks, or Walt Disney World with its abundance of rides and attractions. The Mall of America in Minnesota happens to be a fun destination with its aquarium on the lower level, the amusement park in the center, and mini golf plus a mirror maze – not to mention all of the stores to shop in. So how do you decide where to go? Well, GIS can come in handy for choosing your vacation, along with mapping out where to go and what to do while you’re there. ArcGIS mapping apps, such as the “50 of the Best Spring Break Destinations in the U.S.”, allow users to visualize these locations geographically to help plan routes and find nearby attractions. People also could use Google My Maps or ArcGIS to create layers for potential destinations, organizing them by day or interest (e.g., beaches, cities, nature). Doug Rosenberg, VResorts.com founder, said the VResorts.com mapplet uses GIS to find the hotel you want, in the location you want, and with the amenities you want. Web visitors can quickly identify hotel options in a given neighborhood and drill down into individual hotel brochures, which include traveler reviews of the property. Once they have made a decision, they can book the hotel online.
Brock Adam McCarty
Map Wizard
(720) 470-7988
brock@apollomapping.com
 This map shows the areas imaged by the Pléiades 1 constellation from July 1 to September 30, 2025 over South America. Please note that in many instances, multiple images were collected over the same area which is difficult to portray on this static map.
In this monthly piece, we give our readers a sense of the high-resolution imagery coverage collected over a geography during a specified window. To do this, we pick a high-resolution satellite constellation, a defined time period and area of interest, then report key statistics on the total amount of imagery collected in square kilometers (sq km). Without further delay, let’s jump into our analysis.
Graphic Region of Interest: South America plus off-shore islands
Land Mass Covered: 17,750,994.2 sq km
Time Period: July 1 to September 30, 2025
High-Resolution Satellite Constellation: Pléiades 1A + 1B
Pléiades 1 Constellation Imaging Statistics – South America
Total Area Collected: 5,213,555.4 sq km; 28,334.5 sq km per satellite/per day
Area Collected @ 20% or Less Clouds & 30 Degrees or Less Off-Nadir: 2,435,068.4 sq km; 13,234.1 sq km per satellite/per day; 46.71% of total