
¡Bienvenidos a mayo! Nosotros en Apollo Mapping estamos gustosos de tenerlos otro mes aquí en los resúmenes españoles del mes de mayo.
PRODUCTO DESTACADO – Datos WorldView de 8 bandas + PlanetScope
 ¿Te imaginas trabajar con esta colorida imagen WorldView-2 de 50 cm con 8 bandas? Eso es el doble de información espectral al mismo bajo costo. Esta imagen Maxar WorldView-2 de 50 cm fue capturada sobre Central City, Pensilvania el 1 de octubre de 2012.
¿Sabías que, dados los recientes cambios de precios para imágenes satelitales de alta resolución de 8 bandas de WorldView-2, WorldView-3 y WorldView Legion, puedes ordenar esta información espectral adicional al mismo precio que los datos de 4 bandas? ¡Sí, lo escuchaste bien, así que ¿por qué no mejorar tu análisis espectral sin costo adicional?!
Y además, quizás no sepas que la mayoría de las imágenes PlanetScope de 3 metros pueden entregarse con 4 bandas u 8 bandas al mismo costo también.
Entonces, cuando llegue el momento de comenzar un proyecto que incluya detección de cambios, clasificación de uso y cobertura del suelo, análisis de vegetación y/o cualquier otro análisis espectral, ¿por qué no usar datos de WorldView u PlanetScope de 8 bandas al mismo costo?!
Envíanos un correo electrónico en cualquier momento para mejorar tu análisis espectral sin costo adicional utilizando imágenes satelitales de 8 bandas en tu próximo proyecto geoespacial.
Producto Destacado – WorldDEM Neo DSM + DTM de 5 metros
 Echa un vistazo a una muestra de datos DSM de WorldDEM Neo de 5 metros de Phu Hoi, Vietnam.
Si tu próximo proyecto de mapeo requiere cobertura de grandes áreas con un modelo digital de elevación (DEM) sin interrupciones, ¡es momento de conocer el actualizado producto WorldDEM de Airbus, con nuevos precios y mayor precisión! WorldDEM Neo tiene una resolución mejorada de 5 m y se deriva de pares estéreo de radar TerraSAR-X y TanDEM-X. Sin embargo, los pares de radar utilizados para crear este conjunto de datos de elevación de 5 m son más recientes que su predecesor, ya que fueron recopilados de 2017 a 2021. WorldDEM Neo está disponible tanto como modelo de superficie digital (DSM) como modelo de terreno digital (DTM), con una impresionante precisión vertical absoluta de < 1.4 m de Error Lineal al 90% (LE90).
El WorldDEM Neo DTM de 5 metros está disponible como producto de Nivel 1 o Nivel 2. El producto de Nivel 1 es un DTM automatizado que elimina las estructuras superficiales del WorldDEM Neo DSM. El producto de Nivel 2 incluye procesamiento manual que resulta en un DTM de mayor calidad. Esto incluye la eliminación de estructuras superficiales del WorldDEM Neo DSM, como áreas urbanizadas y vegetación alta. También incorpora el refinamiento de los límites de cobertura del suelo antes de reducir la elevación al nivel del terreno, así como la preservación de crestas y cañones con el modelado preciso de estructuras de transporte como puentes, autopistas y terraplenes; y el detalle de las extensiones de elementos hidrográficos como cuerpos de agua, embalses, ríos y la alineación respectiva de las alturas de la superficie del agua.
Puedes buscar WorldDEM Neo ahora en Cazador de Imágenes y luego descargar una muestra de datos DSM, DTM de Nivel 1 y Nivel 2 desde la misma ubicación aquí.
Para obtener la lista de precios actualizada de DEM, que incluye datos DSM y DTM de WorldDEM Neo de 5 m, envía un correo electrónico a sales@apollomapping.com.
Mientras tanto, consulta estas especificaciones clave para el WorldDEM Neo de 5 m:
Resolución: Espaciado de píxeles de 5 metros
Precisión Vertical Absoluta: < 1.4 m de Error Lineal al 90% (LE90)
Precisión Horizontal Absoluta: < 6 metros (error circular al 90%)
Cobertura Geográfica: Casi de polo a polo, igual que el WorldDEM de 12 m (ahora este)
La Vista a Vuelo de Pájaro – Chicago, IL
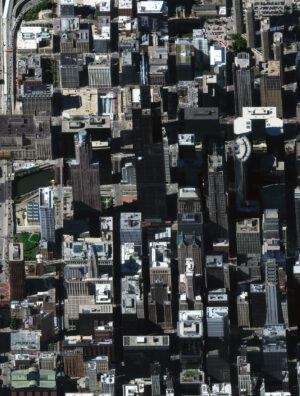 En nuestras primeras imágenes presentadas en esta nueva serie mensual, tenemos dos imágenes satelitales a vuelo de pájaro capturadas por WorldView-3 sobre Chicago, IL, EE. UU. el 8 de octubre de 2017. En estas imágenes satelitales de aproximadamente 52 centímetros, puedes ver el Navy Pier de Chicago y su rascacielos más alto, la Torre Willis. ¡Esperamos que disfrutes estas muestras de imágenes satelitales de alto ángulo fuera de nadir! (Imágenes Satelitales © 2026 Vantor)
¡Bienvenido a nuestra nueva sección mensual, La Vista a Vuelo de Pájaro! Cada mes, presentaremos una nueva imagen satelital a vuelo de pájaro desde un lugar selecto alrededor del mundo; y este mes, nos dirigimos al hogar del rascacielos, Chicago, Illinois, EE. UU.
¿Qué es la Imagen Satelital a Vuelo de Pájaro?
¡Buena pregunta, y con gusto la respondemos! Cuando un satélite capta imágenes del suelo debajo de él, siempre hay una cierta inclinación en la cámara al mirar hacia abajo. Esta inclinación se denomina fuera de nadir y se mide en grados desde 0; por lo tanto, 0° fuera de nadir significa que el satélite apunta directamente hacia el suelo al capturar imágenes, mientras que 90° fuera de nadir significaría que el satélite apunta hacia un lado y ni siquiera al suelo debajo de él al capturar imágenes. La gran mayoría de las imágenes satelitales se recopilan con un ángulo fuera de nadir inferior a 30°. Sin embargo, en ocasiones raras, ya sea por solicitud de un cliente o para capturar un desastre natural u otro evento importante, un satélite puede inclinarse e imágenes en el rango de 35° a 50°, lo que consideramos ideal para imágenes de alto ángulo fuera de nadir, también llamadas imágenes a vuelo de pájaro. Estas imágenes a vuelo de pájaro ofrecen una perspectiva única de las imágenes satelitales, con una vista amplia del paisaje desde el lado. Esperamos que disfrutes las imágenes satelitales a vuelo de pájaro que compartimos en este artículo. Y si tienes alguna pregunta sobre este tipo de datos o cualquiera de los productos de imágenes con los que podemos ayudarte, ¡envíanos un correo electrónico en cualquier momento a sales@apollomapping.com!
Fernando Gutierrez
Topographic Translator
If your next mapping project requires large-area coverage of a seamless digital elevation model (DEM), then it is time to check out Airbus’ updated WorldDEM product, boasting new pricing and improved accuracy! WorldDEM Neo has improved 5-m resolution and is derived from TerraSAR-X and TanDEM-X radar stereo pairs. However, the radar pairs used to create this 5-m elevation dataset are more recent than its predecessor as they were collected from 2017 to 2021. WorldDEM Neo is available as both a digital surface model (DSM) and a digital terrain model (DTM) with an impressive absolute vertical accuracy of < 1.4 m Linear Error 90% (LE90)!
Check out a sample of WorldDEM Neo 5-meter DSM data from Phu Hoi, Vietnam.The 5-meter WorldDEM Neo DTM is available as a Level 1 or Level 2 product. The Level 1 product is an automated DTM and removes surface structures from the WorldDEM Neo DSM. The Level 2 product features manual processing resulting in a higher-quality DTM. This includes the removal of surface structures from the WorldDEM Neo DSM such as built-up areas and tall vegetation. It also incorporates the refinement of land cover borders before reducing the elevation to the terrain level and extending the preservation of ridge lines and canyons with the precise modelling of transport structure like bridges, motorways, embankments; and then detailing the extents of hydrographic features like water bodies, reservoirs, rivers, and respective alignment of water surface heights.
You can search for WorldDEM Neo now on Image Hunter; and then download a sample of DSM, Level 1 and Level 2 DTM data from the same location here.
To get updated DEM price list which includes 5-m WorldDEM Neo DSM and DTM data, send an email to sales@apollomapping.com.
In the meantime, check out these key specifications for 5-m WorldDEM Neo:
- Resolution: 5-meter pixel spacing
- Absolute Vertical Accuracy: < 1.4 m Linear Error 90% (LE90)
- Absolute Horizontal Accuracy: < 6-meter (90% circular error)
- Geographic Coverage: nearly pole to pole, same as 12-m WorldDEM
Spring in my town means it’s time to look at the sky on an early morning in May for balloons. The annual Hot Air Balloon Festival comes to town with almost 50 balloons and a fun festival atmosphere for the weekend. Many years ago, I had the opportunity to ride in a hot air balloon. It’s an amazing experience! For just a moment, you’re transported back in time to a 19th Century version of “The Amazing Race” with Phileas Fogg and Passepartout floating over the countryside. Did you know that aerial photography is the earliest form of remote sensing? The French photographer and balloonist Gaspard-Félix Tournachon, known as “Nadar”, snapped the first aerial image in 1858 over Paris, France. Viewing the Earth’s surface from above, he wrote, “reduces all things to their relative proportions – to the Truth.” He pioneered artificial lighting in photography while working in the Paris catacombs, becoming the first to photograph both from balloons and underground. While the first aerial photo of Paris is lost, he sparked a zeal to see the world from above. The oldest surviving aerial photo is from the 1860’s of Boston taken in a balloon at 2,000 feet.
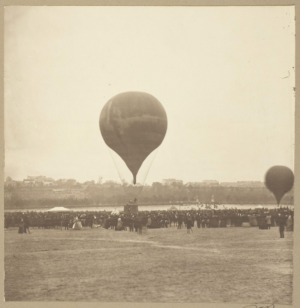 Nadar’s Balloon that took the first aerial photograph, “Le Geant, Champ de Mars, October 18, 1863”, probably printed 1880/89. (CC0 Public Domain Designation)
Remote sensing matured through aerial reconnaissance in World Wars, ultimately evolving into satellite-based earth observation in the 1960s. Other milestones include the 1972 launch of Landsat and the adoption of digital imaging, allowing for modern environmental monitoring and mapping. Can you imagine how magical your iPhone would be to Nadar if he saw us casually pulling up our route or zooming to a coffee shop on our handheld maps today?
That magical imagery has led to several discoveries. Remote sensing has revolutionized Earth observation, enabling discoveries like rapid glacier shrinkage in Patagonia, 90% volume loss in Walker Lake, and the detection of hidden archaeological structures using LiDAR, such as under the Cambodian jungle. Three discoveries in particular used remote sensing and other geospatial technologies to solve some world mysteries: the burial site of Genghis Khan, Amelia Earhart’s crash site, and newly revealed Mayan settlements.
Genghis Khan, a brilliant warrior and ruler, unified Mongolia’s nomadic tribes into a disciplined military state led by his family. He launched campaigns that extended the Mongol Empire from China’s Pacific coast to the Adriatic Sea. Dr. Albert Lin became interested in his personal heritage that led to his work using geospatial technologies to find the long hidden and mysterious burial place of the famous ruler, Genghis Khan. How do you decide where to start looking for something ancient? Crowdsourcing, or human computation, was part of the journey. I was fortunate to see Dr. Lin tell his story at Bishop Dunne high school in Dallas, TX as part of their 2013 GeoTech Conference. To find the ancient site without disturbing any land, people scanned imagery for something that “looks weird there.” The “weird” places led him to a moment where he’s walking on an ancient roof, completely swallowed by the landscape.
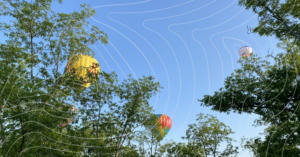 Balloons flying over my home. (By Barbaree Duke, 2024)
Dr. Lin isn’t the only person leveraging geospatial technology to solve an old mystery. What happened to Amelia Earhart? In 1928, she became the first female passenger to cross the Atlantic by plane. In 1932, she was the first woman to fly solo nonstop across the Atlantic and received the Distinguished Flying Cross. She promoted commercial aviation, authored best-selling books, and helped establish the Ninety-Nines, a group for women pilots. On July 2, 1937, she vanished over the Pacific Ocean while attempting a global flight as the first female pilot. According to an article in Popular Mechanics, Justin Myers, a pilot, used Google Earth and curiosity to solve part of the mystery. He’s not the only one to believe that she might have crash landed and survived on a small island.
Zoom from the Pacific Ocean over to Mexico. Tulane University doctoral student Luke Auld-Thomas has been part of another notable discovery. He realized that rather than hacking his way through the jungles, he needed Lidar imagery to make accurate measurements. Instead of costly new images, he sought out old and freely available imagery to complete his research. What he found in the process was a new Mayan city, Valeriana.
A new city, a modern mystery, and ancient history…all found with a photograph. It takes our human perspectives to research and interpret the mystery. We’re uniquely equipped to analyze patterns, especially if you’ve spent any time working with geospatial technologies. The proof we needed was quite literally in the pictures! If you need me, I’ll be volunteering at the balloon festival!
Barbaree Duke
Geospatial Crusader
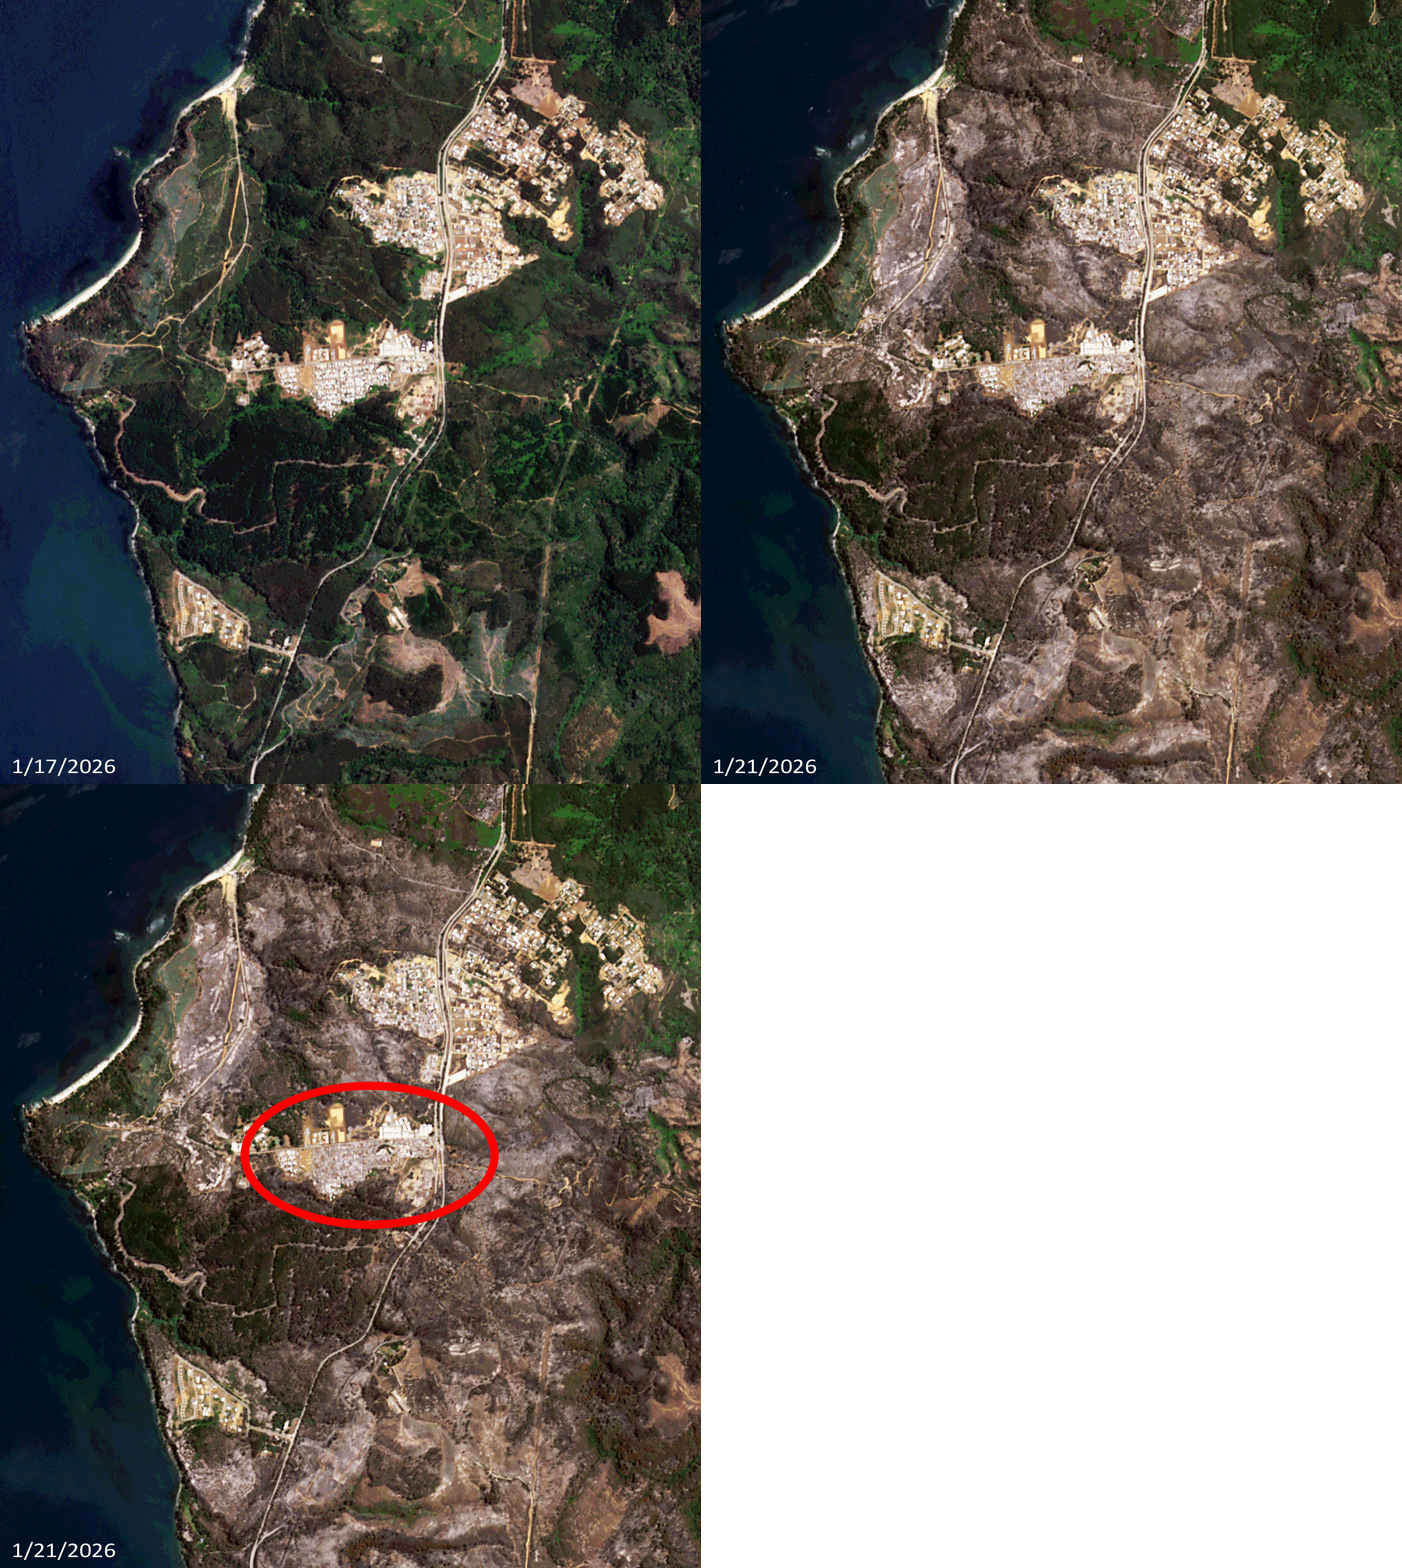 Click on the image above to see an animation of 3-meter natural color PlanetScope image collected over Tome and Lirquen, Chile on January 17 and 21, 2026. In this animation, you can see how much vegetation was burnt during this large fire as there are very few pockets of greenery left in the January 21st image. In the third slide, we have circled one particularly devastated neighborhood known as Punta de Parra where nearly every building looks to have been destroyed. Our hearts go out to these communities as they rebuild from this destruction. (Images Courtesy: © Planet 2026)
In this monthly feature, we span the globe to examine Our Changing Landscape with a time series of medium-resolution PlanetScope satellite imagery. The PlanetScope constellation dates back to 2016 and collects hundreds of millions of square kilometers of four and eight-band 3-meter imagery daily! In April, we checked out Bolivia’s Salar de Uyuni, also known as the salt flats. For the May edition of this series, we are look at a January 2026 wildfire in Chile that destroyed homes and stole lives.
The PlanetScope Microsat Constellation
PlanetScope is a constellation of more than 240 microsats referred to individually as Doves. Each Dove is able to collect up to 20,000 square kilometers (sq km) per day of 3-meter (m) 4-band multispectral (i.e. blue, green, red and near-infrared [NIR]) imagery; and newly launched SuperDoves collect 8-band multispectral adding in valuable red-edge spectral data. Across the constellation, PlanetScope is archiving more than 200 million sq km of medium-resolution imagery a day, making it the go to source for daily imagery over most locations. This massive archive dates back to 2016, offering the most complete and continuous record of spatial data on the planet since the start of the constellation’s ongoing launch schedule. Collecting 3-meter multispectral imagery is the equivalent of ‘high-resolution’ multispectral data imaged by a 75-centimer (cm) satellite (as this satellite would feature 75-cm panchromatic and 3-m multispectral), making PlanetScope an extremely competitively priced option at just $2.25 per sq km. With well registered images and nearly daily collections of most locations, PlanetScope is the ideal imagery source for this current-events focused series, Our Changing Landscape.
Destructive January 2026 Wildfire Along The Coast Of Chile
On January 18th, forest fires broke out in Chile that by the next day had killed an estimated 19 people and forced 50,000 people to flee their homes. Wildfires are common in Chile during the summer due to high temperatures and dry weather. The current outbreak of fires in central and southern Chile is one of the deadliest in recent years.
The wildfire swept across thousands of acres in the center of the country, as well as the southern region. By January 19th, 15 wildfires were still active. Altogether, they destroyed upwards of 325 homes, and damaged another 1,140 homes, according to the National Service for the Prevention of Disasters. The Associated Press reports that Chilean President Gabriel Boric declared a state of catastrophe in central Biobio and neighboring Ñuble regions on January 18th. The emergency designation allowed for coordination with the military to rein in the wildfires. Boric said that the wildfires have blazed through at least 30,000 hectares, an area that is roughly five times the size of Manhattan Island. “Controlling fires of this magnitude, with unfavorable weather conditions like high temperature, wind, and a lack of humidity is a tremendously difficult job,” Boric said in a press conference.
If you would like to find out more about using 3-meter PlanetScope imagery for your academic studies, engineering projects or any landscape analysis, let us know at sales@apollomapping.com or (303) 993-3863.
I have used dating apps off and on for a little over a decade. I never learned how to meet women the correct way – I always did so drunk at a bar and usually after midnight. This worked well until I didn’t like being drunk at bars or up after midnight. It was a bit of a challenge to course correct on this, and the only offramp I could find was dating apps. Being someone who despises social media in all forms, I found these platforms to be the worst of the worst – shopping for love (and/or lust). I also don’t present well in those forums, nor do I make the best pitches. I’ve never been great at the cold approach but give me an introduction (or a few shots of liquid courage) and I can win over even the toughest of audiences. Usually. But dating apps are different. It’s a fishing trip with no guarantee to eat. You have to cast your line hundreds of times to maybe get a few nibbles. Typically, I only get on these things for two weeks at a time – if I don’t get a date (or two), then I decouple (no pun intended) from them for a while (that’s all I can stomach). There’s something about them that just leaves a bad taste in my mouth; I don’t feel good about using them at all. But that’s how people meet these days, unfortunately, so I have no other choice (or so it seems).
 This beautiful skyline screams hope and possibility. (Image retrieved from here and comes courtesy of James Wheeler.)
There are several apps out there I’ve used, Bumble, Hinge, and Feeld being the most common recently. Though, with Bumble, the woman has to make the first move, so you don’t get a fully fair shot in playing your best hand. Feeld is where all the sexual deviants go – fine by me – but that app only gives you a couple of free matches. I’m sure as hell not paying to use these things. So, Hinge has become my primary, as it basically has a frictionless function and you can reach out to whomever you’d like. Whether they respond is a different story.
In tandem with all the non-responses, I find this app also makes me feel a little bad about myself, but not in a “Boo-hoo-hoo, woe is me” kind of way, but that the women who reach out to me make me think I must be a lot uglier than I think I am. I’ll leave it at that; read into it what you will. But I’ve had some success over the years, and by that, I mean women I’ve gone on to date intentionally and with hopes of something that endured. The thing is, there is often some dissonance between what I envision in my mind and the reality of things. I often have to adjust my expectations (even if not consciously), and what comes to be understood as a “normal” relationship shows its true colors only after it’s over. For example, one gal, Kelsey, we dated for about 2-3 months three separate times each over the span of a year. We got along with one another, but there was some friction there, too, and we weren’t in perfect alignment on some (probably) key issues, and that caused us to have an extended feeling-one-another-out phase that ultimately ended in, well, the end of the relationship. At the time, though, I was trying to get myself to believe this was a functional relationship and I should adjust accordingly. That should have been the first red flag…
A quick aside: I went out with a male friend for lunch a few months ago, and I pointed to a man in his late 70s eating lunch by himself. I turned to my friend and said, “I don’t want to end up like him.” He told me I needed to do something about that now then. Do I have unreasonable expectations? Probably. Do I need to make more concessions, be more forgiving, and more open to that which I’ve previously dismissed? Probably. Easier said than done.
My typical approach on dating apps is to swipe left (not interested) in all women who have kids (or want them). It’s not that I have anything against children per se, I just don’t need that extra _____ in my life. A few years ago, a colleague of mine told me I was missing out on a lot of great opportunities, as there are plenty of very attractive, very cool women with kids. I’ve made some exceptions here and there, but mostly I’ve steered clear. That’s been the case for a couple years now.
On my most recent encounter with Hinge, I was at the end of my self-imposed 2-week engagement period, and about to delete the app. Hinge allows you to refresh so you can look at previous profiles you’d passed on, and I figured, “What the hell, why not?” I decided I would eliminate my criteria of passing on women with kids. The first one to pop up after the refresh was a woman with a young daughter (though, she didn’t share much info aside from that – which is a good thing, as women who yap too much about their children, and especially those who include pictures of them, are definitely out of consideration). I noticed a few things interesting about her and worthy of a cute comment, and so I fired off a message and then put the phone down. That was enough for that moment; I was just sick of the app. Then she replied to my message shortly thereafter…
We had an extended, but incremental, exchange through the app for two days, then she gave me her number where we transferred the conversation. We met up a few days later for our first date, one that lasted well over four hours and never saw a break in the discussion. We covered every topic conceivable and even got into the taboo ones as well, a sure sign of a good outing. We departed, eager to see one another again soon. Since that time, we’ve spent an awful lot of time together and communicated in every form you could imagine (text, email, phone calls, letters, playlists). The title of this essay came from the second date, as I was lying next to her on her bed, chatting. I said something along the lines of, “You know how the start of every relationship has that glimmer of hope and possibility?” She responded, “Yes,” smiling. I said, “Let’s hold onto that for as long as we can.” She replied, “I would like that.” We’ve been trying to do so ever since.
Marco Esquandoles
Cautiously Optimistic
¡Bienvenidos a abril! Nosotros en Apollo Mapping estamos gustosos de tenerlos otro mes aquí en los resúmenes españoles del mes de abril.
PRODUCTO DESTACADO — La constelación WorldView Legion de 30 cm y 8 bandas
 Una imagen de WorldView Legion de 30 cm, cortesía de Maxar, capturada sobre el campus NEOM en Arabia Saudita el 2 de diciembre de 2024. Apollo Mapping ha aplicado un balance de color personalizado y mejoras de imagen.
¿Trabaja en planificación urbana, monitoreo ambiental o gestión de recursos y tiene la tarea de identificar el uso del suelo, rastrear cambios en áreas urbanas, evaluar la salud forestal y planificar proyectos de desarrollo? Si es así, las imágenes de alta resolución, con su gran concentración de píxeles para mayor detalle, permiten un análisis y medición precisos de características no visibles en imágenes de menor resolución, lo que facilita una cartografía más precisa, reduce la necesidad de visitas de campo y permite una documentación detallada del mundo real.
Desde su lanzamiento en 2024, la constelación WorldView Legion de 30 centímetros (cm) y 8 bandas es una de las constelaciones de satélites de 30 cm más prolíficas disponibles en el sector de imágenes satelitales de alta resolución. Con seis satélites actualmente en órbita, la constelación WorldView Legion captura aproximadamente 3.2 millones de kilómetros cuadrados (km²) de imágenes de alta resolución de 30 cm diariamente, que se incorporan al Cazador de Imágenes casi de forma instantánea. Además, su avanzado sensor multiespectral captura datos en ocho diferentes longitudes de onda, ofreciendo perspectivas excepcionalmente detalladas de la superficie terrestre y facilitando la identificación de objetos pequeños y la detección de cambios ambientales sutiles tanto en entornos urbanos como naturales. Aplicaciones avanzadas como batimetría, evaluación de la vegetación, exploración mineral y monitoreo de incendios forestales son casos de uso comunes para las imágenes satelitales WorldView Legion de 30 cm.
Con el 90% de la población mundial residiendo entre las latitudes 45° Norte y 45° Sur, la constelación está optimizada para intervalos de revisita más rápidos en estas regiones, manteniendo al mismo tiempo la cobertura de latitudes más altas con dos satélites en órbita sincrónica solar. Cuatro satélites WorldView Legion orbitan el planeta en órbitas persistentes de latitudes medias. La constelación WorldView Legion opera a través de múltiples trayectorias orbitales con una huella de 10 km en nadir, lo que permite revisitas frecuentes—hasta 15 veces al día en regiones seleccionadas.
Esta mayor capacidad y frecuencia de revisita en las áreas más pobladas del mundo crea un archivo robusto y capacidades avanzadas de monitoreo en estas regiones cruciales. La frecuencia de revisita permite una cartografía integral, una detección de cambios robusta y un análisis detallado sobre extensas áreas geográficas. Estas capacidades permiten que WorldView Legion de 30 cm respalde una amplia gama de aplicaciones geoespaciales, incluidos proyectos que requieren análisis espectral y un alto nivel de detalle.
Con seis satélites activos en órbita, la constelación WorldView Legion destaca por:
- Imágenes pancromáticas de 30 cm y multiespectrales de 8 bandas a 1.2 m (costera, azul, verde, amarillo, rojo, borde rojo 1, borde rojo 2, NIR).
- Ofrecer cuatro satélites en órbita media (MIO) concentrados en las áreas más pobladas del planeta.
- Capturar más de 500,000 km² diarios por cada satélite.
- Proporcionar un promedio de tres accesos diarios a ubicaciones entre 40° Norte y Sur.
- Capturar imágenes a lo largo del día, no solo por la mañana, gracias a sus satélites MIO.
La constelación WorldView Legion de 30 cm permite a Apollo Mapping ofrecer una mayor capacidad de obtención de imágenes de alta resolución y tiempos de entrega más rápidos a clientes en diversos sectores, incluidos defensa, minería, petróleo y gas, ingeniería, educación e investigación, y ayuda humanitaria.
¡Puede explorar todo nuestro archivo de imágenes satelitales hoy mismo en Cazador de Imágenes!
Para ver cómo las imágenes WorldView Legion de 30 cm y 8 bandas pueden respaldar su próximo proyecto, u obtener recomendaciones personalizadas, contacte a nuestro equipo de ventas en sales@apollomapping.com ahora.
PRODUCTO DESTACADO — DEMs Vivid Terrain de 50 cm de Vantor — ¡Un nuevo tamaño mínimo de pedido!
 Un DSM de Vivid Terrain de 50 cm capturado sobre Oahu, Hawái, EE. UU.
¡Una emocionante actualización de producto! En primer lugar, el nombre de este producto ha cambiado a Vivid Terrain, pero todo lo demás se mantiene igual que la oferta original Precision 3D; bueno, todo excepto el pedido mínimo, que ahora es de solo 100 kilómetros cuadrados, ¡una disminución enorme respecto al mínimo original!
En conjunto con nuestro socio Vantor, nos complace ofrecer modelos digitales de elevación (DEM) Vivid Terrain de 50 cm (anteriormente llamados Precision 3D o P3D) a partir de un archivo en crecimiento que ya cubre más del 80% de la masa terrestre global.
Producidos exclusivamente por Vantor a partir de su extenso archivo de imágenes satelitales mono, pueden crear modelos digitales de elevación (DEM) con resolución de 50 centímetros (cm) y una impresionante precisión espacial.
 Un DTM de la Cordillera Front Range de Colorado en el lado izquierdo de la imagen se fusiona con un modelo de superficie 3D de Vivid Terrain sobre Golden, Colorado, EE. UU.
Vivid Terrain reemplaza la necesidad de pares estereoscópicos al combinar múltiples imágenes satelitales de alta resolución tomadas desde diferentes ángulos de observación junto con un algoritmo de modelado 3D para crear modelos de elevación extremadamente detallados y precisos. Los DEMs de Vivid Terrain se ofrecen en una variedad de resoluciones como modelo digital de superficie (DSM) o modelo digital de terreno (DTM).
A continuación, un resumen de las especificaciones actuales de los DEMs Vivid Terrain:
Espaciado de píxel del DEM (es decir, resolución): 50 cm (oferta principal del producto)
Precisión vertical absoluta: < 3 m Error Lineal 90% (LE90)
Precisión horizontal absoluta: < 3 m Error Circular 90% (CE90)
Niveles de producto: DSM y DTM
Tiempo promedio de entrega: 2–3 semanas, donde esté disponible
Gracias al extenso archivo de Vantor, pueden crear DEMs personalizados de casi cualquier lugar del mundo, agregando grandes bloques al archivo de Vivid Terrain cada mes.
Puede buscar cobertura de DEMs Vivid Terrain las 24 horas del día utilizando Cazador de Imágenes. Si tiene solicitudes de precios, preguntas adicionales o desea una nueva lista de precios con datos DEM de Vivid Terrain incluidos, envíenos un correo electrónico a sales@apollomapping.com.
Descuentos para organizaciones sin fines de lucro en imágenes del archivo de Vantor
 Una imagen de 79 centímetros, tomada con un ángulo alto fuera de nadir, capturada sobre las terrazas del Duomo en Milán, Italia, el 9 de abril de 2019 por el satélite WorldView-3 de Vantor.
Tenemos una emocionante actualización para nuestros lectores que trabajan en el mundo sin fines de lucro: a partir de ahora, nos complace ofrecer un 30% de descuento en todos los productos de imágenes del archivo de Vantor.
Si tiene un proyecto para el cual necesita ayuda para encontrar imágenes de Vantor con descuento, háganoslo saber y con gusto le ayudaremos a realizar una búsqueda en el archivo. Simplemente envíenos los detalles de su proyecto y el polígono del área de interés a sales@apollomapping.com y le responderemos a la brevedad. También puede consultar todo el archivo de imágenes de Vantor en cualquier momento utilizando Cazador de Imágenes.
Tenga en cuenta que este descuento no aplica a los productos Vantor Vivid, modelos digitales de elevación (DEMs) ni a pedidos de adquisición de imágenes de tarea.
Fernando Gutierrez
Topographic Translator
I recently returned from a memorable trip to visit a friend I hadn’t seen in many years. We chose to meet halfway between our homes, taking the opportunity to unplug and immerse ourselves in nature. Together, we explored the historic Oak Alley Plantation, marveling at its stunning collection of oak trees, some dating back one or two centuries. The gardens were coming alive, with greenery spreading and the first blooms of the season appearing.
Spring is beginning to enliven our southernmost gardens, with azaleas bursting into bloom, daffodils emerging, and trees unfurling their first leaves. Having experienced spring in several different places, I find it fascinating to observe how the season manifests uniquely in each region. As spring arrives in your neighborhood, what signs do you notice? Let’s consider spring’s arrival from a mapping perspective.
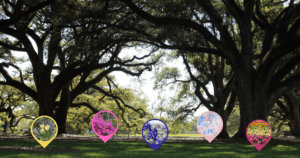 Created in Canva by B. Duke. Oaks photo by B. Duke
How do plants know it’s spring? Research conducted in Germany has revealed that a plant’s internal alarm clock is triggered by the amount of daylight. As a certain protein responds to extended hours of sunlight, it signals plants to bloom. This year, the Spring Equinox occurred on March 20th at 9:46 AM, ushering in longer days. Unless you live in an area where spring snow is common, it’s time to welcome the season. The NOAA provides key data about drought and flooding, which can influence the timing of blooms. The National Phenology Network maps the emergence of first leaves and first blooms, and this year’s maps reveal interesting trends in early spring arrivals.
For those who enjoy observing nature, many states showcase their most popular blooms on public watch sites. In Texas, the state flower – cheerful blue-purple wildflowers – blankets acres of fields each spring. It’s a beloved tradition to take photos among the bluebonnets or simply enjoy their beauty, while being mindful of snakes that also frequent these fields. The City of Brenham, Texas offers a site with daily bloom notices, a driving tour, and more. Visitors can even enjoy Blue Bell ice cream in the area. Lady Bird Johnson, the former First Lady, left a lasting legacy of wildflowers throughout her home state.
In my own garden, the delicate clusters of Lady Banks roses signify that spring has firmly arrived. The New York Botanical Garden actively tracks many blooms with a collection of online trackers. If you plan to visit New York in spring, watch for cherries, magnolias, daffodils, lilacs, azaleas, peonies, roses, water lilies, lotuses, and later, fall foliage. I also recall visiting the cherry blossoms in Washington, DC, where the lacy pink blooms lining the Tidal Basin offer a vivid contrast to winter’s chill. In Tulsa, Oklahoma, the botanical garden features “What’s Blooming?” every month, with photography that can brighten your day even from afar. Arizona’s state parks champion wildflowers, and last year Forbes published a beautiful collection of spring photos sure to lift your spirits.
Spring can have a positive impact on your wellbeing. Brené Brown once said, “I love spring because she always finds a way.” I am inspired by the mantra, “Bloom where you’re planted.” Finding contentment and peace where you are, in any season, can enhance your wellbeing. I hope you discover renewal and joy this spring. If you need me, I’ll be on the porch, admiring my Lady Banks roses and watching birds build nests among their branches.
Barbaree Duke
Geospatial Crusader
In March, we looked at potash evaporation ponds near Moab, Utah. This month for the Pléiades 1 – Pléiades Neo Point of Interest, we check out Plasencia Auditorium and Congress Center in Spain.
About the Point of Interest: Built in 2017, the Plasencia Auditorium and Congress Center sits on the boundary between the nearest town and the countryside on the outskirts of Plasencia. The building can be seen from the distance, its luminous exterior seemingly glowing.

 These two satellite images show an aerial view of the Plascencia Auditorium and Congress Center in Spain. In the first image here, Pléiades Neo 3 30-cm color data from July 4, 2023, we can see the gleaming translucent auditorium and conference center with dull brown ground nearby and other colorful buildings a stone’s throw away. The second sample here, a 50-cm Pléiades 1A color image taken August 12, 2023, the image captures a larger area given its lower resolution. These images have custom processing and color balancing applied by Apollo Mapping. PLEIADES © CNES 2026, Distribution Airbus DS.
Fun Factoids: (1) In the entrance lobby there is a secondary hall for 300 people, which can be divided into three for 100 spectators each, additional exhibition halls and a restaurant area. (2) The entrance is on the urbanized side of the building at street level, more than 17 meters above the lowest part of the building, using an orange gangway that arrives at a 12 meters deep vertical canyon in the same color, where the view of the countryside, i.e. the spurs of the Gata Range, are heightened. (3) Rather than fill in the site, the architects created a cantilevered shape to hover over the rocky terrain. (4) Architecture critic and curator Beatrice Galilee (b. 1982) describes the building as “part chrysalis, part meteorite – an extraordinary luminous center designed by wrapping all of the functions of a theatre, a dance hall, an exhibition space and conference auditoriums into a tight ball.” (5) Created by Spanish firm SelgasCano, the Plasencia Auditorium was designed to make as small a footprint as possible in every sense. Of the building’s 86,000-square-foot volume, only 4,300 feet touch the ground, whilst the translucent “skin” – made of the durable, air-filled plastic ETFE – is self-cleaning and easy to install, barely adding any weight to construction and offering up to 45 percent reductions in solar heat gain. (6) Shaped like a giant boulder, the multifaceted building is wrapped in a translucent skin of ETFE panels that floods the interior with natural light during the day and glows like a lantern when illuminated from within at night. In contrast to its pale exterior, the interior is dominated with vibrant colors — from a bright orange entry hall to a deep red auditorium — that heighten the structure’s ethereal feel.
The 50-cm Pléiades 1 High-Resolution Satellite Constellation
The Pléiades 1 constellation (or at least part of it!) has been in orbit since December 2011 and if you have not had a chance to check out any sample imagery, take a few moments and have a look at the gallery on our website. If you work with high-resolution imagery, you should consider Pléiades 1 and Pléiades Neo for your next geospatial projects.
A variety of Pléiades 1 products are available from both a well-established archive and as a new collection, including 50-centimeter (cm) pansharpened imagery and 50-cm panchromatic – 2-meter (m) 4-band multispectral bundles. We are happy to discuss the technical specifications, pricing and tasking options available with both of these satellite constellations.
The 30-cm Pléiades Neo High-Resolution Satellite Constellation
Pléiades Neo is our newest high-resolution satellite constellation. The first Neo satellite went up in April 2021 and the second in August of the same year. This 30-centimeter resolution constellation will add two more satellites in the next few months and upgrade from daily to intraday revisits. Pléiades Neo has six multispectral bands with 1.2-meter resolution, including a deep blue and two infrared bands, along with a 30-centimeter resolution panchromatic band.
The archive is growing every day, and the satellites are available for new collections, making Pléiades Neo the perfect solution for site monitoring. Check out our beautiful sample images in the Pléiades Neo gallery.
More sample images and technical information about Pléiades 1 can be found on our website here; while the same can be found here for the Pléiades Neo constellation.
The Apollo Mapping sales team can answer any questions you might have about Pléiades 1 and/or Pléiades Neo. We can be reached at (303) 993-3863 or sales@apollomapping.com.