Apollo News Snippets – November 2026
- As per usual, we have a nice list of insanely cool technological advancements announced over the past month. So sit back and enjoy:
Artificial sweeteners can actually alter genes in mice, what about in humans?
A new way to convert mixed plastics to hydrogen fuel.
The intersection of climate change, the decline of pollinators and plant genetic resilience.
A new way to map tides using satellite imagery and elevation models.
This tiny structure outperforms more expensive metallic catalysts for methane production.
Modeling suggests our Moon could have formed in hours.
A new way to display brilliant white colors.
Engineered yeast can turn waste plastics into 3D printed cookies.
Plasma-powered cement production cuts out greenhouse gases.
There is a connection between the smell of chocolate and improved workouts.
New solar-powered desalination technique creates fresh water and reusable salts and minerals.
This stronger concrete uses some sustainable inputs and even absorbs carbon dioxide.
A new way to convert CO2 gas into usable products.
These ancient proteins pack a large punch against microbes.
- The Global Climate Change Report for September 2026 has been released by NOAA’s National Centers for Environmental Information and reveals further proof that global climate change remains a concern. In September 2026, the global surface temperature 1.33°C (2.39°F) above the 20th Century average, ranking as the second warmest September since global records began in 1850. This value falls behind 2023 by 0.07°C (0.13°F). September 2026 marked the 51st =consecutive September with global temperatures above the 20th Century average. Notably, the past four Septembers (2023–2026) represent the four warmest Septembers on record and are the only Septembers to exceed a +1.0°C (+1.8°F) departure. All 10 of the warmest Septembers have occurred since 2015. For the fourth consecutive month, the global ocean surface temperature departure set a new record high, averaging 1.10°C (1.98°F) above average for September. This surpassed the previous September record set in 2023 by 0.08°C (0.14°F) and marked only the second time a September ocean-departure has exceeded +1.0°C (+1.8°F). This value represents the highest ocean temperature departure for any month on record, edging out the previous all-time record set in August 2026 by +0.02°C (+0.04°F). The unprecedented heat was driven by record heat in an extensive swath of the central and eastern tropical Pacific Ocean (consistent with ongoing El Niño conditions), as well as record-high ocean surface temperatures across portions of the Atlantic, Indian, Southern and Pacific oceans.
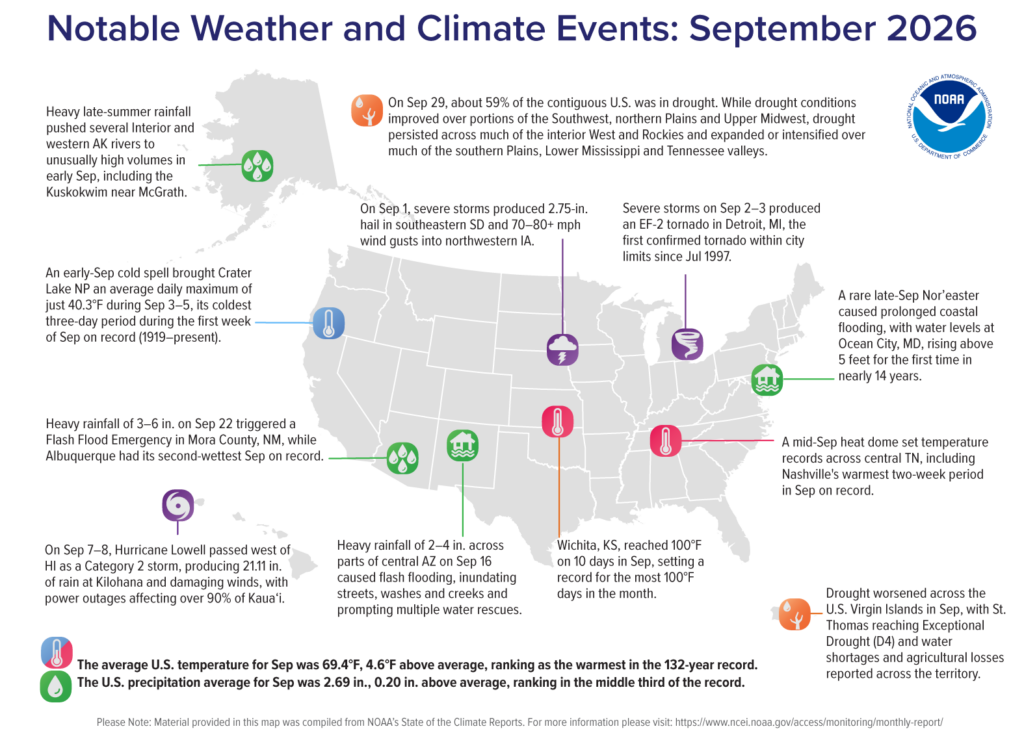
The Arctic experienced its 13th lowest sea ice extent in September 2026 and its warmest September on record, while the Antarctic saw the third lowest sea ice extent. September 2026 was North America’s warmest September on record, which also happened in Asia. Global tropical cyclone activity was above average with 19 named storms in September. Typhoon Saudel made landfall three times across southeastern China, causing excessive rain and triggered widespread flooding that damaged homes and buildings. Typhoon Dujuan dumped record-breaking rainfall across parts of eastern Japan, which led to flooding and landslides. Hurricane Polo became the second most intense hurricane on record in the eastern North Pacific basin by pressure, ranking behind only Hurricane Patricia in 2015. (Image Credit: NOAA Global Climate Report)
- We can celebrate more than just Thanksgiving in November. In fact, GIS Day falls on November 18 – an annual celebration of geographic information systems. November is brimming with community events: Turkey Trots, holiday parades, tree-lighting ceremonies, seasonal markets, concerts and winter festivals. Behind many of those events is GIS, working to map out the best running route for a Turkey Trot, and what streets should be closed and what roads should a parade route follow. Or where should temporary parking be located for seasonal markets and tree-lighting ceremonies? Here’s an example of the town of Olivette using GIS to map out a Turkey Trot. Not surprising, the highly anticipated Macy’s Thanksgiving Day Parade covers a 2.5-mile route in Manhattan, and so New York City uses GIS and task forces for spatial mapping, crowd management, and real-time wind speed safety tracking. In fact, GIS is used for all New York City’s major special events, such as the New Year’s Eve Times Square celebration, St. Patrick’s Day parade, 4th of July fireworks event, and Macy’s Thanksgiving Day parade; each requires months of planning. The Fire Department of New York GIS Unit uses ArcGIS to bring together various datasets to create a single map for the department’s special event deployment and aid in interagency coordination. GIS helps build preplan maps that incident commanders then utilize to plan where to place personnel and equipment to maintain situational awareness during the actual event. The web map application allows the operations center to view maps of the current special event deployment in real-time. The New Year’s Eve celebration draws one million attendees, and FDNY provides 15 EMS units and four hazmat teams for the event. The last event was relatively calm: only 150 people were treated for injuries. GIS helped view where fire and medical branch teams were located so that, should a major incident occur, the city would be ready.
Brock Adam McCarty
Map Wizard
(720) 470-7988
brock@apollomapping.com