
- Every month we feature some of the craziest and neatest technological advancements from around the world, so without further delay, let’s jump into the June list!
A way to make LED lighting even more efficient.
Solar cells made of Moon dust!
A unique way to reduce motion sickness.
Low-cost method to produce clean water and hydrogen gas from seawater.
A soft, liquid battery.
Do chimps go to bars too?
This metamaterial is both strong and stretchable.
Engineered stomach microbe absorbs less mercury from seafood.
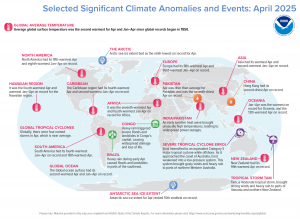 During April 2025, North America experienced its fifth warmest April and eighth warmest January-April on record. The Caribbean region had its fourth warmest April and second warmest January through April on record. Heavy rain triggered severe floods and landslides in Congo’s capital, causing widespread damage and loss of life. Heavy rain during early April in Brazil caused floods and landslides in parts of the southeast. Hong Kong had its second driest April on record and Asian had its warmest April and second warmest January through April on record. (Image Credit: NOAA Global Climate Report)
- The NOAA Global Climate Change Report for April 2025 has been released by the National Centers for Environmental Information and reveals further proof that global climate change remains a concern. April 2025 temperature was 1.22°C (2.20°F) higher than the 20th Century average. This was the second warmest April in NOAA’s 176-year record and was only 0.07°C (0.13°F) cooler than the record-warm April 2024. Notably, the 10 warmest Aprils on record have all occurred since 2010, with nine of them occurring since 2016. April 2025 also marked the 49th consecutive April with above-average global temperatures. The global land-only April temperature was 1.97°C (3.55°F) higher than the 20th Century average, surpassing the previous record set back in April 2016 by 0.05°C (0.09°F). The global ocean-only temperature was second highest on record for April at 0.88°C (1.58°F) higher than the 20th Century average. This value was 0.13°C (0.23°F) cooler than the record-high April 2024.
- June is National Dairy Month, celebrated across the country by the dairy industry, farmers, and producers of dairy products. Unofficially, June 4 happens to be National Cheese Day. Cheese is produced from the pressed curds of milk. According to Kitchen Aid, there are more than 2,000 types of cheese. The six most common cheese categories are hard, soft, blue, pasta filata, soft-ripened and processed. But before cheese processors can even think about making cheese, they need to procure the milk from dairy cattle. There are numerous dairy milk haulers who rely on GIS and logistics tools to help map out the collection points of milk from dairies that don’t process their own line of products on the farm. Land O’Lakes agricultural cooperative, which was founded nearly 100 years ago by 320 creameries to improve the quality, consistency, marketing and economics of its dairy products, is one of the largest co-ops in the United States. It includes about 4,000 members and more than 10,000 employees. Its industries include dairy products, animal feed, and crop inputs and insights with sales totaling $13–$15 billion per year. In 2013, Land O’Lakes started using GIS to show co-op members mapping information related to trade areas for projects, as well as where their facilities are located within the trade area and where their competitors are located, explained Josie Taylor with Land O’Lakes. “This allows us to visually tell them a story about the geographic dynamics of the trade area we are analyzing and how we are thinking about improving it,” Taylor said. The second way the team uses GIS is for field data collection. “We often need to go out and look at the facilities that the co-ops are running and analyze how they are operating them. What are the capabilities of those facilities? How old are they? Can we expand those facilities?” Taylor said. “We use [Survey123 for ArcGIS] to capture a comprehensive and consistent set of data about the facilities.” The third way in which Land O’Lakes uses GIS is for analytics. “If we’ve got multiple facilities that are close together, we analyze where the trade areas overlap. We also perform transportation analysis to determine how products are currently being delivered to our customers and if there is a more efficient way to do it. That’s often about reallocating customers to a specific facility – that is, analyzing the facility they are currently using compared to one that is more appropriate for their use based on distance, functionality, future growth, and so on,” Taylor said. Taylor and her team also use GIS to explore drive-time routes within specific trade territories, as well as route planning. The SAM team uses GIS extensively to conduct market and logistics analyses when deciding if cooperatives should make large-scale capital investments or not. “In our consulting practice, we are seeing increased demand for projects that provide long-term solutions in the changing agricultural industry, and GIS is critical in performing the necessary analyses,” Taylor said.
Brock Adam McCarty
Map Wizard
(720) 470-7988
brock@apollomapping.com
This entry was posted in The Geospatial Times and tagged apollo news, News Snippets, The Geospatial Times Bookmark the permalink.

Leave a Reply