

- We follow up a large July list of technological advancements with another massive list here in August – enjoy!
A new nasal spray could reverse brain aging.
Rouge moons circling starless planets could harbor life.
A more sustainable way to desalinate seawater.
Sea sponges can help us discover new molecules for potent drugs.
A more efficient system to directly produce fuel from sunlight.
Major step forward with catalyst for energy production from CO2.
This hidden fungal network helps control the world’s climate.
A more efficient way to breakdown forever chemicals.
An efficient system to convert carbon dioxide to methanol.
New material to protect electric transformers.
Our Solar System may have lost at least one early planet.
Have you ever wondered how a honeybee becomes a queen?
Sunlight driven desalination system also leaves no waste brine behind.
This material can increase the energy of a photon.
From waste ocean plastics to asphalt roads.
A new way to target and fight cancer.
Water can improve diesel fuel efficiency and reduce pollution.
A new life for spent EV batteries.
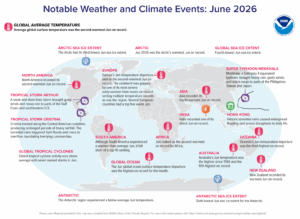 North America recorded its second warmest June on record while Europe’s June temperature tied as the second warmest on record. India experienced one of its driest Junes on record and Africa experienced its second warmest June. Tropical Storm Arthur brought gusty winds and heavy rain to parts of the Gulf Coast and southeastern U.S., while Tropica Storm Cristina produced prolonged periods of heavy rainfall and torrential rains that triggered flash floods and overflowing rivers. Hong Kong also experienced historic torrential rains that caused widespread flooding. Super Typhoon Mekkhyala, a category 4, dumped heavy rain and brought gusty winds and storm surges to parts of the Philippines, Taiwan and Japan. (Image Credit: NOAA Global Climate Report)
- The Global Climate Change Report for June 2026 has been released by NOAA’s National Centers for Environmental Information and reveals further proof that global climate change remains a concern. The June 2026 global surface temperature was 1.09°C (1.96°F) above average – the second warmest June in the 177-year record. This value was 0.09°C (0.16°F) below the 2024 record and only 0.02°C (0.04°F) above June 2023, which currently ranks as the third warmest June on record. The 10 warmest Junes on record have all occurred since 2015, with each of the last eight years (2019–2026) ranking among them. Additionally, this month marked the 50th consecutive June with global temperatures above the 20th Century average; the last below-average June occurred half a century ago in 1976 (-0.05°C / -0.09°F). The global ocean temperature departure for June was the highest on record at 0.99°C (1.78°F) above average, eclipsing the previous June record set in 2024 by 0.04°C (0.07°F). Across all 2,118 months in the historical record since January 1850, June 2026 tied with July 2023 as the seventh-highest global ocean temperature departure. Meanwhile, global land surface temperatures ranked as the fourth warmest on record for the month.
- Pumpkin and pecan pies are popular around Thanksgiving while mint and key lime pies are perfect for the green-themed St. Patrick’s Day. Blueberry and strawberry pies help herald in the Fourth of July with their red, white, and blue colors; and good ol’ cherry pie rings true any time of the year. Regardless of your favorite flavor of pie, be sure and celebrate Homemade Pie Day on August 1st! People are encouraged to bust out their rolling pin and whip up a sweet or savory pie from scratch. If you need inspiration for Homemade Pie Day, draw upon GIS mapping technology to find recipes from around the world that would appeal to your palate. RecipeDB is a structured compilation of recipes, ingredients and nutrition profiles interlinked with flavor profiles and health associations. The database consists of 118,171 recipes from cuisines across the globe (6 continents, 26 geocultural regions and 74 countries), cooked using 268 processes (heat, cook, boil, simmer, bake, etc.), by blending more than 20,262 diverse ingredients, which are further linked to their flavor molecules (FlavorDB) and nutritional profiles (U.S. Department of Agriculture). Edamam indexes more than 2.3 million recipes and offers APIs for diet filters, nutrition breakdowns, and chronic condition analysis. The U.S. Department of Agriculture’s SNAP-Ed Connection’s Recipe Finder offers a nutrition-focused database that features yield-tested recipes with cost estimates.
Brock Adam McCarty
Map Wizard
(720) 470-7988
brock@apollomapping.com
This entry was posted in The Geospatial Times and tagged apollo news, News Snippets, The Geospatial Times Bookmark the permalink.


 Copyright © 2025 All Rights Reserved -
Leave a Reply