
Free For All – The Climate Impact Map, a Dynamic Climate Change Visualizer
In this September edition of our Free for All series, we change the pace by covering a great example of an interactive and informative…

Featured article
In this monthly article, we travel the world to check out unique, fun and sometimes a bit weird 30-centimeter (cm) color imagery samples from the WorldView constellation. In September, we looked at…

In this September edition of our Free for All series, we change the pace by covering a great example of an interactive and informative…
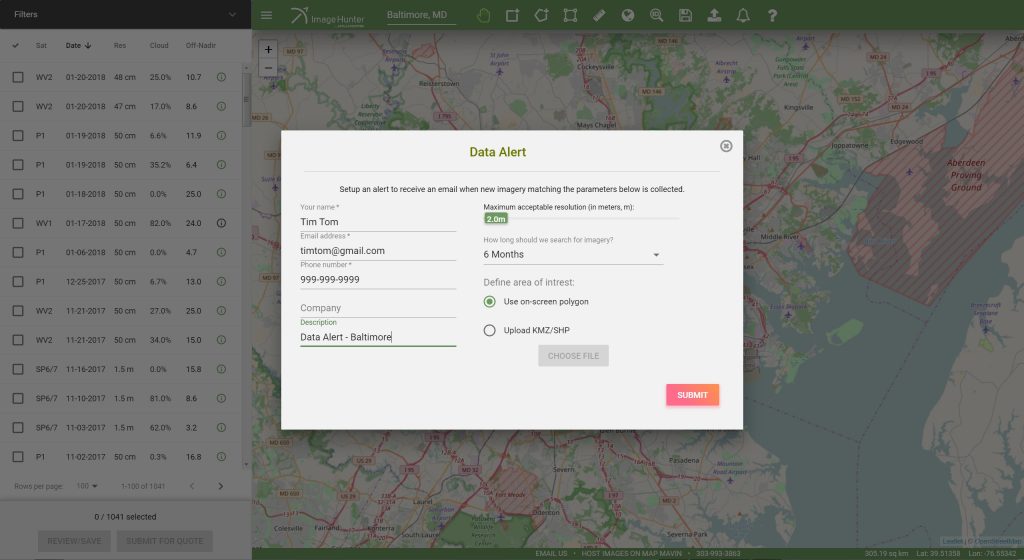
Do you have an area of interest that requires regularly updated imagery but you do not have time to check daily for this data?…

(Image Courtesy: Maxar. Processed by Apollo Mapping for improved color accuracy and clarity.) We love maps. We love imagery. We love work breaks. We…

A 3.7-meter WorldView-3 SWIR sample collected over the Andes Mountains in Peru. We have used a 2-6-8 (blue-green-red) band combination to display this data…
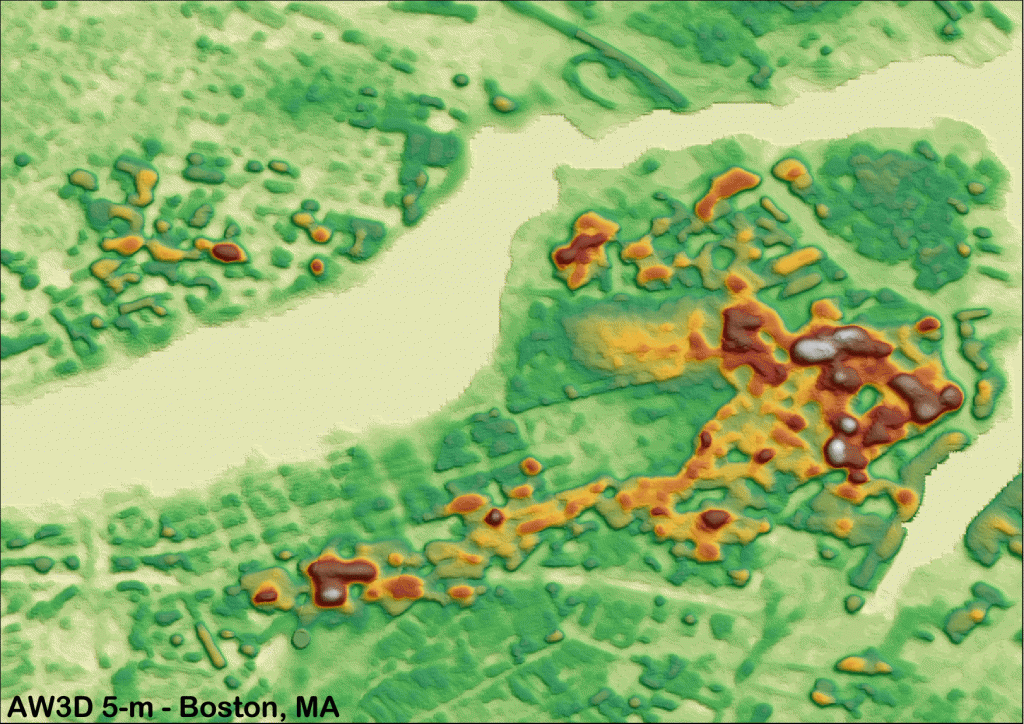
Click on the image above to see an animated views comparing 2.5-m and 5-m AW3D DEMs over Boston, Massachusetts and Washington, D.C. (C)NTT DATA,…
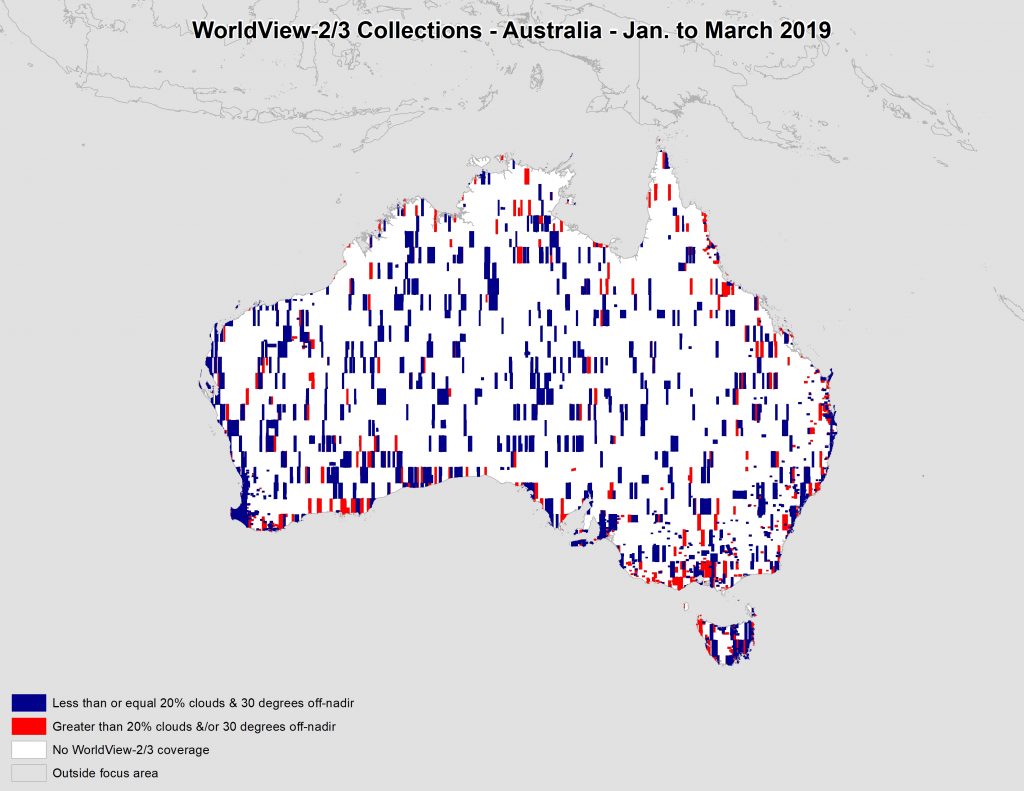
This map shows the areas imaged by the WorldView-2/3 constellation from January 1 to March 31, 2019 over Australia and its islands. Please note…
Find the imagery you need, your way.
From area of interest to delivered assets — typically within 24 hours.
Self-serve
Define your area of interest, compare results, and request pricing
— all in minutes.
Best for experienced users who know what they need.
Done for you
Share your area, timeframe, and goals
— we’ll handle the rest.
Ideal if you’re unsure which imagery is right for your project.