
 A 50-cm color DS-EO image collected on June 13, 2025 over Muara, Brunei.
Are you seeking high-resolution images tailored for precision-focused applications within the equatorial region? Launched from India in 2022 by Geo-Insights, the 50-cm DS-EO satellite system can collect the imagery you need, and collect often. DS-EO carries an electro-optic, multi-spectral payload that provides 4-band 2-meter (m) multispectral and 50-centimeter (cm) panchromatic images for advanced spectral analysis. It can produce accurate 4-band imagery and boasts a panchromatic band wavelength range of 450 – 800 nanometers to capture broad-spectrum black and white imagery with high resolution at 50-cm.
Because of the twice daily visits, you can utilize reliable, timely DS-EO data with exceptional detail in the equatorial zone. With 16-bit depth, 50-cm panchromatic resolution, and four 2-m multispectral bands, it is possible to conduct analyses that include object identification, as well as assessments of vegetation health and water quality.
Learn more about how DS-EO offers sharp details for insightful analytics, identifying multi-faceted objects in environmental or maritime circumstances!
You can query 50-cm DS-EO data anytime on Image Hunter. And if you have any additional questions about tasking DS-EO or archive data from this satellite system, you can email us now at sales@apollomapping.com.
I recently returned from a conference in the desert. The dry air and sun-scorched temperatures are not my preference, but it is impossible to miss how many people, plants, and critters manage to thrive there. The landscapes were beautiful, gentle taupe-colored mountains dotted with cactus and palm trees against the brilliant blue sky, simply thriving while I personally was melting. Humans, animals, and plants all find a way to thrive and grow.
Deserts are interestingly dynamic ecosystems. A recent study from the University of Reading says that cacti are a species not only thriving but also “evolving at a shockingly high rate.” These slow-growing plants are particularly adept at creating new species. “Instead of flower size or pollinator type driving diversification, the key factor appears to be how rapidly cactus flowers change shape over time.” Changing shape quickly over time reminds me of the human impact on landscapes and other things that shape-shift and still thrive.
As geospatial folks, we are keenly aware of our planet’s natural morphing over time. The most naturally changed landscapes on Earth are characterized by rapid geological shifts, active volcanism, glacial retreat, and extreme erosion. While some evolve slowly over millions of years, others undergo drastic visible transformations in mere decades. It’s intriguing to watch the world move from Pangea to today…millions of years to slowly become our current earth.
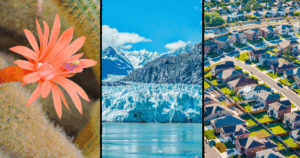 Canva creation by BD.
Did you realize that many popular global tourist destinations showcase our changing planet? Sea rise in Venice has humans getting creative to keep the sea in check. In 1850, Glacier National Park had about 150 documented glaciers. Today, that number has dwindled to roughly two dozen named glaciers that meet the minimum size criteria to flow under their own weight. Victoria Falls suffered from tremendous drought in recent years while the Swiss Alps saw reduced snowfall. The Maldives are working hard to adapt to climate change as well. Drier and warmer weather creates ideal conditions for wildfires, destroying communities like Lahaina, HI, and dissipates water bodies at an alarming rate such as in the Dead Sea. Its water level drops by roughly 4 feet annually, reducing its surface area by one-third over the past 50 years. Landscape change is not limited to glaciers, coastlines, or faraway tourist destinations; it is also happening in the places we call home.
Population change is easy to see and feel. The county that I call home is rapidly increasing in population. Our metro area in south Alabama is in the top ten, ranking sixth, of the fastest growing metro areas in the United States. My town is above 25% growth rate! This growth impacts so many things that might not have been on our city government’s radar. This might be why we have so many hamburger joints and new roundabouts to navigate. Sprawling corn fields have morphed to subdivisions and solar arrays. In October 2025, there were 315 active subdivisions under construction bringing 17,000 new students. Do you live near a fast-growing town?
Change is the common thread, whether it shows up in cactus flowers evolving new shapes, glaciers retreating, coastlines shifting, or cornfields becoming neighborhoods. Some landscapes change because of natural forces, some because of climate, and some because people arrive, build, and reshape what was familiar. As geospatial observers, we get a front-row seat to these transformations, but we also live inside them. The challenge is not simply to notice that places are changing, but to understand how, why, and at what cost – and maybe, like the desert itself, find thoughtful ways to adapt and thrive.
If you need me, I’ll be trying a new restaurant in town or finding new ways to help my garden thrive in these changing conditions.
Barbaree Duke
Geospatial Crusader
I was waiting for the first dust-up to come – they’re inevitable in relationships, and they recur over the entirety of the existence of couplings. How you manage them is the key to success or failure. Last month, I focused on minor frustrations, likely the hairline fractures that would set up the argument/disagreement to come. Though, I’m not even sure that would be the best categorization. Let me provide some background.
We’d had a good day (a Saturday), running errands, popping in and out of places neither of us had been or hadn’t been in a while. We interspersed some booze here and there, but not in excess, just maintaining a steady buzz. After several hours being out and about, we went back to my place and were sitting in the sunroom listening to music, each with a drink nearby, my feet propped up on her lap at her prompting. She brought up an innocuous statement I’d made via text when she’d asked me if I was “pro” or “anti” audiobooks – I said “anti” except for car road trips. I thought nothing of it and had no idea it would circle back at all, and certainly not in the way that it did. She (a single mom) reintroduced the item – playfully, in her defense – but twisted it in a way I didn’t intend, instead framing it as a callous dismissal of the struggles of working parents. You see, I said that people who don’t read are doing themselves a “disservice” (and society, too), and that listening to audiobooks was not equivalent to reading actual ones, in terms of the development critical thinking (which, admittedly, has been credibly challenged elsewhere) or the positive effect it has on cognitive function (i.e., brain health). This elicited a response from her that was framed as a defense of the downtrodden, overworked, and overburdened of the world, but really, she was implying that I’d spoken down about her specifically; this couldn’t be further from the truth.
 I heard somewhere that if you have more good days than bad days with someone, that if you laugh more than you cry with them, that if when you think of them you smile more than frown, that you’re probably in a pretty good situation, so don’t blow it. (Image retrieved from here and comes courtesy of Anna Tarazevich)
It is true, however, that I am a judgmental person (a major fault I’m aware of) and I do often speak in sweeping indictments, but that’s in part for efficiency, and in part to see what I can get away with. It turns out that I didn’t get away with anything this time. Anyhow, she kept drilling in, and I was losing my patience – why couldn’t she just drop it? She saw that her “attack” was irritating me. Then she started to bring up other examples of my judgmental tendencies, all of which were laughable and petty. She was grasping for straws, or so it seemed, then she said the thing that shut me down completely: “I could write a whole list of the things you’re overly judgmental about.” Really? You’re keeping track? You must not be very happy in this relationship. She then asked me to say something and I only said, “Okay. I don’t know what else to say” and completely shut down, wanting to her leave, but totally caught off guard by what transpired as well. It wasn’t that I was mad at her per se, I just couldn’t believe she took it where she did. She seemed to sense she’d overstepped and left.
Usually, she texts me when she gets home, and she didn’t, so I texted her. No response. Then I called. No answer. Finally, she texted back, indicating she made it home safely. Okay. I was frustrated but went to bed (not that I slept well). I woke up to two texts: the first sent about 1130pm, 30 minutes after I went to sleep, still pushing that line and framing me as some thoughtless individual lacking self-awareness (I’m overstating this for effect), and then one at 6am basically clawing it all back, saying she was sorry for making such an issue out of something that wasn’t one at all. I called her when I woke up and made plans to see her later that day (a Sunday). We sorted everything out and it was restored.
We’d also already had plans to travel down to Atlanta together for a few days later that week (Wednesday-Friday) for a work thing of hers, and we kept those plans. We had fun. She came over that Saturday, and we went to another pre-established activity, a photoshoot at a JC Penny (I kid you not!) that she set up because she thought it would be funny. It was a blast. We had a great day.
A lot can happen in one week and one day. Our first “fight” (though, it’s not at all like we were yelling at each other or anything), our first trip together (driving, to boot), and some more early-relationship goofiness, something I take as a good sign roughly six months in. It’s been a while since I’ve dated someone this long, and I also took it as a sign of how much I like her that our first dust-up wasn’t the last, with me breaking it off afterwards. In fact, it just made me want to see her again and sort it out quickly. Call it a sign of maturity, I guess…
It’s still early, but despite a lot of red flags in her past (yes, I have them, too), I find myself being drawn closer to her. I still often question being in a relationship in general, as well as some aspects of being with her specifically, but I chalk that up mostly to being in recently unfamiliar territory and the naturally occurring self-protectionist tendencies we all harbor. I also ask myself about our long-term compatibility, as on paper, we’re not an obvious fit for several reasons, but I don’t ever see a ton of evidence of what someone desires in their mind becoming reproduced in reality. I think we sometimes look too hard for the ideal type, and as the saying goes, we let the good be the enemy of the perfect. Sometimes you (I) have to just realize when you have a really good thing and accept that it will come with challenges and the need to compromise, and I guess that’s where I find myself now.
Marco Esquandoles
Learning On a Curve
 A 30-cm WorldView Legion image collected over Seoul, South Korea on October 4, 2024.
When your imagery project requires imagery by tomorrow or you have a project where you need imagery on a specific date, then you need to check out Vantor’s FastView tasking service now! With six 30-centimeter WorldView Legion satellites in orbit, there is no better constellation for rush tasking when you need imagery now. With FastView tasking, you pick the date you want to image and then we will deliver that image to you within hours of collection. It’s that simple – just email us your project details and we will handle the rest!
While FastView is the quickest high-resolution imagery tasking service in the industry, it does come with an important caveat: you pay for the data even if it is collected with 100% clouds. So this service is only for a project that demands imagery with the understanding that weather might not agree with your needs on a specific imaging date.
If you would like to find out more about 30-cm FastView tasking on WorldView Legion, send us an email right now at sales@apollomapping.com and we will get right back to you!

 For July, we feature two bird’s eye view images from our home state of Colorado. The first image was collected over Lyons, Colorado which sits on the Front Range of the Rocky Mountains. The second image was collected in the Rocky Mountains to the southwest of Lyons – we love the colorful terrain featured here. These bird’s eye view images were collected by WorldView-2 on August 3, 2024 with about 1.12-meter resolution. (Satellite Imagery © 2026 Vantor)
Each month, we feature a new bird’s eye view satellite image from a select location around the globe; and for this month, we head to the American Rocky Mountains in our favorite state of Colorado.
What Is Bird’s Eye View Satellite Imagery?
Well, that’s a good question we are happy to answer! When a satellite images the ground below it, there’s always some tilt to the camera as it looks down. This tilt is called off-nadir and is measured in degrees from 0; and so, it follows that 0° off-nadir means that the satellite is pointing directly down at the ground when it images, while a 90° off-nadir would mean that the satellite is pointing to the side and not even at the ground below it when it images. The vast majority of satellite imagery is collected with an off-nadir below 30°. However, in rare occasions, be it by a customer request, or to capture a natural disaster or other important event, a satellite can tilt and image in the range of 35° to 50° which we consider ideal for a high off-nadir imagery, also called bird’s eye view imagery and oblique imagery. These bird’s eye view images lend a unique perspective to satellite imagery that is an expansive view of the landscape from the side. We hope you enjoy the bird’s eye view satellite imagery that we share in this article. And if you have any questions about this type of data or any of the imagery products we can help you with, send us an email at any time to sales@apollomapping.com!
If you are interested in additional bird’s eye view satellite images from this location, head over to our Reddit subgroup, BirdsEyeViewImagery, and become a member. We post high off-nadir satellite imagery every Friday in the BirdsEyeViewImagery subgroup – most of which is not posted here.
 El Alma del Ebro, a faceless statue, represents a person sitting on the floor with its legs drawn up to the chest and, to emphasize anonymity, an absent face. The sculpture was created from hundreds of white painted stainless-steel letters, and with an open design so that people can walk inside. When strolling inside, guests can look upward and absorb the enormity of the sculpture’s size. It stands around 40 feet high and 24 feet wide. Each letter measures 25 inches and they vary in thickness. El Alma del Ebro means “the soul of the Ebro” and takes its name from the Ebro River, which runs through Zaragoza, the capital of Spain’s Aragon region. The sculpture, by Jaume Plensa, can be found at Plaza Lucas Miret in Zaragoza, Spain. Plaza Lucas Miret Rodríguez is located in the Expo 2008 area of Zaragoza, Spain. It serves as the address for major landmarks such as the Palacio de Congresos (Zaragoza Conference Center) and the Mobility City Museum. Sitting in the center of the plaza, one can see the circular white outline of El Alma del Ebro. Different sculptures are scattered across the plaza, along with lush green landscaping. The 30-cm WorldView Legion image featured here was collected on May 25, 2025, and has custom processing and color balance applied by Apollo Mapping. (Satellite Imagery © 2026 Vantor)
In this monthly article, we travel the world to check out unique, fun and sometimes a bit weird 30-centimeter (cm) color imagery samples from the WorldView constellation. In June, we looked at the Pigeon Towers in Ad-Dilam, Saudi Arabia. For this edition of the 30-cm Color WorldView Image of the Month, we feature an image of El Alma del Ebro at Plaza Lucas Miret in Zaragoza, Spain.
30-cm WorldView-3 (WV3) launched in late 2014, WorldView-4 (WV4) launched in late 2016 and then the first WorldView Legion satellites launched in 2024. Taken together, this is the most advanced satellite constellation the commercial marketplace has ever had access to. Here are a few of the features that really set these satellites apart from the competition:
- Improved Resolution
- Higher resolution means you can see more detail in WorldView imagery.
- Data collected at nadir will have 31-centimeter (cm) panchromatic, 1.24-meter (m) visible and near infrared, 3.7-m SWIR (WV3 only) and 30-m CAVIS (WV3 only) bands.
- Additional Spectral Bands
- If spectral analysis is part of your project, then no other satellite can match WorldView-3 and WorldView Legion with their 8 bands of visible and near-infrared data; and then 8 shortwave infrared bands (WV3 only) which are crucial for geological studies.
- Better Positional Accuracy
- With accuracies of 3.5-m CE90% or better (without ground control even!), the 30-cm WorldView constellation has no rivals for its enhanced positional accuracy.
- Daily Revisits
- With multiple WorldView-3 and WorldView Legion satellites orbiting our planet, daily revisits are available for most locations.
- WV4 is no longer collecting new imagery.
- Increased Collection Capacity
-
- WV3/4 feature 13.1-km swath widths (at nadir) with the ability to collect up to 680,000 square kilometers (sq km) of high-resolution data per day per satellite (though WV4 is dead now).
- WorldView Legion features six 30-cm satellites, significantly boosting the collection capacity of this leading high-resolution constellation.
If you are interested in WorldView-3, WorldView-4 and/or WorldView Legion imagery for your next project, please let us know by phone, 303-993-3863, or by email, sales@apollomapping.com.
You can also find more WV3 samples and technical information on our website here; WV4 samples and information can be found here; and then finally here is more information about WorldView Legion.
- For our July edition of all things technology related, we have one of the largest lists we have ever featured, enjoy!
From waste plastic to a fuel source.
Making jet fuel in a pot from waste sugarcane.
Coffee alters your brain and gut.
Using sunlight to convert plastic waste to usable outputs.
A water-based solution to recycle lithium-ion batteries.
An old coal mine powers a Canadian community.
More evidence that plants are amazing!
Ultra stainless steel developed.
This algae species can remove microplastics from water.
These tiny metal lumps can exist at two places at once.
Next-generation computer chips developed.
This liquid battery can store renewable energy and release it as heat.
Organic molecule identified in a dinosaur fossil.
A NASA satellite set to map the cosmos in infrared is launching early.
Asteroid strikes may have helped sparked life on Earth.
Silk fibers could be recycled into telecom cables. - The Global Climate Change Report for May 2026 has been released by NOAA’s National Centers for Environmental Information and reveals further proof that global climate change remains a concern. The May 2026 global surface temperature was the second highest in the 177-year record, at 1.07°C (1.93°F) above the 20th Century average. The month trailed only May 2024, which holds the record at 1.15°C (2.07°F). All 10 of the warmest Mays on record (1850–2026) have occurred since 2016. Notably, this month marked the 50th consecutive May with a global temperature departure above the 20th Century average. The last below-average May occurred half a century ago in 1976 (-0.17°C / -0.31°F). May 2026 was characterized by widespread warmth, driven largely by much-above-average global ocean temperatures. May marked the fourth consecutive month that global ocean surface temperatures ranked as the second highest on record. Averaging 0.95°C (1.71°F) above average, the May ocean temperature was only 0.01°C (0.02°F) away from tying the 2024 record, extending a 50-year streak of above average Mays. Over land, the global surface temperature was 1.34°C (2.41°F) above average, ranking as the fifth-warmest May on record.
- When the heat of summer arrives, people love to cool off with a sweet treat like an ice cream cone or a banana split. The third Sunday in July happens to be National Ice Cream Day, and July also serves as National Ice Cream Month, a tradition signed into law by U.S. President Ronald Reagan in 1984. This year, National Ice Cream Day falls on July 19. July also claims National Peach Ice Cream Day on July 17 and National Vanilla Ice Cream Day on July 23. Anyone wanting to learn more about ice cream can visit the Museum of Ice Cream. There are five locations for the Museum of Ice Cream – Boston, Chicago, Miami, New York City and Singapore. The museum is described as an “experium” where people can learn about ice cream’s history and explore ice cream-themed installations. GIS can help map out ice cream parlors near you so you can celebrate ice cream all-day every-day in July. Check out MapComplete’s ice cream map to find a sweet treat near you, or use ArcGIS to map out ice cream options in your area.
 In May of 2026, the Arctic recorded its second lowest sea ice extent in May, directly linked to the warmer than average May. South America experienced a warmer than average May, while North American reported its 10th warmest May on record. Europe had the ninth warmest May on record and an early season heat wave brought record high temps to France, Switzerland and the United Kingdom. Asia saw its fifth warmest May on record, including a dangerous and prolonged heat wave in many locations. Numerous heat-related fatalities were reported. Japan also endured its second warmest May on record, while Australia and Oceania also saw warmer than average May temperatures. (Image Credit: NOAA Global Climate Report)
Brock Adam McCarty
Map Wizard
(720) 470-7988
brock@apollomapping.com
In this monthly feature, we span the globe to examine Our Changing Landscape with a time series of medium-resolution PlanetScope satellite imagery. The PlanetScope constellation dates back to 2016 and collects hundreds of millions of square kilometers of four and eight-band 3-meter imagery daily! In June, we featured tragic Cyclone Ditwah that impacted Colombo, Sri Lanka. For the July edition of this series, we travel to Vulkan Krenityna in Sakhalin Oblast, Russia.
 Click on the image above to see an animation of 3-meter natural color PlanetScope image collected over Vulkan Krentitsyna on January 8, May 16, and August 16, 2024. This animation spans three seasons from a deep winter chill with snow on the ground in January. To a late spring May melt where you can see the frozen lake is breaking apart and the snow is melting on the peaks of the volcano. And finally, to summer in August where the landscape is covered with lush green vegetation. (Images Courtesy: © Planet 2026)
The PlanetScope Microsat Constellation
PlanetScope is a constellation of more than 240 microsats referred to individually as Doves. Each Dove is able to collect up to 20,000 square kilometers (sq km) per day of 3-meter (m) 4-band multispectral (i.e. blue, green, red and near-infrared [NIR]) imagery; and newly launched SuperDoves collect 8-band multispectral adding in valuable red-edge spectral data. Across the constellation, PlanetScope is archiving more than 200 million sq km of medium-resolution imagery a day, making it the go to source for daily imagery over most locations. This massive archive dates back to 2016, offering the most complete and continuous record of spatial data on the planet since the start of the constellation’s ongoing launch schedule. Collecting 3-meter multispectral imagery is the equivalent of ‘high-resolution’ multispectral data imaged by a 75-centimer (cm) satellite (as this satellite would feature 75-cm panchromatic and 3-m multispectral), making PlanetScope an extremely competitively priced option at just $2.25 per sq km. With well registered images and nearly daily collections of most locations, PlanetScope is the ideal imagery source for this current-events focused series, Our Changing Landscape.
Vulkan Krenityna Through The Seasons
The Krenitsyna Volcano sits on the southern side of Onekotan, which is part of the Kuril Islands that extend between the Kamchatka Peninsula in Russia and Hokkaido in Japan. Surrounded by the Kol’tsevoye Lake, the volcano stares at the rough terrain encircling it, which includes cliffs and mountains mixed with the coastline.
The crater-like depression in which the volcano sits is called Tsar-Rusyr. Calderas form when the ground collapses into a partially emptied magma chamber during a large eruption. This particular caldera is surrounded by steep 300-meter cliffs that cast shadows along the eastern interior of the volcano.
The caldera holds the blue waters of Kol’tsevoye Lake, which reaches depths of up to 370 meters (1,200 feet). This lake happens to be one of the deepest in Russia. The volcano, also called Krenitsyna Peak, stands approximately 1,300 meters above sea level. The last eruption happened in November 1952 and was categorized as moderate.
If you would like to find out more about using 3-meter PlanetScope imagery for your academic studies, engineering projects or any landscape analysis, let us know at sales@apollomapping.com or (303) 993-3863.