
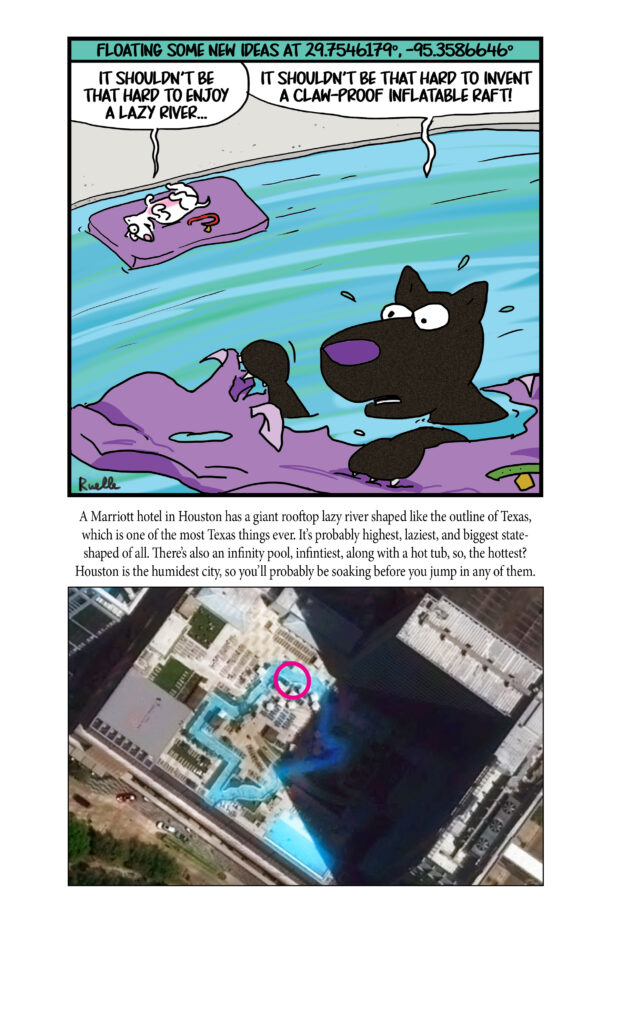
Cricket’s Chirp is created for Apollo Mapping by Ron Ruelle, a Northwest Ohio (formerly Boulder, CO) based cartoonist, lllustrator and teacher. No animals are harmed in the creation of these comics, but Ron sometimes breaks a pencil in frustration. He has a new collection of his weekly Skelton Comics available at www.ronruelle.com
- For this month’s technology review, we cover a wide variety of topics including new ways to (possibly) detect alien life, enjoy!
This material can control where it emits heat.
A new way to detect possible alien life.
Researchers recreate stellar carbon building blocks using lab-grown space dust.
A new way to revive old antibiotics.
A lightweight alloy for more fuel-efficient trucks.
Naturally occurring weight-loss drug discovered.
Dreams are not random as our experiences shape them.
A plant-based way to dress wounds.
Evolution often converges using different paths.
Healthier French fries with microwave-assisted frying.
Plant-based plastic inspired by silk.
This yarn is elastic and recyclable.
From plastic waste to hydrogen fuel and sequestered carbon.
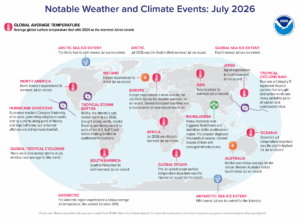 Hurricane Genevieve reached Category 5 intensity at its peak in July, causing dangerous swells and rip currents to form along parts of Mexico and Baja California, but didn’t make landfall. Rainfall was below average in Australia, and western Australia recorded its fourth driest July on record. Heavy monsoon rains in Bangladesh triggered flash flooding and landslides in the southeastern region. The storms displaced thousands of people, killed dozens more and damaged infrastructure. Africa endured the hottest July on record in 2026, as did Asia, while Ireland experienced its driest July on record. (Image Credit: NOAA Global Climate Report)
- The Global Climate Change Report for July 2026 has been released by NOAA’s National Centers for Environmental Information and reveals further proof that global climate change remains a life-or-death concern. In July 2026, the global surface temperature was 1.18°C (2.12°F) above the 20th Century average, tying with 2024 as the warmest July since global recordkeeping began in 1850. The 10 warmest Julys on record have all occurred since 2016, with the past four years (2023–2026) taking the top four spots. Only three Julys – 2023, 2024, and 2026 – have experienced temperature departures exceeding the 1.0°C (1.8°F) threshold. This month also marked the 55th consecutive July with above-average temperatures; the last below-average July temperature occurred in 1971 (-0.04°C / -0.07°F). Climatologically, July is the warmest month of the year. Since July 2026 tied as the warmest July on record, July 2026 and 2024 are also the warmest months on record for the globe since 1850. Global ocean temperatures reached a record high in July averaging 1.02°C (1.84°F) above normal. This edged out the previous July record set in 2023 by 0.03°C (0.05°F). The past four Julys (2023 – 2026) are the four warmest Julys on record, with 2026 marking the first July to surpass +1.0°C (+1.8°F). Across all months since records began in January 1850, July 2026 tied with August and September 2023 as the third highest monthly temperature departure on record. It trailed the tied recordholders of January and February 2024 by just 0.01°C (0.02°F). Notably, all of these top-ranking months occurred during El Niño episodes, which we are currently experiencing as we draft this article.
- Everyone knows Labor Day falls in September, but another important holiday that claims a spot on the September calendar happens to be Grandparents Day. This holiday, which falls on the first Sunday after Labor Day, recognizes grandparents and the bond between them and their grandchildren. In fact, the official flower for Grandparents Day is the forget-me-not. One fun way to celebrate Grandparents Day is by learning more about ancestors. Every 10 years, as directed by the Constitution, the U.S. government must count every person living in the country with the Census. Thanks to Story Maps ARC GIS, grandkids can learn more about those who came before them. They can use Ancestry Classroom’s 1950 Census Search to find a relative, noting “Home in 1950,” street name and house number. Submit as much data about the relative as possible. This includes data from the home in 1950, street name, house number and occupation fields in the census record. Submit the data in the form below to compare with others. The results are shown in the form of charts, graphs or maps. The creators of the system state that the instructional activity is best used by middle school or high school students. People also can add their own family history information to map and create digitized historical maps and other tools to analyze their own family history information in a geographic context.
Brock Adam McCarty
Map Wizard
(720) 470-7988
brock@apollomapping.com
In August, we looked at Hallgrimskirkja in Reykjavik, Iceland. This month for the Pléiades 1 – Pléiades Neo Point of Interest, we check out Janaki Mandir in Nepal.
Do you enjoy the high-resolution satellite imagery we post monthly in this article and elsewhere in The Geospatial Times? If so, head over to our Reddit subgroup, HighResSatelliteImage, where we post some our favorite high-resolution satellite images on a weekly basis.


These two satellite images show an aerial view of Janaki Mandir in Napal. You can see the rectangular outer building of the temple and the inner section of the temple in the courtyard in the 30-cm Pléiades Neo 4 enhanced color image taken November 29, 2025. It dominates the neighborhood and shows small dots of people visiting the temple, which is also captured in the Pléiades 1B 50-cm color enhanced image taken February 23, 2024. PLEIADES © CNES 2026, Distribution Airbus DS.
About the Point of Interest: Janaki Mandir in Nepal happens to be an enormous white temple that honors the birthplace of a Hindu goddess. Located in the center of Janakpur, the building marks the spot where Sita, also known as Janaki or Maithili, was born. In addition to its more than 60 rooms, the temple contains several shrines where followers can pray, reflect, or join in daily ceremonies. The focal point is a Sita statue festooned with flowers, which legend says was found in the Saryu River near where Rama was born. The complex also contains a small museum displaying dioramas of important events in Sita’s life, as well as prime examples of Mithila art.
Fun Factoids: (1) According to ancient myth, King Janaka found the baby Sita alone in a field, presumably the daughter of the earth goddess Bhumi. Raised as his own, Sita later became the wife of Lord Rama (an avatar of Vishnu), and her story is chronicled in the Hindu holy book Ramayama, inevitably making her temple an important pilgrimage site. (2) The temple itself is notable for serving as an architectural amalgam of Hindu, Nepali, Koiri, and Mughal styles. Whereas most Nepali temples are built in the familiar wood and brick pagoda style, Janaki Mandir is built of stone and marble. (3) At nearly 1,500 square meters (16,000 square feet) it is also considerably larger than the average temple. (4) The temple is a centerpiece during major festivals, but it is also known for its annual reenactment of the marriage of Sita and Rama. As such, it is a popular honeymoon destination for newlyweds too. (5) Every year, thousands of pilgrims from Nepal, India, Sri Lanka, and other countries visit Ram Janaki Temple to worship Lord Ram and Sita. Many worshippers visit the temple during the festivals of Ram Nawami, Vivaha Panchami, Dashain, and Tihar. (6) In the southwest corner of Janaki Mandir is the Vivah Mandap, which has been built at the site where the marriage of Ram and Sita is said to have taken place. Another well-known temple in the vicinity is Ram Mandir, built in pagoda style, and hence is different from the other temples in Janakpur which generally bear resemblance to Mughal architecture. It houses a female statue, said to be of Yogamaya, which has the reputation of being one of the most beautiful images of female forms in Nepal. Other holy sites of interest include the Laxman Temple, Sankat Mochan Temple and Hanuman Temple.
The 50-cm Pléiades 1 High-Resolution Satellite Constellation
The Pléiades 1 constellation (or at least part of it!) has been in orbit since December 2011 and if you have not had a chance to check out any sample imagery, take a few moments and have a look at the gallery on our website. If you work with high-resolution imagery, you should consider Pléiades 1 and Pléiades Neo for your next geospatial projects.
A variety of Pléiades 1 products are available from both a well-established archive and as a new collection, including 50-centimeter (cm) pansharpened imagery and 50-cm panchromatic – 2-meter (m) 4-band multispectral bundles. We are happy to discuss the technical specifications, pricing and tasking options available with both of these satellite constellations.
The 30-cm Pléiades Neo High-Resolution Satellite Constellation
Pléiades Neo is our newest high-resolution satellite constellation. The first Neo satellite went up in April 2021 and the second in August of the same year. This 30-centimeter resolution constellation will add two more satellites in the next few months and upgrade from daily to intraday revisits. Pléiades Neo has six multispectral bands with 1.2-meter resolution, including a deep blue and two infrared bands, along with a 30-centimeter resolution panchromatic band.
The archive is growing every day, and the satellites are available for new collections, making Pléiades Neo the perfect solution for site monitoring. Check out our beautiful sample images in the Pléiades Neo gallery.
More sample images and technical information about Pléiades 1 can be found on our website here; while the same can be found here for the Pléiades Neo constellation.
The Apollo Mapping sales team can answer any questions you might have about Pléiades 1 and/or Pléiades Neo. We can be reached at (303) 993-3863 or sales@apollomapping.com.
In this monthly feature, we span the globe to examine Our Changing Landscape with a time series of medium-resolution PlanetScope satellite imagery. The PlanetScope constellation dates back to 2016 and collects hundreds of millions of square kilometers of four and eight-band 3-meter imagery daily! In August, we indulged in the beautiful bluebonnets’ blooming in Brenham, Texas. For the September edition of this series, we travel to Gressan, Italy and Stage 14 of the Giro d’Itaia.
Do you enjoy the high-resolution satellite imagery we post monthly in this article and elsewhere in The Geospatial Times? If so, head over to our Reddit subgroup, HighResSatelliteImage, where we post some our favorite high-resolution satellite images on a weekly basis.
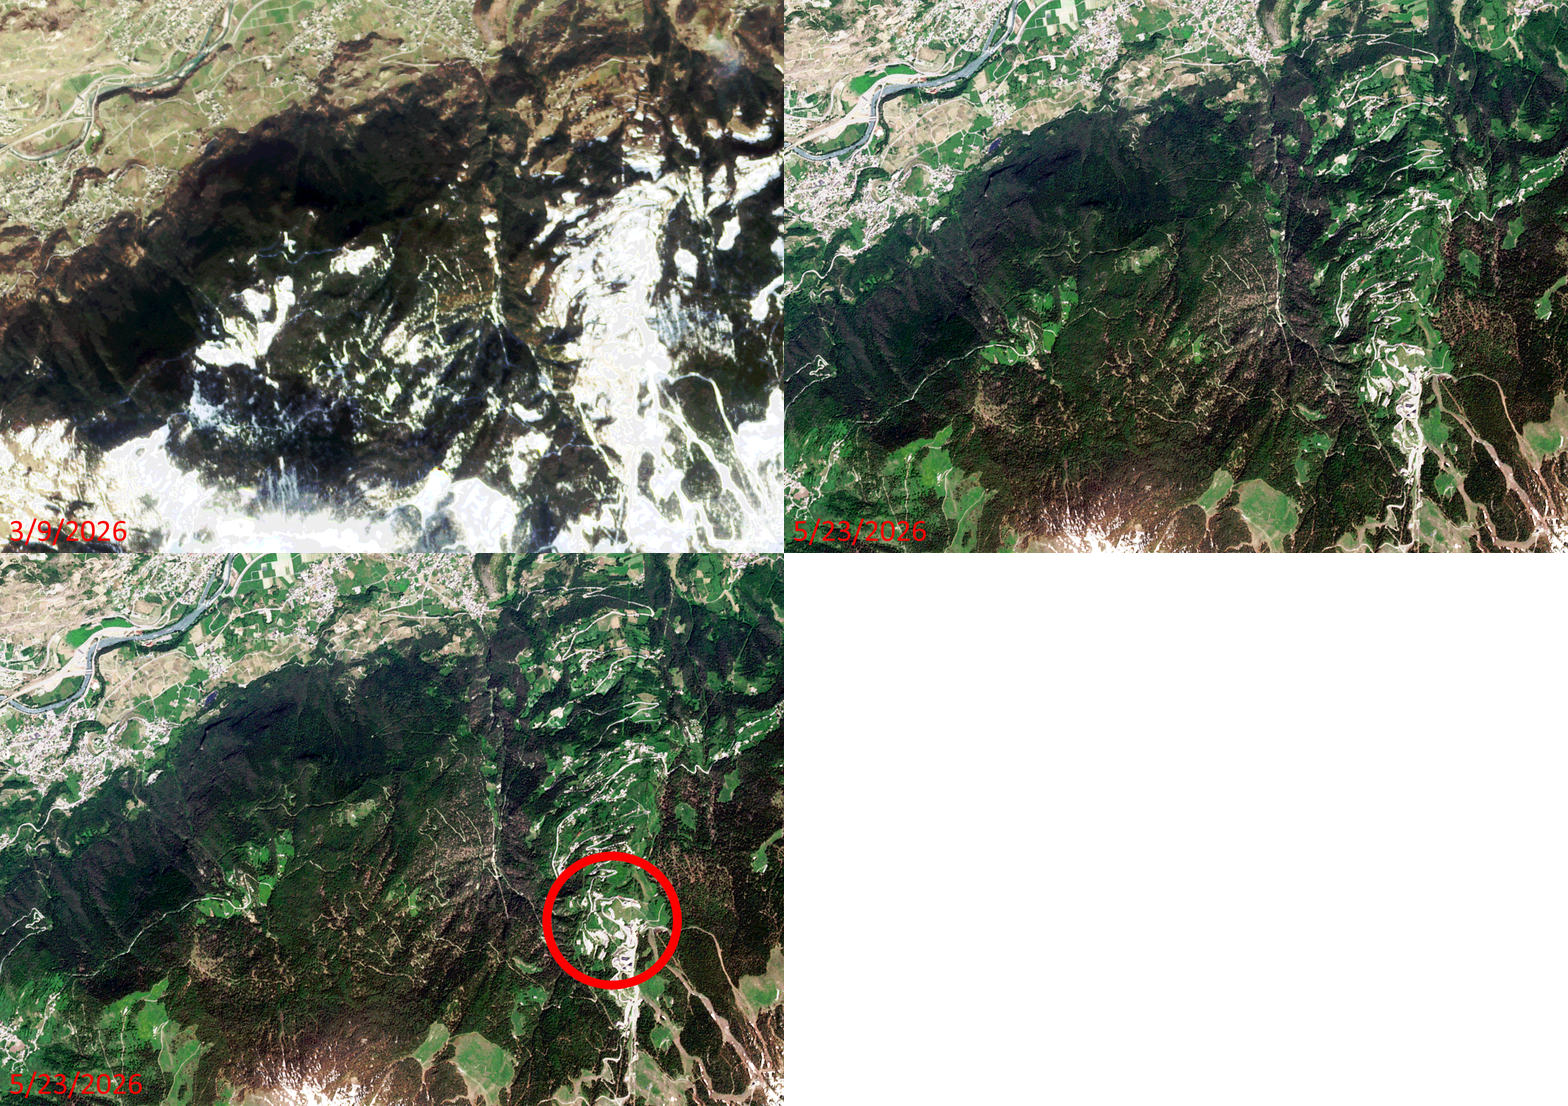 Click on the image above to see an animation of 3-meter natural color PlanetScope image collected over the Gressan, Italy region on March 9 and May 23, 2026. In this animation, you can see how much snow melted in the Alps here when spring arrived and the temperatures started to climb. You can also see how much greenery springs back to life once the rains arrive and the snow melts. But equally as ‘important’ is the circled area in the May 23rd image which is where Stage 14 of the Giro d’Italia came to an end with Jonas Vingeaard riding solo up the summit of Pila where he beat runner-up Felix Gall by 49 seconds. (Images Courtesy: © Planet 2026)
The PlanetScope Microsat Constellation
PlanetScope is a constellation of more than 240 microsats referred to individually as Doves. Each Dove is able to collect up to 20,000 square kilometers (sq km) per day of 3-meter (m) 4-band multispectral (i.e. blue, green, red and near-infrared [NIR]) imagery; and newly launched SuperDoves collect 8-band multispectral adding in valuable red-edge spectral data. Across the constellation, PlanetScope is archiving more than 200 million sq km of medium-resolution imagery a day, making it the go to source for daily imagery over most locations. This massive archive dates back to 2016, offering the most complete and continuous record of spatial data on the planet since the start of the constellation’s ongoing launch schedule. Collecting 3-meter multispectral imagery is the equivalent of ‘high-resolution’ multispectral data imaged by a 75-centimer (cm) satellite (as this satellite would feature 75-cm panchromatic and 3-m multispectral), making PlanetScope an extremely competitively priced option at just $2.25 per sq km. With well registered images and nearly daily collections of most locations, PlanetScope is the ideal imagery source for this current-events focused series, Our Changing Landscape.
Gressan, Italy and the Giro d’Italia
Gressan is a picturesque town situated in Italy’s northwestern Aosta Valley. Located just 5 km from Aosta, it serves as a spectacular alpine base, seamlessly blending serene nature in the valley with world-class skiing and hiking at the neighboring mountain resort of Pila.
The top attractions in Greesan include the Pila Ski Resort, which offers downhill skiing, snowboarding, and a fun park in the winter. There’s also Chamole Lake, a pristine alpine lake perfect for summer hiking and nature viewing. Gressan Green Area happens to be a sprawling park based at the foot of the town that features cycling paths and scenic walking trails.
Gressan also happens to be a stop along the Giro d’Italia, a prestigious pro cycling Grand Tour race. The 109th edition of the race ran May 8 to May 31 this year. Stage 14 of the race rode through Gressan ending on the slopes of Pila, a local ski resort.
If you would like to find out more about using 3-meter PlanetScope imagery for your academic studies, engineering projects or any landscape analysis, let us know at sales@apollomapping.com or (303) 993-3863.
Are you assessing land use cover over a large region?
Perhaps you are looking to improve the results of your automated classifications?
Or maybe you have another spectral analytic technique in mind for that next mapping project?
 A 10-m OHS image of Extremadura, Spain collected on July 15, 2018. This image uses bands 12 – 8 – 4 (i.e. red – green – blue) to create a natural color view of the landscape, and has been processed by Apollo Mapping for improved clarity and colors. (Image Credit: Orbita)
If ‘yes’ is the answer to any of these questions, then 32-band 10-meter OHS hyperspectral imagery is the data for you!
Orbita Hyperspectral Satellite (OHS) collects hyperspectral imagery at 10-meter resolution in the 400-nanometer (nm) to 1,000-nm (from blue to near-infrared) spectral range. OHS is one of the few commercial satellite constellations offering hyperspectral imagery, setting these microsats apart from their competitors. OHS’ large, 150-kilometer footprint and 32 spectral bands open access to new avenues for mapping land use change along with disaster relief, spectral analysis, assessing plant health and so much more!
Orbita is continuously adding to their constellation of microsats, accruing a cache of archive imagery. With eight OHS satellites currently in orbit, each collecting up to 5,000,000 square kilometers a day, Orbita’s archive is ever-expanding.
Here is a quick summary of OHS’ specifications:
- Resolution: 10-meter
- Footprint width: up to 150-kilometers (3 individual scans, each about 50-km wide)
- Spectral band: 32-bands from 400-nm to 1,000-nm, download detailed band information here
- Daily collection capability per satellite: 5,000,000 square kilometers
For more detailed OHS specifications and full resolution samples, you can refer to our website here! And you can search for OHS coverage 24-hours a day by using Image Hunter. If you have any pricing requests, additional questions or would like a new price list with OHS data added in, send us an email at sales@apollomapping.com!
We love maps.
We love imagery.
We love work breaks.
We hope you like them as well!

The 2023 U.S. Open Quarterfinals at the USTA Billie Jean King National Tennis Center in New York City featured thrilling matchups that set the stage for a historic tournament. Novak Djokovic defeated Taylor Fritz (6-1, 6-4, 6-4) on the men’s side, while Ben Shelton defeated Frances Tiafoe, Carlos Alcaraz defeated Alexander Zverev, and Daniil Medvedev defeated Andrey Rublev.
For the women’s singles quarterfinals, Coco Gauff defeated Jeļena Ostapenko, Karolína Muchová beat Sorana Cîrstea (6-0, 6-3), Aryna Sabalenka defeated Zheng Qinwen, and Madison Keys defeated Markéta Vondroušová (6-1, 6-4).
The 2023 U.S. Open was the 143rd edition of tennis‘ U.S. Open and the fourth and final Grand Slam event of the year. Carlos Alcaraz and Iga Świątek were the men’s and women’s singles defending champions.
Gauff, an American, won her first major singles title and Djokovic claimed a record-extending 24th Grand Slam at the 2023 U.S. Open tennis tournament.
For this month’s Imagery Work Break, we feature a 30-centimeter Pléiades Neo 3 color enhanced satellite image taken September 5, 2023 – which also happens to be the same day of the US Open Men’s and Women’s Quarterfinals!
Do you enjoy the high-resolution satellite imagery we post monthly in this article and elsewhere in The Geospatial Times? If so, head over to our Reddit subgroup, HighResSatelliteImage, where we post some our favorite high-resolution satellite images on a weekly basis.
Have a great rest of your workday! 😊
(Image Courtesy: Airbus Defense and Space. Processed by Apollo Mapping for improved color accuracy and clarity.)

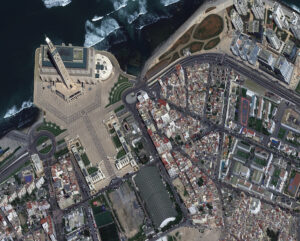
This month we feature our first oblique bird’s eye view satellite images from Pléiades Neo 4! These high-off nadir images were collected over Casablanca, Morocco on April 1, 2026, and have a native resolution of about 52-centimeters. We love the gorgeous minaret from the Hassan II Mosque! (Satellite Imagery © 2026 Airbus Space & Defense)
Each month, we feature a new bird’s eye view satellite image from a select location around the globe; and for this month, we head to Casablanca, Morrocco.
What Is Bird’s Eye View Satellite Imagery?
Well, that’s a good question we are happy to answer! When a satellite images the ground below it, there’s always some tilt to the camera as it looks down. This tilt is called off-nadir and is measured in degrees from 0; and so, it follows that 0° off-nadir means that the satellite is pointing directly down at the ground when it images, while a 90° off-nadir would mean that the satellite is pointing to the side and not even at the ground below it when it images. The vast majority of satellite imagery is collected with an off-nadir below 30°. However, in rare occasions, be it by a customer request, or to capture a natural disaster or other important event, a satellite can tilt and image in the range of 35° to 50° which we consider ideal for a high off-nadir imagery, also called bird’s eye view imagery and oblique imagery. These bird’s eye view images lend a unique perspective to satellite imagery that is an expansive view of the landscape from the side. We hope you enjoy the bird’s eye view satellite imagery that we share in this article. And if you have any questions about this type of data or any of the imagery products we can help you with, send us an email at any time to sales@apollomapping.com!
Want To See More Bird’s Eye View Satellite Imagery Than What is Featured Here?
If you are interested in additional bird’s eye view satellite images from this location, head over to our Reddit subgroup, BirdsEyeViewImagery, and become a member. We post high off-nadir satellite imagery every Friday in the BirdsEyeViewImagery subgroup – most of which is not posted here.
If you’ve been reading along with me, you’ll notice that interesting scientific research intrigues me, especially the ones that connect humans to animals and landscapes. How we connect and communicate is a foundation of spatial awareness, thinking, and analysis.
How long has that been part of our humanity? I recommend checking out the movie, In the Blink of an Eye. The film illustrates an undeniable thread that knits humanity across millennia. (If you take the leap to watch it, follow the acorn.) Filmmakers also show us more community and creativity than has been popular lore regarding early humanity. Afdhel Aziz in Forbes interviewed Ian Goldman, the film’s producer and passionate storyteller, in early 2026. What struck me is the need for the right question in good storytelling. For the movie, the question was “How can you be a good ancestor?” That matters in map making and data collection too. Why are we doing this? What’s the purpose?
Let’s take an example from 60,000 years ago. I was taught that those human ancestors were “simple minded.” Turns out that is not true! Researchers at the University of Bologna found clear evidence of planned spatial patterns on carved ostrich eggs. While the eggs were probably used as containers, the real revelation is the art on them. Science Daily says, “The results showed consistent spatial patterns in over 80% of configurations, including repeated near-90° angles, parallel lines, hatched bands, grids, diamond motifs, and signs of rotation, translation, repetition, and embedded hierarchical designs. The researchers emphasize that the importance of the engravings goes beyond whatever meaning the individual markings may once have carried. Their broader significance lies in the mental abilities required to create visual designs according to consistent rules.” Their analysis shows how homo sapiens tens of thousands of years ago had, “a remarkable ability to organize visual space according to abstract principles.” They were not so simple minded after all.
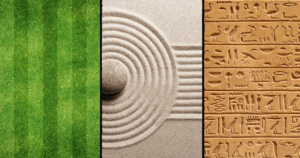 Created in canva by BD.
For the math haters out there, guess what? Geometry matters here. Repeating patterns in particular, “help students recognize regularities, predict what comes next, and understand more complex patterns such as arithmetic sequences and geometric shapes,” according to Meaningful Math. What comes next and noticing irregularities are important general life skills if you want to drive to the store and then pick out the ripest apple. Maybe you’re looking for your friend in a red-striped shirt in a sea of concert goers.
Geometry became language too. Examining Greek and Celtic shapes are collections of basic lines that became language and art. René Descartes said, “We could never know the geometric triangle through the one we see traced on paper, if our mind had not had the idea of it elsewhere.” We are hard-wired to process patterns to understand other concepts.
Patterns also have psychology. By understanding the psychology of visual art and patterns, artists can use repetition in graphic design and fine art to create compelling works that evoke strong viewer responses. We are naturally drawn to repeat patterns. Consider a Zen Garden that’s intended for meditation and contemplation. Every plant, rock, and line in the sand are there to create harmony, tranquility, and balance. Even those tiny desktop versions give you the opportunity to rake the sand in repeating patterns to ease your stress.
How many other hobbies or modern crafts use the same principles of repeating patterns and simplicity to ease our minds and bring joy? Crochet, knitting, quilting, carpentry, needlepoint, cross-stitch, swimming, running, we could go on. It just might be the simple repeating patterns in our lives that fuel our analysis and problem-solving abilities. I’m not an expert, but it makes sense to me.
If you need me, I’ll be out making repeat patterns in the yard with my lawn mower.
Barbaree Duke
Geospatial Crusader