
Do you have an area of interest that requires regularly updated imagery but you do not have time to check daily for this data?
Or perhaps you have a remote location that needs updated imagery but you cannot afford a new collection?
If either of these questions ring true, then you need to check our new Data Alert service on Image Hunter!

Data Alert lets you define an area of interest anywhere around the globe, the resolution your project requires and the number of months we should keep the alert active. Once this is set up, we check for new data over your area of interest every single day, and send you an email alert when we find coverage that meets your specifications.
We have a short YouTube video with directions to set up a Data Alert, check out the second video. We also have written directions for Data Alert here.
It’s that easy to find the data you need for all of your key projects.
If you would like to check out Data Alert, send us an email at sales@apollomapping.com or visit Image Hunter and click on the bell icon in the header to get started using this great service!
Have you checked out the new and improved Image Hunter yet?!?! If not, you should!
Listening to the feedback we received on improving imagery search engines, the new version of Image Hunter features a major overhaul to the user interface as well as to the backend architecture. Image Hunter Version 2 is built on open-source technology so now it works on all computers, not just on Windows machines. We slimmed down the user interface to make it easier to find the imagery filters and other available tools. All things said, we really think you will enjoy your browsing experience with Image Hunter (Version 2).
Key January 2016 Improvements
During January, we fixed several bugs related to the changeover from 2015 to 2016. We are also back to working on hourly updates through a REST API for WorldView, GeoEye-1, SPOT 6/7, Pléiades 1, KOMPSAT 2 and KOMPSAT 3 data. We are hoping to have several of these hourly updates in place before the next newsletter launches! After we get these hourly updates in place, we will pivot back to adding new features to the industry’s best imagery search engine, Image Hunter.
The future is now! We launched our highly anticipated Data Alert service in mid-July and it’s a hit! Data Alert lets you define an area of interest anywhere around the globe, the resolution your project requires and the number of months we should keep the alert active. Once this is set up, we check for new data over your area of interest every single day, and send you an email alert when we find coverage that meets your specifications. We have a short YouTube video with directions to set up a Data Alert, check out the second video. And we have written directions for Data Alert here.
Image Hunter can be accessed 24 hours a day, 7 days a week and is a one-stop shop for every major source of medium and high-resolution satellite imagery on the market today, including:
- WorldView-3
- WorldView-2
- WorldView-1
- QuickBird
- GeoEye-1
- IKONOS
- EROS B
- KOMPSAT-3
- KOMPSAT-2
- The Pléiades 1 constellation
- The entire SPOT constellation
- RapidEye
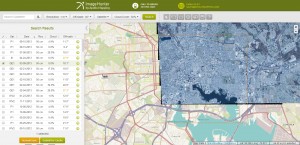
If any of our readers have struggled with other geospatial search engines that are clunky, only query one data source and/or do not provide image previews, then Image Hunter is the solution to your woes, as it features:
- Online browsing of satellite imagery from 4 data providers and 19 satellites.
- Near-instantaneous loading of low resolution preview imagery with collection date, cloud cover and other key metadata.
- The ability to define your area of interest by address and with coordinates, geometric shape or shapefile/KMZ.
- A responsive basemap with street names to provide spatial context when discovering data as well as crowd-sourced updates for the most accurate map possible.
- Exports of the area of interest you create as well as the scenes you select in shapefile or KMZ format.
- Support for all operating systems, and not just our friends with Windows machines!
The new version of Image Hunter can be accessed here. We are excited to find out what you think about Version 2!
If you have any ideas and/or feedback to improve the new Image Hunter, please let us know at sales@apollomapping.com or (303) 993-3863.
In this monthly feature, we span the globe to examine Our Changing Landscape with time series of medium resolution RapidEye satellite imagery. The RapidEye archive dates back to late 2008 and contains more than 7 billion square kilometers of data. For February, we travel around the world from the Kemper County Energy Project to one of the world’s newest mega-airports, Hamad International Airport, in Doha, Qatar.
The RapidEye Constellation
RapidEye is a constellation of five 5-meter medium resolution satellites each offering five spectral bands of information. The RapidEye constellation offers daily revisits to every location on the planet with a huge footprint that is 77-km wide. The data is priced competitively with a starting cost of $1.28 per square kilometer for all five spectral bands–academics do receive discounts. RapidEye adds a fifth band, the red edge, to the ‘traditional’ multispectral set of blue, green, red and near-infrared (NIR). The additional spectral data in the red edge band allows users to extract more useful land ‘information’ than can be from traditional 4-band imagery sources. When RapidEye imagery is ordered as a Level 3A Orthorectified product, images from multiple dates are extremely well registered, making it the ideal data source for Our Changing Landscape.
Hamad International Airport
 Click on the image above to see an animation of 5-meter natural color RapidEye imagery collected over Hamad International Airport in Qatar on December 14, 2009, December 26, 2011, December 4, 2013 and April 4, 2015. In this animation you will see significant changes in the airport’s infrastructure, particular with regards to the runways and the buildings at the north end of the facility. You can also see how much refuse was removed from the site of Hamad International Airport to the west. (Images Courtesy: BlackBridge)
Qatar is one of the richest nations in the world with a per capita gross domestic product (GDP) exceeding $100,000–depending on the source you look at. With all of this wealth comes plans to modernize a nation, and so in 2003 plans commenced to replace the 4.2-million passenger per year Doha International Airport. In 2004, the engineering firm, Bechtel Group Inc., was selected to design the new airport, Hamad International Airport (HIA), as well as manage its construction. Originally scheduled to open in 2008 (some sources say 2009), the airport was delayed some eight years, opening its doors on April 30, 2014 after ~$18 billion was spent on its construction.
All of the reviews of HIA suggest it is one of the most technologically-modern and architecturally-inspiring airports in the world, and here are some statistics that will impress you the most:
- The 33 gates (some sources say 40 or 41 gates) at HIA can handle 30 million (some sources say 24 million) passengers a year or more than 7 times the capacity of the old Doha International Airport.
- HIA is being built just four miles from Doha International Airport on a 5,400-acres (about 22 square kilometers) site which is two-thirds the size of Doha and 12 times larger than the old airport. 60% of HIA (or 2.2 billion cubic feet) was built on land reclaimed from the Arabian Gulf. The project also required the cleanup of a landfill where 230 million cubic feet of debris was removed.
- There are two parallel runways at HIA, the first is 15,910 feet (ft) x 200 ft (one of the longest in Asia) and the second is 13,940 ft x 200 ft.
- The onsite 740,000 sq ft catering facility serves 90,000 meals per day.
- The airport control tower is 280 ft tall with a 5.5 million sq ft passenger terminal.
- HIA features more than 70 stores, 30 restaurants, 200 hotel rooms, 16 lounges and even 2 squash courts.
- The fully automated baggage handling system can handle 19,500 bags per hour!
As large as HIA is, Qatar is already planning a major $8 billion expansion of the airport scheduled for completion in 2020. The expanded airport is expected to handle 50 million passengers per year and will double both the number of gates and terminal area. There are also plans for a 100-room five star hotel. Now that you have a sense of the scale of this project, it is time to check out the 5-meter RapidEye images here that track its progress from 2009 to 2015.
If you would like to find out more about using RapidEye for your academic studies, engineering projects or any landscape analysis, let us know at sales@apollomapping.com or (303) 993-3863.


 Barcelona is beautiful! So this month I had to feature five images from the iconic Spanish city. Each of these images showcases the superior colors and clarity offered in 30-cm WorldView-3 data. This data was collected over downtown Barcelona on October 23, 2015. (Image Courtesy: DigitalGlobe)
Every time we look at WorldView-3 (WV3) imagery, we are blown away. And we hope you are equally impressed with the data! From our second island nation in a row, we travel north to Barcelona, Spain for the February WV3 Image of the Month.
WorldView-3 was launched in late 2014 and it is the most advanced satellite the commercial marketplace has ever had access to. Here are a few of the features that really set it apart from the competition:
- Improved Resolution
- Higher resolution means you can see more detail in WV3 imagery.
- Data collected at nadir will have 31-centimeter (cm) panchromatic, 1.24-meter (m) visible and near infrared, 3.7-m shortwave infrared (SWIR) and 30-m CAVIS bands.
- At 20 degrees off-nadir, the resolution is 34-cm panchromatic, 1.38-m visible and near infrared and 4.1-m shortwave infrared.
- Per US government regulation, all SWIR orders are produced at a maximum resolution of 7.5-m. CAVIS bands are not available for purchase at this time.
- Additional Spectral Bands
- If spectral analysis is part of your project, then no other satellite can match WV3 with its: 8 bands of visible and near-infrared data; and 8 shortwave infrared bands which are crucial for geological studies.
- Better Positional Accuracy
- With accuracies of 3.5-m CE90% or better (without ground control even!), WV3 has no rivals for its enhanced positional accuracy.
- Daily Revisits
- At 40 degrees latitude, WV3 will be able to image each location daily with 1-meter or better resolution and then every 4.5 days at 34-cm resolution or better.
- Increased Collection Capacity
- WV3 features a 13.1-km swath width (at nadir) with the ability to collect up to 680,000 square kilometer (sq km) of high-resolution data per day.
- Improved control movement gyros translate into larger maximum contiguous collection areas per pass, with up to ~7,500 sq km of mono imagery and ~3,000 sq km of stereo possible.
If you are interested in WorldView-3 imagery for your next project, please let us know by phone, 303-993-3863, or by email, sales@apollomapping.com.
You can also find more samples and technical information on our website here.
I’ve often wondered about how music comes to be so important for some people. I’m one of those people who has fallen in love with multiple bands over my lifetime, in many cases following those bands around the country to see them perform. This surprises some people. For some, it is unfathomable how a band and its music can mean so much. My mom was at my place a few years ago and I was listening to a James McMurtry album; and she said she really liked it, so I burned her a copy. Then I told her that he would be playing in my folks’ hometown and she should go. She replied, “Why? I already have the CD.” My mom didn’t get it. And I guess, I wondered, if she didn’t really get me. I’m not sure how many concerts I’ve been to in my life. If I had to guess I would say it is well north of 500, but I would never be able to give much more of a precise answer than that. There are some bands I’ve seen 10-20 times, some I’ve seen 40-50 times, and one band I’ve seen probably close to 150 times. This essay is about that band, and we’ll get to them soon. First, a little background.
It would seem ironic that after what I just told you that my mom actually played a big role in my love of music. I remember on the weekends around the house the radio was always on. Reruns (or maybe they were current, it’s been too long to recall) of Casey Kasem’s Coast to Coast Top 40 or Dick Clark’s Rock, Roll and Remember were the constant background to the weekend mornings. My folks also used to take me to see a local oldies’ cover band called Captain Rat & the Blind Rivets frequently. My first “real” concert was the original lineup (minus Dennis Wilson) of The Beach Boys in 1986. They remain to this day one of my favorites, a band whose music always invokes nostalgia. This was further cemented when I lived in SoCal and would hang out at Big Belly Deli eating pizza and drinking beer, watching the surfers on Huntington Beach. Their jukebox had multiple Beach Boys albums and I would always play Endless Summer in its entirety. In 2014 I got to see the current version of The Beach Boys (well, only two original members and no Brian Wilson) with my folks; it was nostalgic, anticlimactic, bittersweet and fun all rolled into one.
I developed my own taste for music pretty early on, buying cassette singles and before that, 45s, whenever I could scrounge up the money to do so. The walls in my bedroom often were coated with band posters, and until recently when my parents decided to repaint the whole house thus de-conserving my room as it had been left after high school when I moved out for college, posters of Nine Inch Nails, Guns n’ Roses, Weezer, Liz Phair, Bone Thugs-n-Harmony and Sonic Youth lined my walls. In high school I always had two overflowing CD booklets of all the music I could consume on my too-loud car stereo. When I went to college, my love of music continued to grow, and it was accompanied by the desire to see live music often, and quickly, to follow bands around. Thankfully I didn’t have much of an expendable income otherwise I likely would have dropped out of college and lived on the road with Phish for several years. Phish was not the first band I truly loved (that would be Guns n’ Roses), but it was the first band to consume me. I thought my identity was somewhere inside that travelling carnival of fans. The hippie ethos that may have not really ever existed was, to me, embedded in that band, its music and its dirty hippie fanbase. I jumped in head first, but reflectively I wonder if I ever really bought in entirely. I think I liked the escape and the alignment with something off the grid. I’ve always gone against the current, so in this was an association that was very apropos.
But as the years rolled by, I soon left Phish in the past. They’re still important to me because of the role they played in a crucial period of personal growth and development, but I rarely listen to their music anymore. I still may see them once a year these days, but I typically leave during the encore to beat the rush. I’ve grown old. Or maybe they just simply don’t capture my heart anymore. And that, dear readers, is the thesis of this essay: being in a relationship with a band.
 Rock will set you free. Long live Jerry Joseph & the Jackmormons!
I first discovered Jerry Joseph & the Jackmormons in 2002. They were playing the side stage at a Widespread Panic concert, and out of curiosity I wandered over to check it out. I was instantly captivated. They came through Boulder about a month later and I was sure to be there. I thoroughly enjoyed myself. I bought a CD. I looked forward to the next time I would see them. But for whatever reason, I only saw them 2-3 times over the next four years. I don’t know why. Reflectively, I wish I’d made more effort to see them; that was their heyday. But for whatever reason in 2006 I saw them a couple times and then bought all of their studio albums that I didn’t have that summer. Their studio work is polished and slow for the most part, antithetical and non-representative of their live performances. They are truly a band you have to see live, and slowly but surely, I began to seek them out and see them as often as I could. With that came the meeting of other fans, those who also felt a significant draw to the band, and this made it more fun to be involved. The fan community coupled with the sincere love of the music made for a lot of fun times.
The lyrics began to seem to apply to my life, I began to feel as if there was some cosmic connection between the music and myself. I wanted to be more and more involved. It had captivated me. Whatever Jerry Joseph & the Jackmormons was, so was I. And this feeling built over time. It truly did come to resemble a human-to-human relationship, a symbiotic one where I needed the music as much as it needed me. This lasted for quite some time. Years. Until it didn’t. To borrow from the original musical love of my life (GNR), “Nothing lasts forever, not even cold November rain.” Band lineup changes, a move from the classic canon and an embracing of slower, more melodic music chafed my connection. It wasn’t “electric” the way it once was. Through this transition members of the fan community dropped out for similar (or other) reasons, and the party that I hoped would never end kind of did in some regards. Or at least so I thought.
While the amount of times I saw the band dropped from 20-25 times a year to around 10 (which is still a lot by most standards), there were just some shows that were so chocked full of predictability and new music that I felt I wasn’t getting what I originally set out for. I wasn’t getting the love from my partner any longer. We were growing apart, so it seemed. I didn’t stop going to shows though, I just stopped traveling as far as I used to see them. But then inevitably, like any relationship that won’t die, the band pulled out all its old stops. The songs that caused that uncontrollable smile to break across my face incited that feeling again. The new stuff I thought I didn’t care for became more intriguing. And while some fans had left the fold, those that stuck it out were rewarded as well. At the time of writing, the band is on day three of a four-day run over the New Year’s holiday. The shows so far have been great, and I can’t wait for what’s to come. I still love the band and its music. We’ve grown together, we’ve weathered some storms. We may not stay together until death, but we will stay together for a while. There’s comfort in familiarity, maybe it’s simply time to adjust expectations. Figuring out what is at the core of what you love and then holding on to it with all your might. I think that’s what I’m doing. Trying to save my relationship, and trying to save myself. See you at the rock show.
Marco Esquandoles
Devil’s Advocate
 An example of the boundaries and metadata for Denver International Airport as found in the USA Airport Hub Size layer file. (Data Source: Esri)
Airports are a focus of many spatial projects, both large and small. And if you have a copy of ArcGIS with the free datasets loaded on to your hard drive, then you might have found that this data is less than ideal in many cases. So if you are working in the United States and need more detailed airport information, check this additional free dataset offered by Esri.
This USA airport file is delivered as a layer package that can be opened with a double-click. Layer packages save symbology, layer order, etc. making them an easy way to send a map file to fellow ArcGIS users. Once you open the file, you will see detailed airport boundaries, runway vectors and robust metadata.
Until my next edition of the Free For All, happy hunting for free geospatial goodies!
Brock Adam McCarty
Map Wizard
(720) 470-7988
brock@apollomapping.com
 (Images Courtesy: DigitalGlobe. Processed by Apollo Mapping for improved color accuracy and clarity.)
We love maps.
We love imagery.
We love work breaks.
We hope you like them as well!
Workdays are long but breaks are short, so we suggest lots of them in the day. The next time you head out for one, check out this 30-centimeter color WorldView-3 imagery collected over the 2015 Dubai Airshow on November 9, 2015. The biennial event is held at Al Maktoum International Airport which is located just outside of Dubai, United Arab Emirates. The Dubai Airshow traces its roots to a small trade show held in 1986 called Arab Air. The first Dubai Airshow was held in 1989 and it drew 200 exhibitors and 25 aircraft. The 2015 event drew 1,103 exhibitors and 150 aircraft–that is quite some growth! You can find out more about the Dubai Airshow here.
Have a great rest of your workday!
- The February 2016 technology snippet will continue the theme started last month on random and cool advancements to clean my back log of topics a bit.Here is a way to reduce global carbon dioxide level with a plastic-like sponge. The world’s largest rooftop farm is (or perhaps was?) in Chicago! Here is the first hybrid airplane which can use up to 30% less fuel. This is a new idea to generate power from waves. A Dutch company uses plants to power hot spots, LED lighting and more. Your typing pattern and stroke is unique, it could be used to power your next green keyboard as well as offer an extra layer of security. Our society generate lots of waste heat, this material could harvest some of it. Is the yarn in your Ford F-150 made from recycled plastic?
I would love a lightning fast computer made with optical computer chips or even by nanolasers. In the future, we might all be using carbon nanotube lights bulbs that are 100 times more efficient than LEDs. I could think of more than one friend who would love clothing heated with ultra-efficient nanowires. Our waterways are clogged with algae, maybe we should harvest the algae for biofuel and fertilizers. Is a wireless household charger just around the corner?
This idea would be perfect for the developing world and those off the grid as it uses sunlight to clean wastewater and generate electricity; or how about this gold catalyst which will also clean water and generate hydrogen gas. This nickel foam electrode can also split water into hydrogen gas. Here is a way to use nature to generate power at the freshwater-saltwater interface. Who knew that a simple AAA battery could split water into oxygen and hydrogen gas? And could we store milk in the developing world with low-cost pulsed electric fields?
 The NOAA map above shows the percentile departure from average temperatures for all of 2015. You can see record warmth across large parts of the globe with only record or below average cold over the North Atlantic Ocean.
- This month was a double gut punch for the climate-change deniers out there as the NOAA global climate report for December 2015 confirms it as the hottest month ever and accordingly the hottest December ever in 136 years of records. But wait folks, that’s not it–the 2015 annual NOAA global climate report also confirms that 2015 was by far the hottest year on record! The December departure from average exceeded 1 degree Celsius for the first time in record keeping as well. Check out the facts for yourself–this is an important topic we all need to be aware of.
- On February 10, 1863, Alanson Crane invented the fire extinguisher, and in honor of this momentous occasion (J) my Google search of the month was, “GIS and fire.” If you comb through the many hits you get, you might find this paper on forest fire risk mapping by Claudia Cáceres of Saint Mary’s University of Minnesota. In this study, Cáceres uses a variety of layers, including land cover type, elevation and distance to roads, to assess fire risk in a traditional weighted overlay approach.
- For this month’s review of city GIS websites, we stay on the East Coast traveling from Philadelphia to Rhode Island’s largest town, Providence. The landing page for the Providence GIS department definitely leaves a lot to be desired but it does have links to multiple resources. From this page, you can access a collection of PDF plat maps and then a collection of themed PDF maps. There are also some slick looking web maps you can access on general information, 2010 census data and city council zones, however with Google Chrome I did not have much success making the maps work. You are able to email the GIS team with custom data requests using the form here.
Brock Adam McCarty
Map Wizard
(720) 470-7988
brock@apollomapping.com