
For three years, Airbus’ twin high-resolution radar satellites, TerraSar-X and TanDEM-X, imaged the entire land surface of our planet multiple times to create the first ever global 12-meter (m) elevation model. Referred to as WorldDEMTM, this data is ideal for all mapping projects requiring accurate elevation models including orthorectification, floodplain determination, mineral exploration and hydrocarbon development.
 A comparison of 30-m SRTM and 12-m WorldDEM elevation data over Arkansas, USA.
WorldDEM September 2016 Product Updates
In June 2016, a significant change to the minimum order size was announced as it was reduced from 500 square kilometers (sq km) to just 100 sq km! That is a huge reduction in the minimum order price. In addition, the minimum order width is now just 1-km for a DSM and 2-km for a DTM. And then in August, prices for all three processed versions of WorldDEM went down over 25%!
During September, a massive section of Antarctica was made available as well as many of the islands in the Atlantic, Indian and Pacific Oceans. WorldDEM areas that are available to order take a minimum of 10 days to deliver.
To date, there is more than 183,225,000 square kilometers (sq km) of WorldDEM data that is available! And some 15,708,000 sq km of WorldDEM was made available for delivery in the past month alone.
 A coverage map of the one-degree cells that are currently available for delivery. Areas that are available will take a minimum of 10 days to deliver.
WorldDEM Specifications
The key product specifications of Airbus’ WorldDEM are as follows:
- Resolution: 12-m
- Coverage: entire landmass of the Earth, ~150 million square kilometers (sq km)
- Absolute Vertical Accuracy: < 4-m Linear Error 90% (LE90)
- Relative Vertical Accuracy: < 2-m LE90 (slopes ≤ 20%), < 4-m LE90 (slopes > 20%)
- Absolute Horizontal Accuracy: < 10-m Circular Error 90% (CE90)
- Vintage: all data collected within 3 years
- Source: interferometry from synthetic aperture radar (SAR) satellites TerraSAR-X & TanDEM-X
- Minimum Order: 100 sq km per polygon
- File Format: GeoTIFF
- Projection: geographic WGS84 (EGM2008, vertical datum), meter vertical unit
- Product Line Options:
- WorldDEMcore–unedited digital surface model (DSM), includes spikes, wells and voids
- WorldDEM–a DSM with removal of artifacts and water body flattening
- WorldDEM DTM–artifacts and surface features removed, i.e. a digital terrain model (DTM)
WorldDEM Coverage and Pricing
WorldDEM data has a 100 sq km minimum order size with a 1-km for a DSM and 2-km for a DTM width requirement. Prices for all WorldDEM product lines have been set at:
- WorldDEMcore–$9.20 per sq km
- WorldDEM–$11.50 per sq km
- WorldDEM DTM–$18.40 per sq km (that’s a 40% savings from the original list price!)
WorldDEM Samples
You can download four 12-m WorldDEM samples here, including one of the WorldDEM DTM product:
- Buraydah, Saudi Arabia–desert with agriculture present; elevations from 576 m to 737 m provided in two formats, WorldDEMcore and WorldDEM
- Mjosa Lake, Norway – hilly terrain with large water bodies; 100 m to 840 m provided in two formats, WorldDEMcore and WorldDEM
- Rapid City, South Dakota, USA–moderate to hilly terrain; elevations from 927 m to 1,765 m provided in two formats, WorldDEM and WorldDEM DTM
- Wagga Wagga, Australia – forest and urban with many water bodies; 137 m to 922 m provided in two formats, WorldDEMcore and WorldDEM
For more information about 12-m WorldDEM data, please send us an email at sales@apollomapping.com or check our website here.
- More snippets this month in our continued look at technological advancements (mostly) in the world of renewable energy.Biofuel: Studies suggest that switching to biofuels made from stems and leaves could greatly reduce their carbon footprint. This microbial fuel cell could convert urine to power! While this bacteria could inhale carbon dioxide and convert it to alcohol fuel. Speaking of carbon dioxide, it can be used to greatly reduce the cost of biofuel production.
Solar: Adding a layer of graphene to solar panels lets them produce energy in the rain. Solar farms are shown to increase local biodiversity. This solar panel just broke the theoretical limit of efficiency! While this is an improvement on the bionic leaf which now produces biofuels at a 10% efficiency versus nature’s 1% efficiency.
Wind: This improved off-shore turbine design can reduce costs by 60%. LiDAR is common in our industry and apparently it can be used to accurately measure off-shore wind speeds. Taller towers access faster winds and this precast concrete tower can push heights over 100-meters. If you have gale force winds, you need an innovative design to handle those gusts, this is one that can do it.
Random and Fun: Splitting water with a carbon-catalyst to yield hydrogen is closer to reality with this research. If we can ever produce graphene at a cost-effective price, a thin film of it could coat electronics to keep them cooler and thus working more efficiently. Here are seven ways to cool foods without a refrigerator. And finally, how about a home built using this transparent wood…weird?!
- Yep you guessed it–another months of record sets according to the August 2016 NOAA climate report as it was the hottest August in the 137-year record. It was also the 8th highest departure from average in the record, meaning that 14 of the 15 highest departures on record have occurred since February 2015. What do you think we will see in September? I’ll give you one guess only…
 The August 2016 NOAA temperature percentile departure map. It shows pockets of record warmth on every continent with very limited cooler than average areas.
- On October 3, 1932, Iraq gained independence from Britain and in memory of this event, my Google Search of the month was, “GIS and Iraq.” If you look through the results, you might come across this paper by Medina et al. which is a GIS analysis of terrorism patterns in Iraq from 2004 to 2009. The GIS analysis is both spatial and temporal; and unfortunately seems like a rather timely articles in these days of increased terror.
- From Virginia Beach last month, we travel across our great nation for a review of Washington’s largest city’s GIS resources, Seattle. And while admittedly the landing page for the GIS team is a bit less than awesome, the resources you have access to here are quite top notch! First, there is an online web map that is very robust, loaded with tons of data and is easy to use. For more advanced users, you can download a variety of spatial datasets using the links found here. If you cannot find what you need, you can always email the Seattle GIS folks for custom requests. They even offer printed map services here.
Brock Adam McCarty
Map Wizard
(720) 470-7988
brock@apollomapping.com
Please Note: This is a rerun article from our September 2016 edition for those how might have missed it the first time!
Starting immediately, Apollo Mapping is pleased to announce significant price drops for nearly every optical imagery product offered by Airbus Defense and Space. These prices drops include all SPOT 6/7 and Pléiades 1 imagery products from both the archive and as a new collection; and then in mono and stereo/tri-stereo modes.

Several highlights from the Airbus price drops include:
- Minimum-size archive orders for 50-cm Pléiades 1 imagery now start at just $290.
- While minimum-size archive orders for 1.5-m SPOT 6/7 imagery starts at just $440.
- There are still 50% academic discounts on offered Pléiades 1 and SPOT imagery.
If you like an updated price list that details these Airbus price changes, send us an email at sales@apollomapping.com or give us a call at (303) 993-3863.
You might also check out our article here on an automatically updated price list as prices do change frequently!
 This map shows the areas imaged by the Pléiades 1 constellation from June 1 to August 31, 2016 over Canada and the United States. Please note that in many instances, multiple images were collected over the same area which is difficult to portray on this static map.
In this monthly piece, we give our readers a sense of the high-resolution imagery coverage collected over a geography during a specified window. To do this, we pick a high-resolution satellite constellation, a defined time period and area of interest, then report key statistics on the total amount of imagery collected in square kilometers (sq km). Without further delay, let’s jump into our analysis.
Graphic Region of Interest: Canada and the United States (minus Hawaii) plus most near off-shore islands
Land Mass Covered: 19,345,496.1 sq km
Time Period: June 1 to August 31, 2016
High-Resolution Satellite Constellation: Pléiades 1 (i.e. Pléiades 1A and 1B)
Pléiades 1 Constellation Imaging Statistics–Canada & the United States
Total Area Collected: 5,495,862.8 sq km; 29,868.8 sq km per satellite/per day
Area Collected @ 20% or Less Clouds & 30 Degrees or Less Off-Nadir: 3,563,625.3 sq km; 19,367.5 sq km per satellite/per day; 64.8% of total
 My inspiration for the weekend.
I saw the movie “Old School” with Will Ferrell in the theater three times. I don’t think I’ve ever seen a movie in the theater even twice before, so that was a first. Yea, it was lowbrow humor with easy setups and a predictable outcome, but I just found it funny. I’ve caught parts of it here and there on TV when I’m bored and scrolling through to see what’s on, and it always captures my attention, even if just for a little while. My guess is that one of the reasons I like it so much is because I can relate to it in some way. You see, I am a fast approaching middle-aged “retired” frat boy. It’s been 15 years since I moved out of the frat house and put away the paddle, and I no longer wear Greek letters as a staple. But the frat is still in me. I imagine Yoda might say, “The frat is strong in this one, it is.” Wrong movie, but you get the point. Hopefully… Returning to “Old School,” I identify with it in some odd way because I’m still fratty and I could envision a situation where I stepped back into my frat life again, however unlikely that would be. in fact, years ago, I came up with what I thought was a good idea for a reality show: they’d wrangle up 20 middle-aged frat guys all from the same house and then move them back into their old frat house for a semester. The old guys would have to try to recreate their old lives: going to class, going out and partying every night of the week, having social functions, working at bars, etc. I still think it would work. It would be a comedy of errors.
So it is this weekend that I’m having a frat reunion of sorts back on campus (the University of Illinois). Getting the group together was like herding cats, but we’re going to be about 12-13 strong, so while the turnout could’ve been more impressive, it’s a big enough group to keep things interesting. We’ll be going back for the Illini football game against the UNC Tar Heels (a school we still hate from getting beaten by them in the 2005 men’s basketball national championship game), and it will take place at night, so there’s a whole day of, well, drinking. I’ve been trying to psych myself for pacing the beers. It’s never been a strength of mine but I’ll need to power through somehow. I get in Friday night, as do four others, so the smaller group will have to develop an extra strong constitution for the weekend. Those Saturday-only guys are getting off easy. I don’t want to make this come off as being all about drinking because it’s not. It’s about college girls, too.
My dad is a retired fireman. He is a plaque in his den that reads, “Old firemen never die. They just eat smoke and drink firewater.” Cheesy, yes. But I wonder what it would be for old frat boys? My guess is it would not be fit for print. But to keep it PG-13, I’d suggest: “Old frat boys never die. They just drink Natural Light and smoke Parliament’s.” Hmm. Doesn’t have quite the ring. I’ll let you know what I find to be more fitting after this weekend. That is, assuming I’m still alive to tell about it…
The large group is meeting at an old staple on campus at noon on that Saturday, Murphy’s, a campus legend for big greasy burgers and cheap suds. It’s funny though: I never really hung out there during college. I ate there a few times, and have come to do so more over the years since leaving campus (my alma mater is also in my hometown), but in terms of bars, it wasn’t one that we frequented. It wasn’t a fratty bar. We had our mainstays where we made the rounds: C.O. Daniel’s (now closed), Kam’s, Bub’s (now Red Lion), Orchid (now closed), Gully’s (now closed), R&R Sports Grill (now something else, the name escapes me) and Clybourne (now Firehaus). It appears we’re trying to avoid all these old haunts (well, the ones still open). Aside from needing to be on/near campus for meeting up and the game, it appears we’re going to go downtown for our imbibing needs. It has developed a lot and there is a ton to offer–I go there every time I’m back–but what about college girls? They don’t go downtown. I may have to point this out to the crew…
This will be like the 2nd or 3rd time I’ve returned to campus with a large group of brothers since graduating, but it’s been probably 7-8 years since the last installment. People have gotten married since then (and divorced). People have had kids since then (some have had several). People have gotten older since then (and lazier). So it’ll be different. When we were younger and we would gather in cool locales like Illini football games at other schools or bachelor parties in fun cities, it seemed we were always able to return to our old form. To pick up where we left off and party like 20-year olds again. Speaking from experience I can tell you that’s hard the older you get. Sometimes one night is all you need because that’s all you can handle. The recovery process of debauchery takes longer and longer the older you get. I think because we’re mostly out of practice. And maybe we value sleep a little more.
In 2009 one of good buddy’s had his bachelor party in Tahoe. It took place over a very long weekend. I was one of those foolish enough to go for the whole 5 nights. Several did, actually. Many went for four nights. The point I’m trying to make is, I was trying to change my flight after the 2nd night. Many people were. We all wanted out. We’d done all the damage we could handle. We thought we were a 4th of July fireworks show and in reality we were duds. We didn’t have the fizzle to make it 4-5 nights. Of course what happened was that I couldn’t get my flight changed and I had to make it through the rest of the weekend. Abusing my liver, kidneys and brain cell count. I did it. I guess I look back on it now as some strange accomplishment. Kind of like climbing Mt. Everest or sailing around the world solo. Kind of… Anyhow, this was seven years ago. My party stamina has leveled off. But I’m in it for the weekend, hoping I can keep my wits about me Friday, pace myself Saturday afternoon and then let loose Saturday night. I’ll be staying at my folks’ place, so I hope I don’t make any really bad decisions: throwing up, falling down the stairs, crawling into the wrong bed. I probably should have gotten a hotel with the others, so this might be the 1st mistake of a long weekend full of them. We’ll see…
Then when it’s all said and done, this Sunday I fly back to my current home on the East Coast. At 10 a.m. Ugh. That’ll be rough. Then somehow I have to slap myself into coherence and get ready for a very busy week. It’s going to be tough. I sure wouldn’t want to do this every weekend, but I’m sure glad I get to do it. All the emails, phone calls and social media interaction in the world can’t hold together friendships the way sharing space–and beer–can. This weekend is about 4 years of college (well, 5.5 for me…) and the 20 years since we all met, but it’s also about the next 20 years. This will be a significant anchor point for the growth and maintenance of those friendships going forward. And I’m grateful for it. Frat guy till I die!
Marco Esquandoles
The Fratmaster General
Do you have the need for regularly updated images of locations around the world?
Perhaps you need imagery to integrate with an OEM solution you are developing?
Or maybe your organization uses large amounts of high-resolution imagery each year, and you are seeking a low-cost option for this data?
If you answered yes to any or all of these questions, then the solution you are looking for is DigitalGlobe Basemap (GBM).
With DigitalGlobe Basemap, you have access to millions of square kilometers of imagery with low cloud-cover and off-nadir angles. This data is accessible in streaming web-mapping services as well as through an online viewer. And perhaps the most important feature of GBM is the regular updates you can receive as out-dated imagery is often of little or no use to our valued clients.
September 2016 Product Update
 The available DigitalGlobe Basemap imagery over China by location and the most recent coverage date. In the vast majority of locations, there are multiple imagery dates available.
In our last check on GBM, we focused on Australia and this month we move to one of the most consequential countries in the world, China. And even with the persistent cloud cover over much of China and the huge competition for satellite resources along its booming East Coast, the coverage is still quite impressive. Check out the map here as well as the stats below!
- China GBM Coverage By Year
- Less than 1 year (yr) old–5,474,608 sq km, 58.43% coverage of China
- 1 to 2 yr old–4,254,704 sq km, 45.41% coverage
- 2 to 3 yr old–3,368,618 sq km, 35.95% coverage
- 3 to 4 yr old–3,523,646 sq km, 37.61% coverage
- 4 yr old and greater–9,068,185 sq km, 96,79% coverage
- Total coverage–25,689,761 sq km
- Total (approximate) area of China–9,369,516 sq km
DigitalGlobe Basemap Product Specifications
- Geographic Regions Covered: defined area of interest, US county, country or global
- Maximum Imagery Resolution: 50-centimeters through WMS and WCS; 60-cm for other delivery mechanisms
- Data Sources: primary = WorldView-2 and GeoEye-1; secondary = QuickBird, IKONOS, WorldView-1 and aerial
- Database Update Frequency: annual, semi-annual, quarterly or daily; updates are to limited portions of the database, not the entire database
- Data Accuracy: 8.5-meter CE90%
- Database Access: OGC streaming services (i.e. WMS, WMST, WCS and WFS), Google Earth streaming services (i.e. EarthService), ArcGIS plugin (i.e. ImageConnect), offline database and online portal
- Pricing Model: transactional and unlimited tiered subscriptions based on geography and number of users (with uplifts for more frequent updates and imagery downloads)
- Subscription Term: annual
For more information on the pricing and coverage available in DigitalGlobe Basemap, you can reach our sales team anytime at sales@apollomapping.com or during typical business hours at (303) 993-3863.
HealthMap is a free and automated global health system that both monitors and subsequently visualizes reports of disease outbreaks around the world. By implementing algorithms that scan news outlets, social media, government reports and other online sources, HealthMap is able to identify patterns and trends in disease reporting that otherwise may go unnoticed if monitored by a single source.
HealthMap has been in operation since September 2006 and is a collaboration between Harvard Medical School and Boston’s Children’s Hospital (as well as many other partner organizations throughout the world that contribute data). Created by John Brownstein, PhD and Clark Freifeld, MS, the online application is essentially one giant map filled with points corresponding to recent case reports. Users are able to zoom in to a given part of the world and click these points to open up a small window that provides a brief description of the report. Usually the points contain a hyperlink to the original report, allowing users to quickly gain a detailed understanding of where, when and to what extent a disease’s presence was observed.
 Screenshot of the HealthMap online application, with disease reports represented by colored points plotted across the map. (Credit: Boston Children’s Hospital)
Perhaps the best example of HealthMap’s speed and effectiveness was its role in the 2014 West African Ebola crisis. The tool’s algorithms, which are able to simultaneously ignore irrelevant information while classifying relevant information, identified a “mystery hemorrhagic fever” in the region nine days prior to the World Health Organization’s official declaration of an Ebola epidemic.
Besides having developed powerful epidemiological monitoring tools, HealthMap’s team has created additional supplementary services that are available to users on the site. Of particular note is the Vaccine Finder (currently available primarily in the United States and a few locations in Canada), which lets users search for the nearest clinic providing vaccinations based on the disease they select. HealthMap also maintains a blog, The Disease Daily, which keeps HealthMap users and the public at large informed of epidemiological trends and other health concerns on a public scale with daily posts.
To learn more about HealthMap, visit www.healthmap.org.
Fletcher Berryman
Cloud Tamer
(720) 470-7988
fletcher@apollomapping.com
Do you have an area of interest that requires regularly updated imagery but you do not have time to check daily for this data?
Or perhaps you have a remote location that needs updated imagery but you cannot afford a new collection?
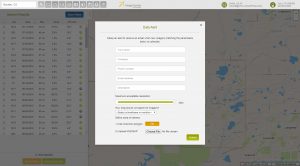
If either of these questions ring true, then you need to check our new Data Alert service on Image Hunter!
Data Alert lets you define an area of interest anywhere around the globe, the resolution your project requires and the number of months we should keep the alert active. Once this is set up, we check for new data over your area of interest every single day, and send you an email alert when we find coverage that meets your specifications.
We have a short YouTube video with directions to set up a Data Alert, check out the second video. We also have written directions for Data Alert here.
It’s that easy to find the data you need for all of your key projects.
If you would like to check out Data Alert, send us an email at sales@apollomapping.com or visit Image Hunter and click on the bell icon in the header to get started using this great service!