
Do you have an area of interest that requires regularly updated imagery but you do not have time to check daily for this data?
Or perhaps you have a remote location that needs updated imagery but you cannot afford a new collection?

If either of these questions ring true, then you need to check our new Data Alert service on Image Hunter!
Data Alert lets you define an area of interest anywhere around the globe, the resolution your project requires and the number of months we should keep the alert active. Once this is set up, we check for new data over your area of interest every single day, and send you an email alert when we find coverage that meets your specifications.
We have a short YouTube video with directions to set up a Data Alert, check out the second video. We also have written directions for Data Alert here.
It’s that easy to find the data you need for all of your key projects.
If you would like to check out Data Alert, send us an email at sales@apollomapping.com or visit Image Hunter and click on the bell icon in the header to get started using this great service!
In the last hundred years we have seen unprecedented innovation in aeronautical technology. At the forefront of this research is the NASA Langley Research Center. Celebrating its 100th anniversary this year, NASA is looking back on everything they have accomplished through this ambitious research facility.
Established just after World War I, who could have imagined that less than 100 years later engineers would move from propeller driven planes to landing men on the Moon and shuttling spacecraft deep into space. For the remained of the year, NASA will be highlighting the research and technology that has propelled us into the future under the hashtag #NASALangley100.
A 45-minute documentary delves into the last 100 years as well as the present, highlighting the roll aeronautics has played in United States history. There is far too much material to regurgitate here, so sit back, relax and enjoy the show.
Grab a cup of coffee and enter full screen mode to get the most out of this 45-minute documentary on the NASA Langley Research Center. (Credit: NASA)
Larson C is Breaking Up, is This Goodbye?
NASA scientists are keeping a close eye on Antarctica’s Larson C ice shelf as a large iceberg, the size of Delaware, split off from it. Larson C is an area of glacial ice that floats on the East side of the Antarctic Peninsula and is the fourth largest of its kind. Calving incidents like this one are normal for ice shelves, as long as the ice gained through regular snow fall balances out the ice lost. Scientist will be looking closely to see how the rest of the ice shelf reacts to losing 10% of its area.
If this is a normal calving incident then the rest of the ice shelf will remain intact. Pinning points anchor the shelf and provide support. Current measurements affirm that the major pinning point for Larson C was not calved in this recent event. Researchers are holding their breath, hoping to avoid the fate of the Larson A and Larson B ice shelves that collapsed after major calving events and directly contributed to sea level rise. Only time will tell if Larson C will suffer the same fate and drive further sea level rise around the world.
In this monthly feature, we span the globe to examine Our Changing Landscape with time series of medium resolution RapidEye satellite imagery. The RapidEye archive dates back to late 2008 and already contains more than 10 billion square kilometers of data. In July, we looked at the amazing California super bloom that occurred this Spring after the torrential seasonal downpours; and this month we continue the focus on California with a look at Twitchell Reservoir and its rapid refill this year after the abundant rain.
The RapidEye Constellation
 Click on the image above to see an animation of 5-meter natural color RapidEye imagery collected over Twitchell Reservoir on July 4, 2010, September 20, 2016, January 16, 2017 and May 16, 2017. In the 2016 to 2017 images, you can see just how quickly the reservoir levels recovered after being essentially dry in the September 2016 data–amazing! The July 2010 RapidEye image was added just to give context and show that variation in the level of Twitchell Reservoir is not new–even if it was pronouncedly dramatic in the historic Californian droughts of the past few years. (Images Courtesy: Planet @ 2017)
RapidEye is a constellation of five 5-meter medium resolution satellites each offering five spectral bands of information. The RapidEye constellation offers daily revisits to every location on the planet with a huge footprint that is 77-km wide. The data is priced competitively with a starting cost of $1.28 per square kilometer for all five spectral bands–academics do receive discounts. RapidEye adds a fifth band, the red edge, to the ‘traditional’ multispectral set of blue, green, red and near-infrared (NIR). The additional spectral data in the red edge band allows users to extract more useful land ‘information’ than can be from traditional 4-band imagery sources. When RapidEye imagery is ordered as a Level 3A Orthorectified product, images from multiple dates are extremely well registered, making it the ideal data source for Our Changing Landscape.
The Refill of Twitchell Reservoir, California
As we mentioned last month, in some parts of California, they have received months’ worth of rain in just a few short weeks. This plethora of rain had a dramatic impact on the state’s reservoir system–many of which were nearly empty. We have covered the depletion of California’s reservoirs in past Our Changing Landscape, for example Folsom Lake in our July 2014 edition; and this month we are happy to cover the opposite, the refilling of Twitchell Reservoir. If you would like to see low resolution imagery of many of California’s reservoirs before and after the Spring rains, here is an excellent article to check out.
Twitchell Reservoir spans the borders of Santa Barbara County and San Luis Obispo County. Constructed in the late 1950s, the human-made lake supplies water and flood protection to the Santa Maria Valley. Twitchell has a capacity of 194,971 acre feet with a maximum water elevation of 651.5 feet (198.6 meters). In late January 2017, Twitchell stood at just 5.5% of its capacity; and after the rains of Spring 2017, the reservoir rebounded significantly to 37.3% of its capacity as of late June where the County of Santa Barbara received 136% of its normal-to-date rainfall. Now it is time to turn to the 5-meter RapidEye archive to see just how much of the lake has returned!
If you would like to find out more about using RapidEye for your academic studies, engineering projects or any landscape analysis, let us know at sales@apollomapping.com or (303) 993-3863.
In this month’s edition of Map Mavin Methods, we’ll provide you with a brief overview and introduction to our extensive Support page. Though it’s a new and regularly updated product, Map Mavin (MM) already has a detailed and comprehensive support backbone that covers everything from billing FAQs to the process of editing spatial layers and data.
Without diving too deep into each of the many articles in the support framework, let’s take a look at each of the various sections you’ll encounter upon opening our support site at support.mapmavin.com.
General:
Here you’ll find common FAQs that aren’t specific to a particular category. Examples include signing up for our free trial, the significance of some of our more common error messages and how to address them, differences in account types and more.
My Data Layers & Folders:
The “My Data Layers & Folders” section is correspondent to the section of the same name found in Map Mavin. This section is where files and folders are found in the Map Mavin platform and thus the support questions here address common questions related to organization and the use of spatial data in MM. Many of the most basic and essential videos for learning to use Map Mavin are found in this section, including “How do I create a web map?” and information on projections that our system will accept.
My Web Maps:
Like the “My Data Layers & Folders” support section, this too corresponds to the tab of the same name in Map Mavin. Frequently asked questions about the map creation and visualization process are filed here, and most have detailed video walkthroughs attached. If you have a question related to the process of actually making maps with MM, this is the place to look!
Manage Users:
This section answers questions about connecting with other Map Mavin users, inviting non-users to public and private maps and more. The FAQs here, like many in other sections, have video walkthroughs to help users figure out where to go and how to connect and share maps within the platform.
Manage Account Info:
This section is pretty straightforward; any questions regarding registration, personal info tied to given accounts, email notifications, etc. are found here.
View Usage:
The View Usage section answers questions related to our View Usages tab in Map Mavin which does exactly that: users can view a pie chart detailing usage of allotted storage and the file size of each uploaded spatial layer. FAQs here also explain how to check one’s status with our free trial.
Map Mavin Updates:
No surprises here, this is where we post updates on our system as a whole and let you know what we’ve been doing to make Map Mavin even better!
If you have any other questions regarding our FAQs or Map Mavin in general, don’t hesitate to reach out to support@mapmavin.com or to Fletcher, our guy for all things Map Mavin related at:
Fletcher Berryman
Cloud Tamer
(970) 710-0909
fletcher@apollomapping.com
 A 30-cm color aerial imagery sample collected over Houston, Texas late September 2013.
For some projects, satellites cannot offer the resolution or cloud-free conditions demanded by your project. In these instances, the solution is our 15-centimeter (cm) and 30-cm aerial imagery. Delivered in color or with four multispectral bands, our new collections of aerial imagery are a reasonably-priced solution for your next geospatial project in the United States (and beyond) for areas down to 100 square kilometers (sq km).
Here are the key specifications of our tasked aerial imagery offering:
-
- Minimum Order Size: 100 sq km
- Spectral Bands: natural color, color infrared (i.e. green, red and near-infrared) or 4-band multispectral (i.e. blue, green, red and near-infrared)
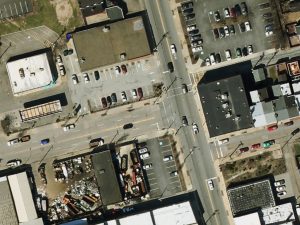 And now a 15-cm color aerial imagery sample collected over Pittsburgh, Pennsylvania on April 10, 2014.
- At Nadir Resolution: 15-cm or 30-cm
- Typical Delivery Time: 1 to 2 months
- Possible Coverage Area: continental United States (other geographies may be available with a custom quote)
- Horizontal Accuracy: ~3-m CE90 (dependent on terrain, can be improved with ground control points)
Our aerial imagery offering is ideal for customers requiring competitively priced, cloud-free data at resolutions not available from a satellite sensor.
If you would like more information on our tasked aerial imagery services, you can reach us by phone at (303) 993-3863 or email. In the meantime, you can check out additional samples and product specifications on our website here.
Do you have the need for regularly updated images of locations around the world?
Perhaps you need imagery to integrate with an OEM solution you are developing?
Or maybe your organization uses large amounts of high-resolution imagery each year, and you are seeking a low-cost option for this data?
If you answered yes to any or all of these questions, then the solution you are looking for is DigitalGlobe’s Global Basemap (GBM).
With Global Basemap, you have access to millions of square kilometers of imagery with low cloud-cover and off-nadir angles. This data is accessible in streaming web-mapping services as well as through an online viewer. And perhaps the most important feature of GBM is the regular updates you can receive as out-dated imagery is often of little or no use to our valued clients.
August 2017 Product Update
 The available DigitalGlobe Basemap imagery over Australia by location and with the most recent coverage date indicated with varying colors. In the vast majority of locations, there are multiple imagery dates available.
In July, our focus was on Central America and this month we move to the other side of the world with a look at GBM coverage over Australia. And has been the trend month after month, the amount of coverage over Australia in GBM is just mind-blowing, especially when you consider how sparsely populated much of the nation-continent is. Check out these coverage statistics here:
- Australia GBM Coverage By Year
- Less than 1 year (yr) old–6,354,872 sq km, 82.67% coverage of Australia
- 1 to 2 yr old–7,173,795 sq km, 93.32% coverage
- 2 to 3 yr old–3,092,802 sq km, 40.23% coverage
- 3 to 4 yr old–1,657,458 sq km, 21.56% coverage
- 4 yr old and greater–6,839,752 sq km, 88.98% coverage
- Total coverage–25,118,679 sq km
- Total (approximate) area of Australia–7,687,327 sq km
Global Basemap Product Specifications
- Geographic Regions Covered: defined area of interest, US county, country or global
- Maximum Imagery Resolution: 50-centimeters through WMS and WCS; 30-cm for other delivery mechanisms
- Data Sources: primary = WorldView-2 and GeoEye-1; secondary = QuickBird, IKONOS, WorldView-1 and aerial
- Database Update Frequency: annual, semi-annual, quarterly or daily; updates are to limited portions of the database, not the entire database
- Data Accuracy:5-meter CE90%
- Database Access: OGC streaming services (i.e. WMS, WMST, WCS and WFS), Google Earth streaming services (i.e. EarthService), ArcGIS plugin (i.e. ImageConnect), offline database and online portal
- Pricing Model: transactional and unlimited tiered subscriptions based on geography and number of users (with uplifts for more frequent updates and imagery downloads)
- Subscription Term: annual
For more information on the pricing and coverage available in DigitalGlobe’s Global Basemap, you can reach our sales team anytime at sales@apollomapping.com or during typical business hours at (303) 993-3863.
Launched in late 2016, Map Mavin is our pay-as-you go GIS cloud that lets users make unlimited public and password-protected web maps. Once you upload your vector and raster files to our secure Amazon cloud, you are ready to make and share your web maps in minutes–just like this demo web map we made with vectors and a base layer TIFF from Boulder, Colorado.

And with our Screen Share function, you can link up with users all around the world to collaborate on a map in real-time. Picture a live webex in your mind but just based around a map that moves and changes as the members of your team update information. Imagine the possibilities of working in real-time with a team of collaborators around the world without any GIS knowledge required!
Priced at just $20 per month with a free trial month, there is no other cloud-based GIS on the market that can compete with Map Mavin on price. For your $20 per month, you are able to store and/or download up to 5 gigabytes (5GB); and once you go over 5GB in a month, it costs you just 75-cents per GB from there! As an added bonus, you can cancel your monthly contract at any time.
August 2017 Product Updates
In the past month, we released Map Mavin updates that included but were not limited to the following list of fixes, additions and enhancements:
- As we write this article on July 24th at about noon here in Colorado, our development team is busy working on the final touches to our first code update in a few months. It has been quite the ride to get this far and we look forward to having many new and exciting updates in next month’s Map Mavin Roadmap–stay tuned please!
Stay tuned to this series where we will let you know about the Map Mavin changes that were released in the past month.
If you have an improvement or feature addition you would like to add the Map Mavin product road map, let us know by email at support@mapmavin.com.
Are you interested in trying out Map Mavin? If so, you can sign up here. Or maybe you would like a live demo of the product before you sign up? If so, send us an email at support@mapmavin.com and we will get one scheduled right away!
I’m from Illinois and for as long as I can remember all I wanted to do was get out. It took a while, but finally I did. I’m not sure I can fully articulate why I thought the state didn’t have anything for me, but a lot of it had to do with my perception of its lack of natural beauty. I guess beauty is in the eye of the beholder, so they say, and every person has their own definition of what is beautiful. Maybe those farmers that have soybeans, wheat and corn look at Illinois as beautiful because the soil is so rich and the end products put a lot of food on a lot of tables. There were certainly little pockets of natural beauty near where I’m from, and elsewhere through the state as well. But in general, to me, Illinois is a state largely lacking in aesthetic appeal. So what would it take for Illinois to beautiful, in my eyes? Well, a mountain wouldn’t hurt, but that isn’t necessary or realistic (obviously). There are large tracts of forested areas, so that does have some appeal to me, but the state is largely farmland with a few small urban centers and one major one. And I’ve never been a big city guy. Not at all. I never understood the appeal for the concrete jungle; it is more abrasive to me than the farmland. At least that’s natural (well, sort of). I know people say that cities are where the energy and ideas are, where different people come together and figure out how to get along (for the most part). If that’s true, than I guess the rural areas are where people get stuck in their ways and stick to what they know. I guess that could be true to a degree; it certainly has been proven in many instances. But I would rather live on a ranch in the country than a high-rise in the city any day. But really what I would like is a cabin near the woods, off the beaten path, and far enough away from “civilization” to feel that I don’t have to always be a part of it.
I, among others, refer to Illinois as being part of the Midwest. I’ve never really given it much thought about whether this is geographically true or not until somewhat recently. I was talking to some friends a while back out in Oregon, all transplants themselves, about our hometowns and states. One friend was from Ohio, one from Kansas, and the other from South Dakota. My friend from Ohio agreed with me that we were from the Midwest. The other two did not. Then they started to talk about what the “West” was and asked me to define that. I said the start of the West was Colorado; they agreed. Then they asked me if that is true, how Ohio and Illinois could be considered part of the Midwest. I had to pause. I then tried to argue that states like the Dakotas, Kansas and Nebraska were the Great Plains, not the Midwest. That argument sunk quickly, even with myself. They said that states like South Dakota and Kansas were the true Midwest if for no other reason than that they were midway to where the West started, Colorado. I had to agree. So then I had to ask myself: where am I from? I brought back in the Great Plains designation and considered if that was a more accurate description of where I’m from and other farm states like Iowa, Indiana, Ohio and Missouri. It seemed plausible that maybe that was a better designation. Wisconsin and Michigan often got designated as both Midwest and Great Lakes states, and it seemed that residents there were happy with the designation of the latter. So, I guess I’m from the Great Plains. But is that even true?
When I thought about it further, I thought that the Dakotas and Kansas were more accurately Midwestern, but also Great Plains, too. I mean, they have just as much prairie and farmland as Illinois, and arguable more space in between urban centers. Illinois might be Medium Plains, more accurately. That wouldn’t do. Then we started talking about state slogans; you know, what it says on your license plate. Indiana is the Crossroads of America. How lame. That simply implies that you shouldn’t stop there. It is simply just a necessary pain-in-the-butt obstacle on your way to somewhere better. Ohio is the Birthplace of Aviation. Well, okay, but North Carolina is First in Flight. So which state holds the claim? Illinois is the Land of Lincoln. Yes, surely one of our greatest presidents, but he wasn’t even born there. Missouri is the Show Me state. Show me what? The way out, right? Ho-hum. None of those will do. But then I hung on that last state, Missouri. One of their two biggest urban centers is St. Louis, in part famous for their lovely arch. And what is that city’s motto? The Gateway to the West. Hmm, well, for starters, it’s just another locale reminding people to get out. But also, if they’re correct, and they’re the Gateway to the West, then that means that the Midwest must start on the other side. Dang it. So Missouri is Midwestern. Illinois just missed the cut.
So where does that leave us no-longer-Midwesterners? Let’s look at the states east of us Midwestern rejects (Illinois, Indiana, Ohio, etc.): Kentucky claims the Southeast (this one I don’t agree with, at least geographically. Maybe culturally…), as does Tennessee. Pennsylvania, well, the eastern part of the state is what, Mid-Atlantic? Almost, Northeastern? West Virginia and Virginia are likely Mid-Atlantic, and then North Carolina on down claims the South or Southeast. Anything north of Pennsylvania is the Northeast. Minnesota is another one of those in-between states. They could be Great Plains or true Midwestern, but I’m not going to worry about them now. I’m still trying to figure out what Illinois and a few others (Indiana and Ohio) can rightfully call themselves. Something that the “true” Midwestern states often get called mockingly are the “Flyover States.” I’m not sure if this would really apply to Illinois (or the other two) because there are some pretty major population centers there. I mean, if you removed Chicago then I guess 99.9% of people would want to fly over Illinois. Chicago remains and most people still do anyhow… Flyover States won’t do, either.
 Yep, that’s what we’re about.
Well, I guess it is up to me to come up with a new term for that block of IL/IN/OH/IA (and likely western PA, and probably KY): how about the Forgotten States? Well, I don’t think many people living there would like that. The Refueling States? Nope, not unless BP and Shell wanted to give some big kickbacks. One of the things I pride myself on, and not many others seem to understand, is my sarcasm. Everyone I know from Illinois (and other former Midwestern states) has a sarcastic edge to them, or at least understands it–even appreciates it. You don’t find that too much elsewhere, unless you’re in the Northeast. In fact, most people think you’re just being cruel. They’re just stupid. Before I even type this I know that the Sarcastic States ain’t gonna fly either, but I would love to be able to claim that. Nothing else really comes to mind. There isn’t anything that is uniquely Illinois (and IN, and OH, etc…), sad to say. Maybe I should just focus on Illinois and let the others worry about themselves. Let’s see, what is Illinois about? Well, four of our last seven governors have gone to prison. Our state is dead broke and about to be reduced to junk status. This will likely cause many of the public universities to shut their doors, so education is undervalued. Chicago is the only major city to have a population loss in the last decade (gun violence probably plays a role there, among other things). Jeez. I’m drawing a blank on good things about Illinois.
So this brings me back to my conversation with my “real” Midwestern friends; what did they think Illinois and Ohio should be called? We’re not the Bible Belt, we’re not Tornado Alley, and we’re only partly the Rust Belt. So we had to go back to what we started with: the farmland. We’re Farm Country. The breadbasket of the country. I mean, the University of Iowa has on their football team’s helmets a sticker that reads: ANF (America Needs Farmers). And we do. No food, no people. Well, not the most glamorous, but maybe the most accurate. I wasn’t raised on a farm, I never lived on one, but they were all around me, all the time. So we’re not Midwestern, we’re just Farm People. It’s in the soil.
Marco Esquandoles
Country Boy