

In November, we checked out the site of a key Pac-12 late season college football matchup, and so this month we move to our other coast with a look at Hard Rock Stadium in Miami, Florida–site of the annual Orange Bowl–for this Pléiades 1–SPOT 6/7 Stadium of the Month.
Name & Its Origin: In its 30 years of existence, the football stadium in Miami used by both the Miami Dolphins and the University of Miami has had eight names. The latest is Hard Rock Stadium which the Hard Rock Café won naming rights to in 2016 for 18-years at $250 million.

 A 50-cm color image of Hard Rock Stadium in Miami, Florida, USA collected on January 8, 2017 by Pléiades 1A; and then a 1.5-m SPOT 7 image collected of the same stadium–even collected on the same day! These images have custom processing and color balancing applied by Apollo Mapping. PLEIADES © CNES 2017, Distribution Airbus DS. SPOT © Airbus DS 2107.
Location: Hard Rock Stadium is located in Miami Gardens, Florida which is a northern suburb of Miami about 12.9 miles (20.7 kilometers) from downtown and 7.6 miles (12.2 kilometers) from the Atlantic Ocean at just 5-feet (1.5-meters) above sea level.
Stadium Capacity/Size, Architect & Build Date: Originally opened as Joe Robbie Stadium, it is surprisingly hard to find details on its construction. According to Wikipedia, construction on the stadium broke ground on December 1, 1985 and completed on August 16, 1987 for $115 million. The original architect, Populous (now called HOK Sports), also completed the 2016 renovation of the stadium which cost a cool $500 million! Here is a time-lapse video of the 2016 renovations where after completed, the seating capacity of Hard Rock Stadium dropped from 76,018 to 65,326.
Type of Field Surface: Hard Rock Stadium has featured natural grass for its entire existence according to the news stories we see. In 2016, the field was a genetically-engineered grass species, Platinum TE Paspalum, however it is unclear what variety it may have been replaced with in recent months.
Key Sports Teams: Hard Rock Stadium has been the home of the National Football League (NFL) team, the Miami Dolphins, since the 1987 season; and is also the home of the college football team, the University of Miami Hurricanes.
Most Popular Yearly Event: Besides hosting home games for both the Dolphins and the Hurricanes, Hard Rock Stadium is used in a variety of events. For example, there was a summer concert series featuring U2, Metallica and Cold Play in 2017. You can also host a private event at the stadium. When it comes to championship football, the stadium has hosted five Super Bowls with its sixth scheduled for 2020; it is also home to the annual Orange Bowl game which is part of the College Football Playoff.
Fun Factoids: (1) The 2016 renovations of Hard Rock Stadium included a new, partially open roof that will provide shade to 92% of the seats inside. (2) The professional baseball team, the Miami Marlins, played 21 seasons in Hard Rock Stadium before moving to Marlins Park. (3) The 2016 renovations increased the total video screen square footage from 12,000 to 22,400 while moving fans from 80 feet to just 56 feet from the field. (4) After the 2020 season, the Miami area will have hosted 11 Super Bowls, the most for any city–with 6 of them at Hard Rock Stadium, second only to the Mercedes-Benz Superdome in New Orleans, Louisana.
The Pléiades 1 High-Resolution Satellite Constellation
The Pléiades 1 constellation (or at least part of it!) has been in orbit since December 2011 and if you have not had a chance to check out any sample imagery, take a few moments and have a look at the gallery on our website. If you work with high-resolution imagery, you should consider Pléiades 1 for your next geospatial project.
A variety of Pléiades 1 products are available from both a growing archive and as a new collection, including 50-centimeter (cm) pansharpened imagery and 50-cm panchromatic–2-meter (m) 4-band multispectral bundles. We are happy to discuss the technical specifications, pricing and tasking options available with this satellite constellation.
The SPOT Medium-Resolution Satellite Constellation
The SPOT medium-resolution constellation consist of seven satellites launched from 1986 to 2014 with the most recent additions, SPOT 6 and SPOT 7, launching in 2012 and 2014 respectively. SPOT 6 and SPOT 7 are twin satellites offering 1.5-m panchromatic and 6-m 4-band multispectral data with a massive footprint at 60-kilometers (km) wide. For projects requiring recent archive coverage or rapid new collections of medium-resolution data, SPOT 6/7 should be one of your top imagery sources!
More sample images and technical information about Pléiades 1A and 1B can be found on our website here; while the same can be found here for the SPOT constellation and specifically about SPOT 6/7.
The Apollo Mapping sales team can answer any questions you might have about Pléiades 1 and/or any of the SPOT satellites. We can be reached at (303) 993-3863 or sales@apollomapping.com.
Map Mavin is our GIS cloud, have you checked it out yet? If not, you can find out more information about it here.
If Map Mavin looks like a service you could use to create the web maps required for your next project, then you need to check out this monthly article where we give away up to five (5) free subscriptions!

So here is how this will work. Each month, we will give away up to five free one-month subscriptions to Map Mavin–that is a $20 value per subscription! Included in this free one-month subscription is 5 gigabytes (GB) of cloud-based storage and download bandwidth, plus you even get an additional free trial month. Once you exceed this 5 GB limit, you would be charged $0.75 per GB for the storage and/or bandwidth you use in the rest of the month. Then you would pay a base rate of $20 per month for Map Mavin from there if you decide to keep the service active. If you are already a Map Mavin client, we will credit your account $20 if you win the contest.
To win, you will need to submit the correct answer to the trivia question below. You have 24 hours from the time our newsletter sends to submit your answer. We will randomly draw the five winners from the group of readers who answered correctly; and then announce these winners in the next edition of The Geospatial Times.
Okay, ready, set, here we go:
What is the oldest church in the United States and in what year was it finished; further what city and state is it located in and who was the US president when it was finished?
You have 24 hours to get us the correct answer to this question by email. Please submit your answers to sales@apollomapping.com.
November 2017 Free For All Answer & Winners!
In November, the answer to the Free For All trivia question was Sputnik which was launched into space on October 4, 1957 to a height of 583 miles where it made 1,440 orbits around our planet in its 92 day life span.
We had one winner in November, Steve Leonard, congratulations!
Good luck winning our monthly prize and let us know if you have any questions about Map Mavin!
Have you checked out the new and improved Image Hunter yet?!?! If not, you should!
Listening to the feedback we received on improving imagery search engines, the new version of Image Hunter features a major overhaul to the user interface as well as to the backend architecture. Image Hunter Version 2 is built on open-source technology so now it works on all computers, not just on Windows machines. We slimmed down the user interface to make it easier to find the imagery filters and other available tools. All things said, we really think you will enjoy your browsing experience with Image Hunter (Version 2).
Key December 2017 Improvement(s)
During December, we made a ton of improvements to Image Hunter, many of them backend related so you might not see the benefits directly. That said, we significantly reduced the server load during system updates which means quicker response times when you search for imagery. We also added in a spinner to let you know when previews are loading. And finally, we are very happy to welcome back Formosat-2 previews to Image Hunter!

Data Alert–An Automated Daily Imagery Search
The future is now! We launched our highly anticipated Data Alert service in mid-2015 and it’s a hit! Data Alert lets you define an area of interest anywhere around the globe, the resolution your project requires and the number of months we should keep the alert active. Once this is set up, we check for new data over your area of interest every single day, and send you an email alert when we find coverage that meets your specifications. We have a short YouTube video with directions to set up a Data Alert, check out the second video. And we have written directions for Data Alert here.
And as you might have seen in past articles, we now feature hourly updates (seriously!) of GeoEye-1, Pléiades 1, SPOT 6/7 and WorldView-1/2/3/4!
Satellites in Image Hunter
Image Hunter can be accessed 24 hours a day, 7 days a week and is a one-stop shop for every major source of medium and high-resolution satellite imagery on the market today, including:
- Worldview-4
- WorldView-3
- WorldView-2
- WorldView-1
- QuickBird
- GeoEye-1
- IKONOS
- EROS B
- KOMPSAT-3A
- KOMPSAT-3
- KOMPSAT-2
- The Pléiades 1 constellation
- Deimos-2
- TripleSat
- The entire SPOT constellation
- RapidEye
- GaoFen-2
- GaoFen-1
- ZiYuan-3 (mono and stereo!)
- Formosat-2
Features of Image Hunter
If any of our readers have struggled with other geospatial search engines that are clunky, only query one data source and/or do not provide image previews, then Image Hunter is the solution to your woes, as it features:
- Online browsing of satellite imagery from 7 data providers and over 20 satellites.
- Near-instantaneous loading of low resolution preview imagery with collection date, cloud cover and other key metadata.
- The ability to define your area of interest by address and with coordinates, geometric shape or shapefile/KMZ.
- A responsive basemap with street names to provide spatial context when discovering data as well as crowd-sourced updates for the most accurate map possible.
- Exports of the area of interest you create as well as the scenes you select in shapefile or KMZ format.
- Support for all operating systems, and not just our friends with Windows machines!
The new version of Image Hunter can be accessed here. We are excited to find out what you think about Version 2!
If you have any ideas and/or feedback to improve the new Image Hunter, please let us know at sales@apollomapping.com or (303) 993-3863.
Do you have the need for regularly updated images of locations around the world?
Perhaps you need imagery to integrate with an OEM solution you are developing?
Or maybe your organization uses large amounts of high-resolution imagery each year, and you are seeking a low-cost option for this data?
If you answered yes to any or all of these questions, then the solution you are looking for is DigitalGlobe’s Global Basemap (GBM).
With Global Basemap, you have access to millions of square kilometers of imagery with low cloud-cover and off-nadir angles. This data is accessible in streaming web-mapping services as well as through an online viewer. And perhaps the most important feature of GBM is the regular updates you can receive as out-dated imagery is often of little or no use to our valued clients.
December 2017 Product Update
 The available DigitalGlobe Basemap imagery over South America by location and with the most recent coverage date indicated with varying colors. In the vast majority of locations, there are multiple imagery dates available.
In November, our focus was on +Vivid, which are countrywide (or close to it in some cases) offline mosaics produced in TIFF format; and in December, we pivot back to our normal topic with a look at the depth of the GBM database over South America. And okay, yes you are correct, the coverage is not as recent as you might find over the United States but that is not due to lack of effort! Rather, as you can appreciate, South America is a cloudy place–either way, check out the coverage statistics on the data we can offer over this region with GBM:
- South America GBM Coverage By Year
- Less than 1 year (yr) old–12,553,082 sq km, 70.89% coverage of South America
- 1 to 2 yr old–14,252,689 sq km, 80.49% coverage
- 2 to 3 yr old–7,113,038 sq km, 40.17% coverage
- 3 to 4 yr old–4,749,194 sq km, 26.82% coverage
- 4 yr old and greater–12,769,496 sq km, 72.11% coverage
- Total coverage–51,437,499 sq km
- Total (approximate) area consider–17,707,718 sq km
Global Basemap Product Specifications
- Geographic Regions Covered: defined area of interest, US county, country or global
- Maximum Imagery Resolution: 50-centimeters through WMS and WCS; 30-cm for other delivery mechanisms
- Data Sources: primary = WorldView-2 and GeoEye-1; secondary = QuickBird, IKONOS, WorldView-1 and aerial
- Database Update Frequency: annual, semi-annual, quarterly or daily; updates are to limited portions of the database, not the entire database
- Data Accuracy:5-meter CE90%
- Database Access: OGC streaming services (i.e. WMS, WMST, WCS and WFS), Google Earth streaming services (i.e. EarthService), ArcGIS plugin (i.e. ImageConnect), offline database and online portal
- Pricing Model: transactional and unlimited tiered subscriptions based on geography and number of users (with uplifts for more frequent updates and imagery downloads)
- Subscription Term: annual
For more information on the pricing and coverage available in DigitalGlobe’s Global Basemap, you can reach our sales team anytime at sales@apollomapping.com or during typical business hours at (303) 993-3863.
New Image of Jupiter
I’ve written about the Juno mission previously, sharing stunning pictures of the largest planet in our solar system, Jupiter. Since then, Juno has completed nine close flybys of the large planet, collecting more data and images. Recently, NASA released a gorgeous image of a massive storm on Jupiter’s northern hemisphere captured by the Juno spacecraft.
The dark clouds in the image are believed to be deeper in the planet’s atmosphere than the lighter, brighter clouds. These lighter clouds measure about four to eight miles in length and width.
Journey to Mars
While NASA works diligently on the Orion mission to transport people to Mars, they are simultaneously testing the systems necessary to sustain prolonged stays and instruments on the red planet. The Space Technology Mission Directorate (STMD) is providing funding for the Kilopower project to test sustainable power projects. Instead of looking to solar for prolonged power, they are testing the use of a space nuclear reactor.
I can only imagine that the lack of meaningful funding has pushed NASA to use existing technologies that are fast and comparatively cheap as a source of power off-planet. Little research and development is needed when it comes to nuclear technology, as they inch closer to visiting Mars. They can package up a mini-nuclear reactor and send it into space. Who needs innovation when we can just make a to-go size uranium-235 reactor core? The new reactor is dubbed the Kilowatt Reactor Using Stirling Technology, or KRUSTy.
I don’t know about you, but I can’t say I love the idea of venturing to new, untouched planets and leaving nuclear reactors in our wake just because our bloodlust to set humans on undiscovered places outpaces our advancement and investment in better suited technology. I’d tell you more, but I’ve inflicted enough sarcasm and snark on you for the moment.
In this month’s edition of Mapping For Good, we’ll look at a government-sponsored web mapping project that allows citizens to check and monitor the air quality in their region and across the United States. AirNow displays, among other indices, the Air Quality index over a particular city. With AirNow, users can check Air Quality Index figures over 400 cities daily. The site displays both national and regional values for ozone and particulate pollution in real-time. Additionally, visitors to the site can see nationwide forecasts each day.
About the Data
The collection of mapping and forecasting data is an amalgamation of readings from devices maintained by federal, state, local and tribal monitoring agencies. The agencies involved include the US Environmental Protection Agency, National Oceanic and Atmospheric Administration and National Park Service. In order to keep its services as close to “real-time” as possible, data are displayed at the end of each hour. As stated on its website:
“This data sharing and centralization creates a one-stop source for real-time and forecast air quality data. The benefits include quality control, national reporting consistency, access to automated mapping methods, and data distribution to the public and other data systems.”
 Above: A screenshot of the air quality levels over the southwest region of the United States on Airnow.gov.
Other Services Provided by AirNow
Airnow.gov has several supplementary services and programs that complement its existing map platform:
- Flag Program: Schools, organizations and the community are informed on daily air quality conditions through the flying of colored flags.
- AirNow Tech & API: Password-protected portals that allow state and local agencies and other researchers to submit and track air quality data.
- AirNow International: A separate, international version of AirNow that allows interested countries to better manage their air quality data.
If you have questions about AirNow, please be sure to visit their website at www.airnow.gov.
For questions about Map Mavin or any of the other services we provide at Apollo Mapping, email Fletcher at fletcher@apollomapping.com or give me a call at (970) 710-0909.
Fletcher Berryman
Cloud Tamer
(970) 710-0909
fletcher@apollomapping.com
- Technology is the best–and so it’s time for this month’s review of technological advancements!
Battery/Solar: These solar cells can be washed, making them ideal for sun-powered clothing and fabrics. Here is another way to convert carbon dioxide to usable fuel with just sunlight. This sodium-based battery could be lower cost per energy unit than common lithium versions.Random: If we can harvest energy from running water, how about an idea to the same from your bloodstream? Think about the possibilities of a fungus that could decompose plastics, especially in our polluted waterways. This underwater turbine could turn waves into power. Here is a wearable sensor that generates power from the difference in hot and cold If we harvested energy from evaporation over lakes and reservoirs, it could power up to 70% of our American needs. This nanomaterial can extract hydrogen fuel from saltwater–talk about sustainable energy! And here is another way to generate hydrogen fuel with sunlight. Finally, this paper-based electrode could be an important step forward for wearable electronic devices.
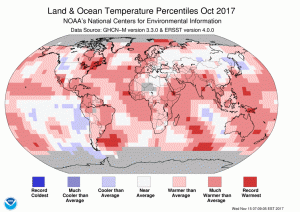 The October 2017 temperature departure map shows small pockets of record warmth across the world with average to below average conditions in northern Africa, central Asia and western North America.
- The October 2017 NOAA global climate report is out and the records continue sadly. This was the 394th consecutive month with temperatures above the 20th Century average and was also the 4th warmest October on record behind 2015 (the hottest on record), 2014 and 2016 respectively. With Syria joining the Paris Climate Accord, that leaves the United States as the only nation not to sign on–sad…
- Christmas is nearly upon as the year draws to a close and in honor of this special holiday, my Google Search of the month was, “Candy cane and GIS.” And okay while this result from Penn State University’s Department of Geography has zero to do with Christmas, it is still an intriguing topic about how language impacts our spatial imagination–enjoy the article!
- From Augusta, Georgia we travel over the Pacific Ocean for this month’s GIS review of Hawaii’s second largest city, Pearl City. And it appears as though Pearl City does not even have a government website as it is a census designated place–given this, I will refer you back to our review of Honolulu’s online GIS resources here as Pearl City is a near suburb.
Brock Adam McCarty
Map Wizard
(720) 470-7988
brock@apollomapping.com