

Cricket’s Chirp is created for Apollo Mapping by Ron Ruelle, a Wilmington, NC (formerly Boulder, CO) based cartoonist, lllustrator and teacher. No animals are harmed in the creation of these comics, but Ron sometimes breaks a pencil in frustration. You can see more of his work at www.ronruelle.com
 This map shows the areas imaged by the Pléiades 1 constellation from June 1 to August 31, 2025 over Central America. Please note that in many instances, multiple images were collected over the same area which is difficult to portray on this static map.
In this monthly piece, we give our readers a sense of the high-resolution imagery coverage collected over a geography during a specified window. To do this, we pick a high-resolution satellite constellation, a defined time period and area of interest, then report key statistics on the total amount of imagery collected in square kilometers (sq km). Without further delay, let’s jump into our analysis.
Graphic Region of Interest: Central America (plus small islands)
Land Mass Covered: 2,468,332.1 sq km
Time Period: June 1 to August 31, 2025
High-Resolution Satellite Constellation: Pléiades 1A/1B
Pléiades 1 Constellation Imaging Statistics–Central America
Total Area Collected: 464,250.6 sq km; 2,523.1 sq km per satellite/per day
Area Collected @ 20% or Less Clouds & 30 Degrees or Less Off-Nadir: 162,699.5 sq km; 884.1 sq km per satellite/per day; 35.04% of total
My grandparents split their time between a small condo in the city and a small cabin in the woods on a lake, about 35-40 minutes from my hometown. Up into high school, I spent a lot of time there, especially during the summers, where I would sometimes be there for 10-14 days per visit. My older brother would go out there as well, but we rarely went together. It was perhaps in part just easier for my grandparents to have one grandkid at a time, but also because of the age difference (6 years), it was harder to find something to do together that interested us both. Though, really both of our most favorite activities out there were pretty similar: swimming and fishing in the lake, riding ATVs, shooting bb and pellet guns, and just exploring the woods. Nevertheless, I enjoyed my time with my grandparents immensely growing up when I got to visit “the cabin.” There were some rules and reminders, but it was pretty easygoing otherwise.
My grandpa had a checklist by the door of all the things he needed to remember to do on a daily basis; for when he went back to the condo; and for when he was going to be gone for an extended period of time (which was rarely). There were also a couple of general reminders aimed more at us kids and other visitors, and the ones that stick out the most upon reflection are about varmint control. My grandpa had a shoot-to-kill policy on chipmunks because they got into the sheds and ate the bird and deer feed, and he didn’t like the moles and voles digging up holes on the perimeter of the house, so those were open season, too–something my brother had no problem taking advantage of. My grandma was a birder, and she had little tolerance for the “bully” birds, like blue jays, brown-headed cowbirds, and grackles. They picked on the other birds, like the junco, vireo, and the titmouse, so those bigger nuisances were also fair game. I didn’t think much of it, and I didn’t have the stomach for it, as after all, I was a critter lover. Thus, I did not typically participate in these extrajudicial killings. Except for once.
 Think about the consequences of your actions. There is reason not to pull the trigger, for if you do, the collateral damage may never stop. (Image retrieved from here and comes courtesy of Tima Miroshnichenko.)
Sitting on the front porch one evening before dusk, I was shooting the wooden door of one of the garages–a permissible activity, for nobody cared about its aesthetics and it was a very wide target away from people with little around or beyond it that could get damaged. I would often size up some rodent or bird in the closer proximity through the gunsight, but I rarely pulled the trigger. On a few occasions when I did, I felt terrible, but relieved that I was such a bad shot, as I really didn’t want to kill anything. Then, on that fateful night, a red-winged blackbird swooped in and started harassing a few wrens and a stray titmouse and I pulled the trigger once more, killing the intended target, albeit shocked that I was able to finally align hand and eye in coordinated fashion.
All the other birds dispersed, and I ran up to it, wide-eyed and speechless, immediately noticing that I’d killed this bird–who, to be fair, was a nuisance, but was in his own territory doing what birds do. I started to cry, and I ran and told my grandma. She was probably happy for one less pest in her sanctuary but understood that I was hurt and confused by my actions. She explained to me that I did a good thing and then had me take the dead bird out back to the sloped hill behind the house and bury it amongst the leaves. I never shot at another living being at my grandparents’ place again. I don’t know that I learned a lesson per se, but I did realize in that moment the fragility of life and how easily it can be ended. I also saw how an arbitrary action can be so consequential. And then I struggled with justifying the killing of this bird, even if it was reasonable to speculate that he’d been a pest and made other birds’ lives hell. It was not a good feeling because I didn’t think the punishment fit the crime.
The president of the United States, among all his scandals, illiberal and corrupt behaviors, and flaunting of norms and precedent, has somehow managed to step even farther past the red line of a democratic society by engaging in the extrajudicial killings of alleged drug traffickers in the waters of the Caribbean; on five separate occasions at the time of writing (October 20, 2025). His vice president, JD Vance, has said he doesn’t “give a shit” if these murders are illegal–which they surely are. Absent due process, not to mention the enactment of capital punishment for nonviolent activity (if the allegations of drug smuggling are true) in international waters, Trump & Co. operate under the banner of no restraint and no respect for laws or life. While we may never know the true identities or intentions of those killed, there is cause to believe that some of those whose lives were taken without reason or respect for humanity were fisherman, simply out doing a day’s work. But even if they were engaged in illicit behavior, this is still not an appropriate course of action–to put it mildly.
But it’s not the first heinous or egregious act of shock and violence and disrespect for human life and dignity taken by this president; those accrue by the day, whether it be through the Gestapo-like raids from the unrestrained and ever-growing legions of ICE, leading to deportations of those detained to countries with which they have no affiliation, or through the rhetoric they spew that does nothing but rile up the vilest of their base to behave as mercenaries in their quest to vanquish anyone not in lockstep with their ideology. Press Secretary Karoline Leavitt said of Democrats and those to the left of the center that they are made up of “Hamas terrorists, illegal aliens, and violent criminals.” It appears she doesn’t even “assume” that there any are “good people” amongst that faction any longer, an allowance Trump at least tacked on to one of his more memorable comments he made while on the campaign trail in 2015 about Mexicans.
While many surely support these abhorrent, indefensible, and illegal actions, others remain unaffected, simply because it’s not happening to them or anyone they know. Others justify that these types of things only happen to those who aren’t citizens of the United States–for now, maybe. But the slope is slippery to authoritarianism, and Trump has already started his police state, eroded trust in elections, the federal government, and civil servants, and cleaved a crevasse between the left and the right so wide that we can no longer even shout across it. Trump and his army of sycophants, including his consiglieres in his cabinet and his spin doctors in the rightwing media, have all sacrificed their credibility, their moral compasses, and their dignity to be as close to power as possible. All of the things they’ve railed about against the left–and to be fair, there is a lot wrong with the left worthy of criticism and reform (but nowhere near as much as what’s happening on the right these days)–they’ve now embraced. Whether it’s issues related to identity, free speech, or using the government as a weapon, Trump’s Republicans are a clear contradiction to what they formerly espoused, now dripping with insincerity and deceit, a true legion of Janus-faced combatants who have no will other than to appease Teflon Don.
The United States is coming up on 250 years, and it may well end up being an expiration date rather than a birthday. It was fun for a while, but now it’s just painful to watch it all unravel so fluidly and without anyone capable enough or willing to challenge our collective demise. What else will we see happen that we always thought imaginable? I’m scared to find out.
Marco Esquandoles
Front Row at the Dumpster Fire
In this monthly article, we travel the world to check out unique, fun and sometimes a bit weird 30-centimeter (cm) color imagery samples from the WorldView constellation. In October, we looked at Absheron National Park in Azerbaijan. For this edition of the 30-cm Color WorldView Image of the Month, we feature an image of Shandur Polo Field in Pakistan.
 Nestled high in the Himalayas, Shandur Polo Field holds the distinction of being the highest polo field in the world. Located at an elevation of 3,700 meters (~12,139 feet) above sea level in northern Pakistan, this unique venue hosts an annual Shandur Polo Festival that draws spectators and players from around the world. Surrounded by snow-capped peaks and pristine mountain lakes, a three-day festival held each July highlights a longstanding tradition that adheres to the original freestyle version of the game with no umpires or restriction rules. Each team consists of six players and they are allowed to do whatever it takes to score. This leads to intense matches in which both players and horses often get injured. Unlike a regular polo field, which is 270 meters by 150 meters, Shandur Polo Field is 200 meters by 50 meters, which adds to the risk of players clashing against one another. Officials say the event aims to foster unity and harmony between the two regions, which share historical ties and a friendly sporting rivalry. In the image featured here, we can see the vibrant green roofs of several buildings along with the narrow polo field stretching out at an angle and spectator stands running alongside it. This 30-cm WorldView Legion image was collected on September 23, 2024, and has custom processing and color balance applied by Apollo Mapping. (Satellite Imagery © 2025 Maxar Technologies)
30-cm WorldView-3 (WV3) launched in late 2014, WorldView-4 (WV4) launched in late 2016 and then the first WorldView Legion satellites launched in 2024. Taken together, this is the most advanced satellite constellation the commercial marketplace has ever had access to. Here are a few of the features that really set these satellites apart from the competition:
- Improved Resolution
- Higher resolution means you can see more detail in WorldView imagery.
- Data collected at nadir will have 31-centimeter (cm) panchromatic, 1.24-meter (m) visible and near infrared, 3.7-m SWIR (WV3 only) and 30-m CAVIS (WV3 only) bands.
- Additional Spectral Bands
- If spectral analysis is part of your project, then no other satellite can match WorldView-3 and WorldView Legion with their 8 bands of visible and near-infrared data; and then 8 shortwave infrared bands (WV3 only) which are crucial for geological studies.
- Better Positional Accuracy
- With accuracies of 3.5-m CE90% or better (without ground control even!), the 30-cm WorldView constellation has no rivals for its enhanced positional accuracy.
- Daily Revisits
- With multiple WorldView-3 and WorldView Legion satellites orbiting our planet, daily revisits are available for most locations.
- WV4 is no longer collecting new imagery.
- Increased Collection Capacity
- WV3/4 feature 13.1-km swath widths (at nadir) with the ability to collect up to 680,000 square kilometers (sq km) of high-resolution data per day per satellite (though WV4 is dead now).
- When fully launched, WorldView Legion will feature six 30-cm satellites, significantly boosting the collection capacity of this leading high-resolution constellation.
If you are interested in WorldView-3, WorldView-4 and/or WorldView Legion imagery for your next project, please let us know by phone, 303-993-3863, or by email, sales@apollomapping.com.
You can also find more WV3 samples and technical information on our website here; WV4 samples and information can be found here; and then finally here is more information about WorldView Legion.
- It’s that time again, as it’s time for our monthly review of cool technological advances! Here we go without delay:
A biodegradable plastic that is stronger than today’s plastics.
This plastic consumes CO2 at the end of its life.
Light-powered computer chip could make AI far more efficient.
Cleaning laundry with blue light.
Coffee might weaken antibiotics.
Diamonds might help in the battle against cancer.
Microbes can fight forever chemicals in nature.
New way to make medicines more sustainably.
Climate change drives evolution.
A mineral could help make rice farming more sustainable.
Biochar can clean water at a low cost.
In fact, you can produce biochar from the toxic sludge of biomass production.
This new rocket fuel packs a huge punch!
Diamonds could make electronics even faster.
- Given the ongoing US government shutdown, unfortunately there is no updated NOAA global climate change report to offer this month. We hope to get back on track in December, sorry readers!
- When the calendar flips over to November, it’s time to start thinking about the big Thanksgiving dinner and Black Friday shopping. Family and friends gather round the table to enjoy a Thanksgiving meal brimming with turkey, mashed potatoes and gravy, cranberries, stuffing, and pumpkin pie. But do you know where these staples for your Thanksgiving meal are grown? This GIS map shows the geographic origins of turkeys, sweet potatoes, and cranberries within the United States. Cranberries are cool-weather wetland plants, which partially explains why Wisconsin, Massachusetts, New Jersey, and Oregon lead the pack in cranberry production. Minnesota raises more turkeys than any other state, followed by North Carolina, Arkansas, and Indiana. According to the map, a single state–North Carolina–accounted for more than half of the sweet potatoes harvest in the United States. The state’s sweet potato trade association credits a hot, moist climate and rich, fertile soil for such high crop yields. While the majority of harvested potatoes are destined for use in fries, chips, and the like, many end up on Thanksgiving dinner tables as steaming heaps of mashed spuds. Just two states–Idaho and Washington–provide more than half of the total U.S. crop, this GIS map shows. A relatively small number of farms account for a large proportion of green bean production. Green beans are also called snap beans or string beans–although the latter is a misnomer, since the fibrous “string” has been largely bred out, as this GIS map indicates. If you’re consuming pumpkin pie this Thanksgiving, chances are that its filling will have originated in Illinois. The state has at least twice as many acres in pumpkin production as any other, and nearly 80 percent of Illinois’ pumpkins are processed into pie fillings and other products, as this GIS map illustrates. Pecans are a nut (seed) from pecan trees, that are used as a snack food as well as a part of Southern cuisine, including pecan pie. Along with pumpkin pie, pecan pie is a common dessert at Thanksgiving tables. Pecans grow best in regions with warm and humid climates. According to this GIS map, the top states for pecan production include New Mexico, Texas, Oklahoma, and Georgia, as well as other states in the southeastern USA. Green peas are often served as a side dish at the Thanksgiving table. Green peas grow best in regions with cool damp weather and moderate temperatures (55°F and 65°F). The top states for green pea production include California, Washington, Minnesota, Wisconsin, Michigan, and New York. This GIS map shows where there are at least 5-acres of land devoted to green pea production.
Brock Adam McCarty
Map Wizard
(720) 470-7988
brock@apollomapping.com
If your next mapping project requires large-area coverage of a seamless digital elevation model (DEM), then it is time to check out Airbus’ updated WorldDEM product, boasting new pricing and improved accuracy! WorldDEM Neo has improved 5-m resolution and is derived from TerraSAR-X and TanDEM-X radar stereo pairs. However, the radar pairs used to create this 5-m elevation dataset are more recent than its predecessor as they were collected from 2017 to 2021. WorldDEM Neo is available as both a digital surface model (DSM) and a digital terrain model (DTM) with an impressive absolute vertical accuracy of < 1.4 m Linear Error 90% (LE90)!
 Check out a sample of WorldDEM Neo 5-meter DSM data from Phu Hoi, Vietnam.
The 5-meter WorldDEM Neo DTM is available as a Level 1 or Level 2 product. The Level 1 product is an automated DTM and removes surface structures from the WorldDEM Neo DSM. The Level 2 product features manual processing resulting in a higher-quality DTM. This includes the removal of surface structures from the WorldDEM Neo DSM such as built-up areas and tall vegetation. It also incorporates the refinement of land cover borders before reducing the elevation to the terrain level and extending the preservation of ridge lines and canyons with the precise modelling of transport structure like bridges, motorways, embankments; and then detailing the extents of hydrographic features like water bodies, reservoirs, rivers, and respective alignment of water surface heights.
You can search for WorldDEM Neo now on Image Hunter; and then download a sample of DSM, Level 1 and Level 2 DTM data from the same location here.
To get updated DEM price list which includes 5-m WorldDEM Neo DSM and DTM data, send an email to sales@apollomapping.com.
In the meantime, check out these key specifications for 5-m WorldDEM Neo:
- Resolution: 5-meter pixel spacing
- Absolute Vertical Accuracy: < 1.4 m Linear Error 90% (LE90)
- Absolute Horizontal Accuracy: < 6-meter (90% circular error)
- Geographic Coverage: nearly pole to pole, same as 12-m WorldDEM
In this monthly feature, we span the globe to examine Our Changing Landscape with a time series of medium-resolution PlanetScope satellite imagery. The PlanetScope constellation dates back to 2016 and collects hundreds of millions of square kilometers of four and eight-band 3-meter imagery daily! In October, we headed to northern Chile where we checked out the Copiapo River and nearby farming town of Alianza. For the November edition of this series, we are looking at the Port of Los Angeles in the United States.
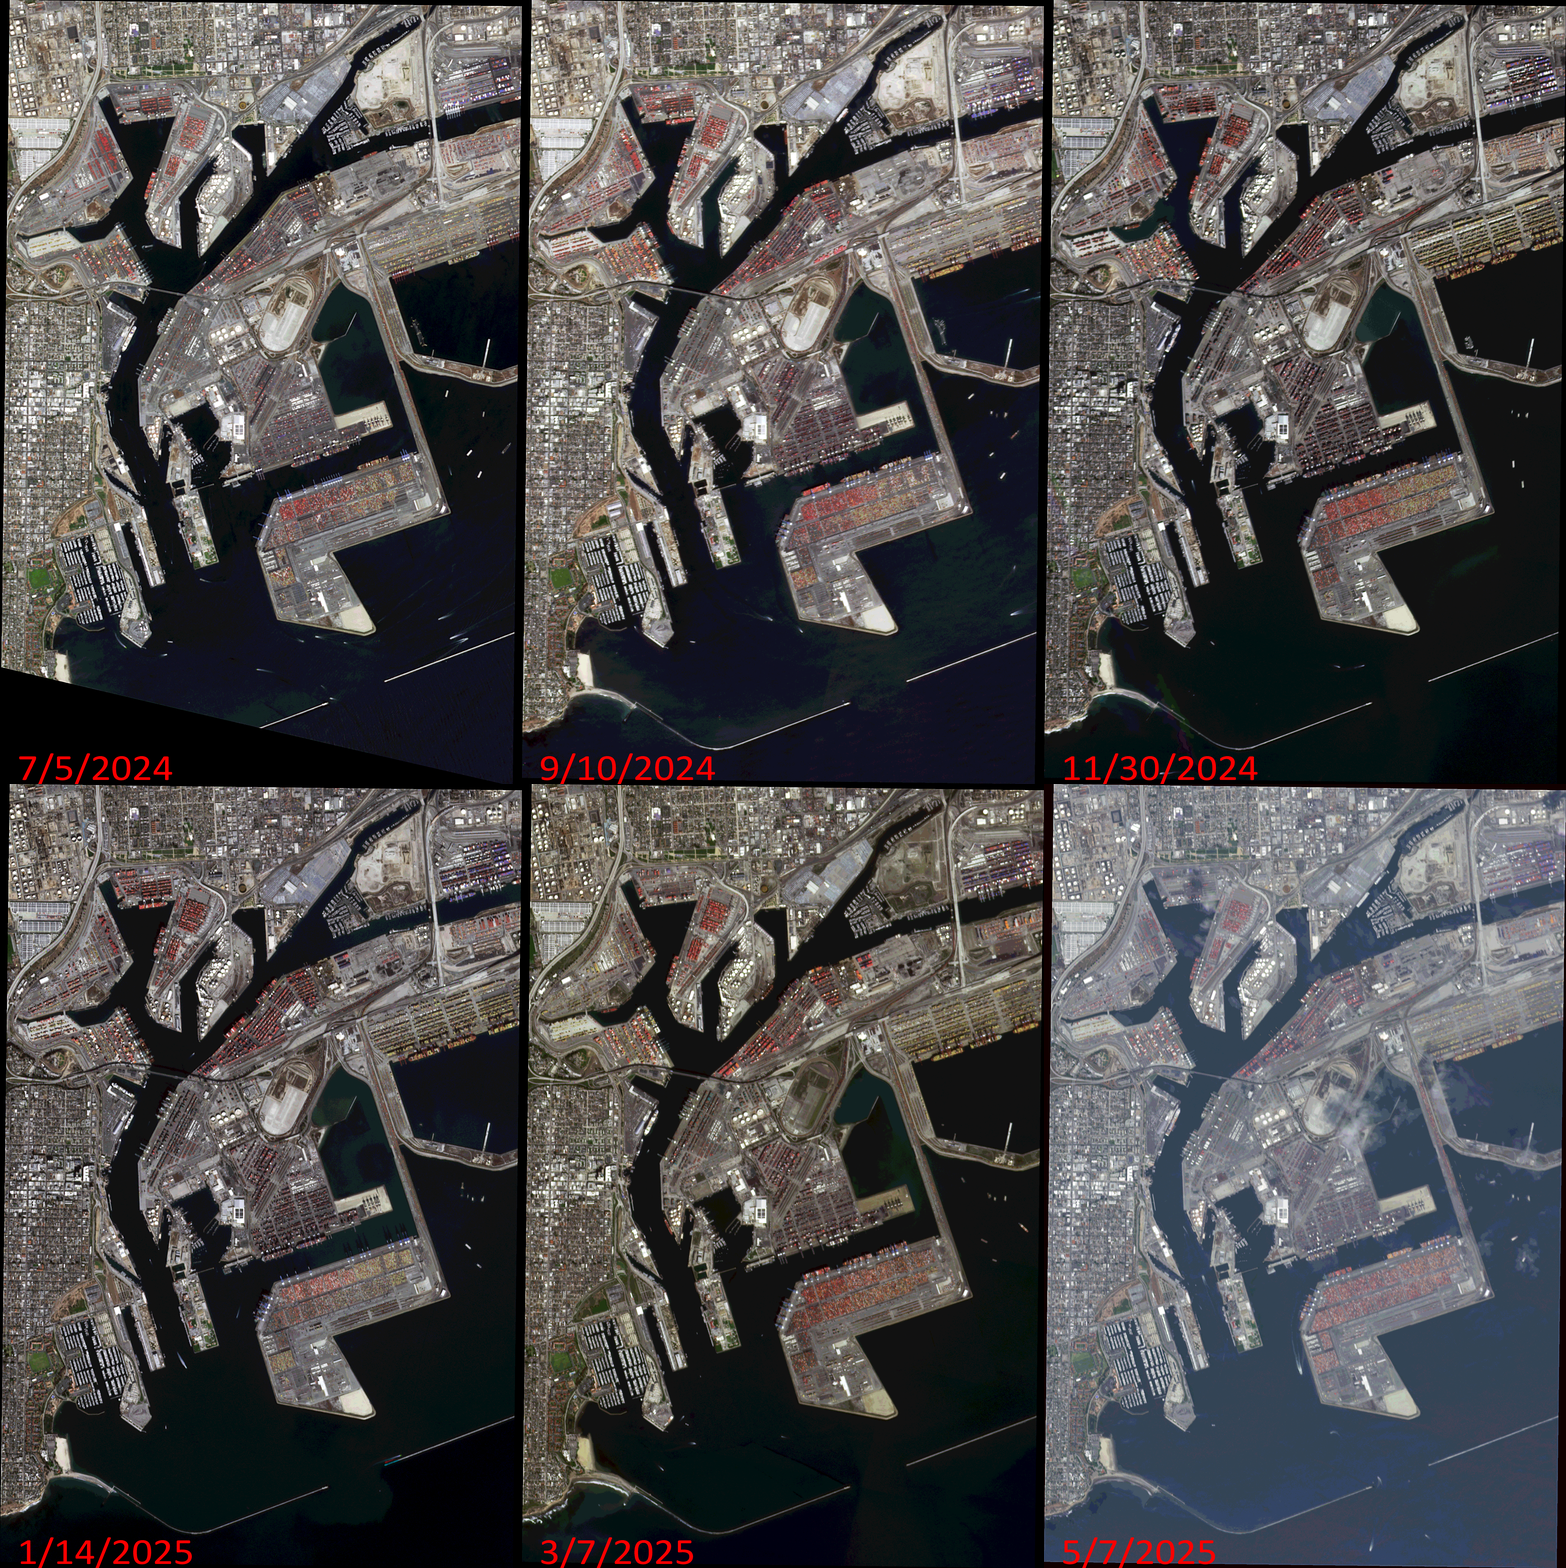
Click on the image above to see an animation of 3-meter natural color PlanetScope image collected over the Port of Los Angeles, California, USA on July 5, 2024, September 10 and November 30, 2024, and January 14, March 7, and May 7, 2025. In this animation, you can see just how much the stacks of shipping containers change over time as well as the number of huge ships in port varies from day to day. (Images Courtesy: © Planet 2025)
The PlanetScope Microsat Constellation
PlanetScope is a constellation of more than 240 microsats referred to individually as Doves. Each Dove is able to collect up to 20,000 square kilometers (sq km) per day of 3-meter (m) 4-band multispectral (i.e. blue, green, red and near-infrared [NIR]) imagery; and newly launched SuperDoves collect 8-band multispectral adding in valuable red-edge spectral data. Across the constellation, PlanetScope is archiving more than 200 million sq km of medium-resolution imagery a day, making it the go to source for daily imagery over most locations. This massive archive dates back to 2016, offering the most complete and continuous record of spatial data on the planet since the start of the constellation’s ongoing launch schedule. Collecting 3-meter multispectral imagery is the equivalent of ‘high-resolution’ multispectral data imaged by a 75-centimer (cm) satellite (as this satellite would feature 75-cm panchromatic and 3-m multispectral), making PlanetScope an extremely competitively priced option at just $2.25 per sq km. With well registered images and nearly daily collections of most locations, PlanetScope is the ideal imagery source for this current-events focused series, Our Changing Landscape.
Shipping Traffic in the Port of Los Angeles
The Port of Los Angeles happens to be the busiest container port in North America and it’s held the No. 1 spot for more than two decades with record volumes for containerized trade. The Port maintains an efficient, sustainable supply chain, adopting new technologies to improve the reliability, predictability, and efficiency of the flow of cargo across global seaborne trade.
July 2025 was the busiest month on record in the 117-year history of the Port of Los Angeles. The Port handled 1,019,837 20-Foot Equivalent Units (TEUs), 8.5% more than last July. Retailers and manufacturers brought in goods at an elevated pace due to concerns of higher tariffs later this year. Seven months into 2025, the Port of Los Angeles has handled 5,975,649 TEUs, 5% more than the same period in 2024. Furthermore, the Port of Los Angeles handled 892,340 20-Foot Equivalent Units (TEUs) in June 2025, 8% more than last year. It was the busiest June in the 117-year history of the Port of Los Angeles.
“Some importers are bringing in year-end holiday cargo now ahead of potential higher tariffs later in the year,” said Port of Los Angeles Executive Director Gene Seroka. “July may be our peak season month as retailers and manufacturers bring orders in earlier than usual, then brace for trade uncertainty. Meanwhile, the Port of Los Angeles closed its fiscal year on June 30, ending the period handling 10.5 million TEUs. That marks our third fiscal year exceeding 10 million TEUs, the only Western Hemisphere port to do so. And this time we reached that mark without a single vessel backed up.”
If you would like to find out more about using 3-meter PlanetScope imagery for your academic studies, engineering projects or any landscape analysis, let us know at sales@apollomapping.com or (303) 993-3863.
If you are searching for medium and high-resolution satellite imagery, the search is over as Image Hunter is the solution you’ve been looking for! Featuring satellite and aerial imagery as well as digital elevation models (DEMs) from a constantly expanding list of 60+ constellations/datasets and 19 vendors, our database contains more than 200-million images/records meaning there is just no other website out there with this breadth of commercial data products. Our interface is slim-lined and modern, loading quickly on all platforms, browsers and operating systems. Further, our database is updated multiple times an hour with the most recent images collected by WorldView-3, Pléiades 1, PlanetScope, SuperView-1 and many more so you are sure to get the most current view of all the imagery and DEM databases we work with. Once you submit your request, an Apollo Mapping representative will be in touch within 4 Illinois business hours to get you the pricing information you need for your project.
So why wait? Give Image Hunter a try now to find the imagery and/or DEM data you need for your next mapping project!
Key Improvement(s) From The Past Month
While we are busy fixing up a few imagery APIs as well as working on our new feature we know you will love, this month we tackled a bug that hid thousands of nice stereo and tri-stereo images from the Airbus archive, nice to have them back! We will keep you posted on the new feature, perhaps the first version will even be ready by next month 😊
Here is a summary of the changes/improvements we made to Image Hunter during the past month:
- Fixed a bug that hid thousands of stereo and tri-stereo images from the Airbus archive.
- Fixed another bug where stereo pairs would disappear as a user selected and de-selected them.
- Improved AWS settings for increased preview rendering speeds.
- Reduced some security measures that blocked many valid users from accessing Image Hunter.
- Updated PHP on all of our AWS servers and Apollo websites, that was a nightmare of a task!

Data Alert–An Automated Daily Imagery Search
Have you checked out Data Alert which lets you define an area of interest anywhere around the globe, the resolution your project requires and the number of months we should keep the alert active? Once an alert is set up, we check for new data over your area of interest every single day, and send you an email when we find coverage that meets your specifications. We have a short YouTube video with directions to set up a Data Alert, check out the last video; and we have written directions for Data Alert here.
The Sensors Available in Image Hunter
As you might have seen in past articles, we now feature hourly updates (seriously!) of GeoEye-1, KOMPSAT 3/3A, Pléiades 1 and Neo, SPOT 6/7, SuperView-1/2/Neo, WorldView-1/2/3/Legion!
Image Hunter can be accessed 24 hours a day, 7 days a week and is a one-stop shop for every major source of medium and high-resolution satellite (and aerial!) imagery on the market today, including:
- WorldView Legion
- WorldView-4
- WorldView-3
- WorldView-2
- WorldView-1
- QuickBird
- GeoEye-1
- IKONOS
- EROS B
- KOMPSAT-3A
- KOMPSAT-3
- KOMPSAT-2
- Pléiades 1 constellation
- Pléiades Neo constellation
- TerraSAR-X (TerraSAR-X, TanDEM-X and PAZ)
- GEOSAT-1
- GEOSAT-2
- TripleSat
- BJ3A
- BJ3N
- SPOT 1 to 7 constellation
- RapidEye
- GaoFen-2
- GaoFen-1
- ZiYuan-3 01/02 (mono and stereo!)
- FORMOSAT-5
- FORMOSAT-2
- ALOS PRISM (stereo)
- AW3D Standard (DEM)
- SkySat constellation
- PlanetScope constellation (including 5-band SuperDove data)
- SuperView-1 constellation
- SuperView-2
- SuperView Neo-1 01/02
- SuperView Neo-3
- Landsat 1-8
- TeLEOS-1
- DS-EO
- Hexagon (HxGN Content Program aerial imagery) imagery + DEM
- WorldDEM
- WorldDEM Neo
- Vricon DEMs
- Orbita Hyperspectral Satellite (OHS)
- KazEOSat-1
- KazEOSat-2
- Jilin-1 Optical
- Jilin-1 Video (including nighttime imagery)
- Jilin-1 GF/DP
- Jillin-1 KF
- Orbita Video Satellites-1/2/3 (OVS-1/2/3)
- BlackSky Global series
Key Features of Image Hunter
If any of our readers have struggled with other geospatial search engines that are clunky, only query one data source and/or do not provide image previews, then Image Hunter is the solution to your woes as it features:
- Online browsing of satellite and aerial imagery from 19 data providers and 56 satellite and aerial imagery derived datasets.
- Near-instantaneous loading of low-resolution preview imagery with collection date, cloud cover and other key metadata.
- The ability to define your area of interest by address, coordinates, geometric shape or shapefile/KMZ.
- A responsive basemap with street names to provide spatial context when discovering data as well as crowd-sourced updates for the most accurate map possible.
- Exports of the area of interest you create as well as the scenes you select in shapefile or KMZ format.
- Support for all operating systems, and not just our friends with Windows machines!
Image Hunter can be accessed here all day and night, we are excited to find out what you think about our imagery search engine! So if you have any ideas and/or feedback to improve Image Hunter, please let us know at sales@apollomapping.com or (303) 993-3863.