
Last month we checked out the site of the first National Basketball Association (NBA) matchup for the 2021-2022 season, and for the November edition of the Pléiades 1–SPOT 6/7 Stadium of the Month we travel across the pond to the premier division soccer (or football as you Europeans say!) league in Spain, La Liga, and to the site of a key game in Valencia, i.e. Mestalla Stadium.
About the Stadium: Mestalla Stadium is located in east-central Valencia about 2 miles (3 kilometers) from the Mediterranean Sea. Mestalla is the oldest stadium in Spain, opening on May 20, 1923 to host a friendly match between Valencia Club de Futbol–the team that still calls the stadium home–and Levante Unión Deportiva. Through its nearly 100 years of ‘life’, Mestalla has been renovated multiple times to expand its capacity and add more modern amenities, including in the mid-1950s, the 1970s and from 1997 to 2001. But still Mestalla lacks many of the amenities modern soccer stadiums boast, hence plans to build a new 75,000-seat stadium on the outskirts of town commenced in 2007; but were stopped shortly thereafter in 2009 due to lack of funding, and construction has yet to pick back up.

 A 50-cm color image of Mestalla Stadium in Valencia, Spain collected on May 13, 2021 by Pléiades 1A; and then a 1.5-m SPOT 6 image of the same stadium collected on March 23, 2021. These images have custom processing and color balancing applied by Apollo Mapping. PLEIADES © CNES 2021, Distribution Airbus DS. SPOT © Airbus DS 2021.
Fun Factoids: (1) Mestalla is set to host a match between Valencia CF and Atlético de Madrid on November 7th–who were both sitting close to the top of the La Liga standings when this article topic was decided upon, but have since slipped to middle of the pack. In 48 matches between the two foes, Valencia holds a 13–16–19 record (wins–loses–draws). (2) Mestalla has been in essentially continuous use since opening in 1923 with three marked periods of inactivity: the first for the Spanish Civil War were it was used as a concentration camp for nearly two years; the second in 1957, where a deadly flood in Valencia damaged the stadium and play ceased for about two months; and the third being the COVID-19 pandemic. (3) When Mestalla was first built it was surrounded by fields so fans had to jump over the Mestalla canal to enter the stadium, hence that is where it took its name from.
The Pléiades 1 High-Resolution Satellite Constellation
The Pléiades 1 constellation (or at least part of it!) has been in orbit since December 2011 and if you have not had a chance to check out any sample imagery, take a few moments and have a look at the gallery on our website. If you work with high-resolution imagery, you should consider Pléiades 1 for your next geospatial project.
A variety of Pléiades 1 products are available from both a growing archive and as a new collection, including 50-centimeter (cm) pansharpened imagery and 50-cm panchromatic–2-meter (m) 4-band multispectral bundles. We are happy to discuss the technical specifications, pricing and tasking options available with this satellite constellation.
The SPOT Medium-Resolution Satellite Constellation
The SPOT medium-resolution constellation consist of seven satellites launched from 1986 to 2014 with the most recent additions, SPOT 6 and SPOT 7, launching in 2012 and 2014 respectively. SPOT 6 and SPOT 7 are twin satellites offering 1.5-m panchromatic and 6-m 4-band multispectral data with a massive footprint at 60-kilometers (km) wide. For projects requiring recent archive coverage or rapid new collections of medium-resolution data, SPOT 6/7 should be one of your top imagery sources!
More sample images and technical information about Pléiades 1A and 1B can be found on our website here; while the same can be found here for the SPOT constellation and specifically about SPOT 6/7.
The Apollo Mapping sales team can answer any questions you might have about Pléiades 1 and/or any of the SPOT satellites. We can be reached at (303) 993-3863 or sales@apollomapping.com.

Cricket’s Chirp is created for Apollo Mapping by Ron Ruelle, a Boulder, Colorado based cartoonist, lllustrator and teacher. No animals are harmed in the creation of these comics, but Ron sometimes breaks a pencil in frustration. You can see more of his work at www.ronruelle.com
Every time we look at WorldView-3 and WorldView-4 (WV3/4) imagery, we are blown away. And we hope you are equally impressed with the data! In October we were in Hawaii with a look at an iconic garden maze, and for this month’s edition of the 30-cm Color WorldView-3/4 Image of the Month we stick with the garden maze theme, heading back to the mainland for a look at a seasonal maze created in Illinois each year, the Richardson Farm Corn Maze.
 Since 2001, the Richardson Farm in Spring Grove, IL has created a themed corn maze in their 28-acre cornfield. In the Fall of 2017, the Richardson Farm Corn Maze was unveiled, this time a shout-out to the 2016 World Series champs, the Chicago Cubs, who won their first series since 1908! This 30-cm WorldView-3 imagery was collected on September 28, 2017 and has been processed by Apollo Mapping for improved clarity and colors. (Satellite Imagery © 2021 Maxar Technologies
WorldView-3 launched in late 2014 and WorldView-4 launched in late 2016; taken together they are the most advanced satellite constellation the commercial marketplace has ever had access to. Here are a few of the features that really set these satellites apart from the competition:
-
- Improved Resolution
- Higher resolution means you can see more detail in WV3/4 imagery.
- Data collected at nadir will have 31-centimeter (cm) panchromatic, 1.24-meter (m) visible and near infrared, 3.7-m SWIR (WV3 only) and 30-m CAVIS (WV3 only) bands.
- At 20 degrees off-nadir, the resolution is 34-cm panchromatic, 1.38-m visible and near infrared and 4.1-m shortwave infrared.
- Improved Resolution
- Additional Spectral Bands
-
-
- If spectral analysis is part of your project, then no other satellite can match WV3 with its: 8 bands of visible and near-infrared data; and 8 shortwave infrared bands which are crucial for geological studies.
-
- Better Positional Accuracy
-
-
- With accuracies of 3.5-m CE90% or better (without ground control even!), WV3/4 has no rivals for its enhanced positional accuracy.
-
- Daily Revisits
-
-
- At 40 degrees latitude, WV3 is able to image every location daily with 1-meter or better resolution and then every 4.5 days at 34-cm resolution or better.
- WV4 is no longer collecting new imagery.
-
- Increased Collection Capacity
-
- WV3/4 feature 13.1-km swath widths (at nadir) with the ability to collect up to 680,000 square kilometer (sq km) of high-resolution data per day per satellite (though WV4 is dead now).
- Improved control movement gyros translate into larger maximum contiguous collection areas per pass, with up to ~7,500 sq km of mono imagery and ~3,000 sq km of stereo possible.
If you are interested in WorldView-3 and/or WorldView-4 imagery for your next project, please let us know by phone, 303-993-3863, or by email, sales@apollomapping.com.
You can also find more WV3 samples and technical information on our website here and then WV4 samples and information can be found here.

We love maps.
We love imagery.
We love work breaks.
We hope you like them as well!
October is one of our favorite months of the year as the weather is cool and crisp to complement the amazing colors of Fall, so you definitely need to get outside on a work break! But before you head out take a few moments to gander this 45-centimeter high-off nadir (or high-tilt angle with respect to the ground when the data was collected) WorldView-3 image of the 2019 US Open at the Billie Jean King National Tennis Center in Queens, New York. We have featured the US Open several times in the Geospatial Times, once in 2017 and once in 2018, and remarkably each time it was also a high off-nadir WorldView-3 collection. The image featured here from the 2019 US Open was collected on August 26th at approximately 11:56AM local time which would have been during a slew of First Round singles matches on both the Men’s and Women’s sides. And even more strange coincidences here, as we are drafting this article the 2021 edition of the US Open is about to kick off with two Men’s semifinal singles matches on the day’s schedule.
Have a great rest of your workday!
(Image Courtesy: DigitalGlobe. Processed by Apollo Mapping for improved contrast and clarity.)
If you are searching for medium and high-resolution satellite imagery, the search is over as Image Hunter is the solution you’ve been looking for! Featuring satellite and aerial imagery as well as digital elevation models (DEMs) from a constantly expanding list of 54 sensors/datasets and 19 vendors, our database contains more than 115-million images/records meaning there is just no other website out there with this breadth of commercial data products. Our interface is slim-lined and modern, loading quickly on all platforms, browsers and operating systems. Further, our database is updated multiple times an hour with the most recent images collected by WorldView-3, Pléiades 1, PlanetScope, SuperView-1 and many more so you are sure to get the most current view of all the imagery and DEM databases we work with. Once you submit your request, an Apollo Mapping representative will be in touch within 4 Colorado business hours to get you the pricing information you need for your project.
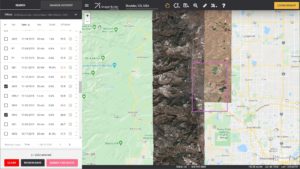
So why wait? Give Image Hunter a try now to find the imagery and/or DEM data you need for your next mapping project!
Key October Improvement(s)
As mentioned in last month’s edition of this article, our recent focus has been all about updating the back and front end code bases, and we are happy to report that the back end has been updated! We are working on cleaning up a few small bugs with this update and then we plan to pivot to the front end. With any luck, all of the updates should be done by early October!
Here is a summary of the changes/improvements we made to Image Hunter during the past month:
- It’s all about updating code bases!!
Data Alert–An Automated Daily Imagery Search
Have you checked out Data Alert which lets you define an area of interest anywhere around the globe, the resolution your project requires and the number of months we should keep the alert active? Once an alert is set up, we check for new data over your area of interest every single day, and send you an email when we find coverage that meets your specifications. We have a short YouTube video with directions to set up a Data Alert, check out the last video; and we have written directions for Data Alert here.
The Sensors Available in Image Hunter
As you might have seen in past articles, we now feature hourly updates (seriously!) of GaoFen 1/2, GeoEye-1, KOMPSAT 2/3/3A, Pléiades 1, SPOT 6/7, SuperView-1, TripleSAT, WorldView-1/2/3/4 and ZiYuan-3!
Image Hunter can be accessed 24 hours a day, 7 days a week and is a one-stop shop for every major source of medium and high-resolution satellite (and aerial!) imagery on the market today, including:
- WorldView-4
- WorldView-3
- WorldView-2
- WorldView-1
- QuickBird
- GeoEye-1
- IKONOS
- EROS B
- KOMPSAT-3A
- KOMPSAT-3
- KOMPSAT-2
- Pléiades 1 constellation
- Deimos-1
- Deimos-2
- TripleSat
- SPOT 1 to 7 constellation
- RapidEye
- GaoFen-2
- GaoFen-1
- ZiYuan-3 01/02 (mono and stereo!)
- FORMOSAT-5
- FORMOSAT-2
- ALOS PRISM (stereo)
- AW3D Standard (DEM)
- SkySat constellation
- PlanetScope constellation (including 5-band SuperDove data)
- SuperView-1 constellation
- Landsat 1-8
- TeLEOS-1
- Hexagon (HxGN Content Program aerial imagery)
- WorldDEM
- Vricon DEMs
- Orbita Hyperspectral Satellite (OHS)
- KazEOSat-1
- KazEOSat-2
- Jilin-1 Optical
- Jilin-1 Video (including nighttime imagery)
- Jilin-1 GF
- Jillin-1 KF
- Orbita Video Satellites-1/2/3 (OVS-1/2/3)
- BlackSky Global series
Key Features of Image Hunter
If any of our readers have struggled with other geospatial search engines that are clunky, only query one data source and/or do not provide image previews, then Image Hunter is the solution to your woes as it features:
- Online browsing of satellite and aerial imagery from 19 data providers and 54 satellite and aerial imagery derived datasets.
- Near-instantaneous loading of low-resolution preview imagery with collection date, cloud cover and other key metadata.
- The ability to define your area of interest by address, coordinates, geometric shape or shapefile/KMZ.
- A responsive basemap with street names to provide spatial context when discovering data as well as crowd-sourced updates for the most accurate map possible.
- Exports of the area of interest you create as well as the scenes you select in shapefile or KMZ format.
- Support for all operating systems, and not just our friends with Windows machines!
Image Hunter can be accessed here all day and night, we are excited to find out what you think about our imagery search engine! So if you have any ideas and/or feedback to improve Image Hunter, please let us know at sales@apollomapping.com or (303) 993-3863.
Man, no one was happier than me when concerts returned after our long covid-imposed hiatus. I quickly grew tired of watching performances online; nowhere near an acceptable or equivalent replacement for “being there.” And this past May, once the mask ban was lifted and vaccination numbers were creeping upward, I (and I assume everyone else) was pumped for a return to “normal”–whatever that is anymore. But just as things were opening up, people were making plans, and bands were returning to the tour circuit, we had a regression: those vaccination numbers plateaued, and the delta variant came on the scene like a bat out of hell (pun intended, Wuhan). The thing is, the masses had already prepared themselves for the “return,” so there was no stopping it. Some more governmental bungling and you get us to where we are today; in some ways, not much different than we were 15 months ago.
I went to a few concerts in late July in the Red-state-northern Rockies and very early August in the Southeast (also Red) and Red-state Midwest, and while delta was certainly on the prowl by then, most (including me) didn’t really respect it. Shows with 10,000+ fans in attendance looked just like the 2019 summer; maybe 5% wore masks, and those were shed shortly after drugs and alcohol entered people’s systems. At the end of the month, things were a little different, though. Attending some more massive outdoor gatherings, this time on the West Coast (Blue state), there were considerably more people wearing masks (myself included), but in many ways the act of doing so was a sham. Not only because other safety practices were shed at the personal level, but because at the structural level nobody was attempting to make safe environments. For two nights in a row, I stood in a corral waiting to get into this overstuffed venue–it was butts-to-nuts for 30-40 minutes each night, and then virtually impossible to avoid coming into very close contact with others once inside. That it was outdoors certainly helped, and that the crowd trended heavily vaxxed did also (or maybe I’m just telling myself that), but close-quarters camping and shared bathrooms and showers on top of the freewheeling nature of being in a festival environment probably tipped the scales the other way. From sea-to-shining-sea, we’re living in a covid wasteland.
 This 21st Century version of a Pong virus ball is bouncing all over the world–don’t get in its path! (Image retrieved from https://unsplash.com/s/photos/covid, courtesy of Fusion Medical Animation)
I should add that on this last trip I had to fly across the country, and while the “experts” claim the air on planes is cleaner than in offices and on other forms of public transportation, there are still other manners of getting ‘rona on a plane. As a slight aside, I hate everything about the act of flying as it is, so add to that a greater disdain for my fellow passengers, an uncomfortable mask tied to my face for 5-6 hours each way, plus a fear of touching anything other than my own stuff, and it didn’t make for a very enjoyable vacation. I guess I signed up for it, though…
I don’t see this getting better anytime soon either. I hear the lambda strain is on the rise, and, of course, flu season is just around the corner, too. Time for a confession: I’m clearly not an anti-vaxxer (I got the weak-ass J&J jab), but I couldn’t tell you the last time I got a flu shot. Every time I was asked why not, I always said something along these lines: “I never get sick” or “They never get the right strain for the vaccine” or “If I got sick it wouldn’t be that bad”; all of which may be true (or close to true). But it does give me pause because I’ve said the same thing about the flu vaccine for years that people who don’t want the covid vaccine say now. So, what does that make me?
I guess it makes me have to reconsider–but let’s be honest, I probably won’t change my stance on the flu vaccine anytime soon. I also hemmed and hawed about the corona vaccine. I got it in March, mind you, but I was very wary of the MRNA versions, so felt lucky when my employer got the J&J “tried and true” technology–which obviously has turned out to be less so. I also claimed at that time that I would get the vaccine, for numerous reasons, but chief among them were that I anticipated that airlines and concert venues would require them; that is half true. I said I wouldn’t get a booster way back when (5 months ago) if they were recommended; now they are–and I likely will. But I’m also forced to wonder what will happen if the remaining 30% of abstainers never get vaccinated; will we all need seasonal jabs? If those fell out of favor for me with the flu, why wouldn’t they for covid, eventually? I’m a walking contradiction, no doubt, but I’m also beleaguered by society. That’s out of my control but certainly no reason to relinquish my responsibility… I went to a massive outdoor show in the Mid-Atlantic region in mid-August, and they asked for proof of negative test within 48 hours or a vaccination card, though they never matched the name on paper to the face on my ID. In the West, this was different, but with so many fake vaxx cards floating around, I guess it almost doesn’t matter, does it? I’ve seen some of my most virulently careful friends at the start of the pandemic become some of the laziest, most apathetic about it now. Where do I fit in? Well, I’m no longer double-masking, wearing gloves in the grocery store, or wiping down my groceries when I get home, and I’ve returned to in-person dining, so I guess I’ve let down my guard. Does doing so make me “one of them”? Eww, gross…
I used to be the type of person who would argue that famine, diseases and wars were good things because they helped keep population numbers down–I guess I still am. Just like Bob Barker said, “Have your pet spayed or neutered. Help control the pet population.” Though, I have come to accept that that is a pretty grim way to look at the world. That doesn’t mean my thinking has changed, just that I’m aware it’s not a very popular opinion to hold. Still, Darwin argues for the survival of the fittest; maybe thinning the herd Is natural, even if sad. I know what you’re thinking: I wouldn’t be saying this is if it happened to one of my friends or family members, and certainly not myself. You’re right: I would likely find that devastating. You’re wrong, too: I would still stand by my position. I had a professor once, a scholar of medical philosophy, who queried the class on the foolishness of saying “Why me?” when struck by a serious illness or trauma. Instead, he said we should be asking, “Why not me?”
We’re all here for a short time. Most of us will never know when our number is called. The only thing I can hope for is it goes quick. The only thing I ask for is that I have some control over it. Getting a deadly virus from a stranger is not entirely within my control, but my behaviors and decisions that factor into where I am and who I’m with do. So, I can take all the precautions I want, but are they really precautions if I’m still putting myself in harm’s way? No, probably not. But I–we–have all been restrained for “too long,” and I–we–are all greedy pigs who want what we want, when we want it. I want to go to concerts. I’ll just have to wait and find out if it was worth it. Covid wasteland, indeed. Will I be wasted, too…?
Marco Esquandoles
We’re All Wasted
- Here is a nice long list of technology advances for the month, so let’s jump right into it!
New device for capturing wave energy at a low cost.
Low-temperature technique developed to make thin metal coatings.
Technique developed to produce hydrogen gas from ammonia with low-energy inputs.
These carbon nanotubes can capture energy when embedded in cotton fabric.
Process to capture waste carbon developed by an American company.
New technique developed to convert ethanol to jet fuel with fewer carbon emissions.
Low-cost magnesium batteries closer to commercialization.
Stride forward in high-energy density lithium-metal batteries.
Advance in low-energy high-output water splitting.
More efficient thermal energy is now possible.
Clothes that make you stronger!
New liquid metal material harvests energy from movement.
These wood floors can also power a light bulb.
Lost-cost nickel and cobalt solution for electrolysis of water.
From smelly sewers to hydrogen gas.
A sweet solution to high-powered lithium-sulfur batteries.
 The NOAA extreme weather events map for August 2021 shows conflicting sea ice extents with near record coverage in Antarctica while in the Arctic Sea ice extents are near record lows. In the USA, 2021 tied with 1936 as the warmest summer on record.
- The August 2021 NOAA Global Climate report is out and yep, it was warm again in August. Just how warm was it? Well, it was the 6th warmest August on record with temperatures some 1.62°F (0.90°C) above the 20th Century average. And in fact, it was the warmest August on record over landmasses in the Northern Hemisphere at 2.59°F (1.44°C) above average.
- October 27th is National American Beer Day, so in honor of this foamy beverage, our Google search for the month was, “Beer and GIS.” And wouldn’t you know it, we found an academic publication on the topic by K. Elzinga et al. whereby they use GIS to track the spread of craft brewpubs across the USA, linking their growth to state-level demographic data. So, after you check out this paper, head to your local craft-beer pub for a few tasty, foamy treats!
- In September we were in Colorado for a review of the third largest city’s online GIS resources, Aurora, and for this month we move to the East Coast with a review of Hartford, Connecticut’s online GIS resources:
Hartford, CT GIS Website
Hartford, CT GIS Contacts
Hartford, CT GIS Web Map
Hartford, CT GIS Map Collections
Hartford, CT GIS Direct Downloads
Brock Adam McCarty
Map Wizard
(720) 470-7988
brock@apollomapping.com
 Join Callie Rodriguez and her robot friend, RT, as the explore the Moon. (Credit: NASA)
NASA has released a free graphic novel called First Woman, a fictionalized account of the first woman to explore the lunar surface and her robot sidekick, RT. The graphic novel follows Callie Rodriguez from a child dreaming of the Moon, to astronaut selection and then exploring the Moon. It comes as a free PDF, online read, an audio-only version and as an App. NASA is committed to making this fiction a reality in their upcoming lunar missions.
It’s difficult to imagine a future you can’t see. For young girls and people of color, historical underrepresentation in space aviation and exploration has left marginalized populations out of the equation in the US space program. If you can’t buy your way in with billions of dollars, then you have to rely on existing systems with inherent bias to let you in the door. NASA is attempting to balance the scales. We’ll have to wait and see if this comes to fruition and if its ethos applies to all areas within NASA, not just the ones who end up on camera.