
- I can’t wait to share this month’s list of technological advancements with you, so without delay let’s go!
This postage-size circuit can create energy from sunlight and carbon dioxide.
A new class of antibiotics is discovered.
This is a soft, squeezable battery.
Durable and efficient perovskite solar cells designed.
A new class of crystals could power future technology.
Did you know that plants can hear?
New material collects water without the need for energy inputs.
A glimpse at next-generation electric commercial airplanes.
And this super-charged fuel cell could power an airplane one day.
A step forward in green ammonia production.
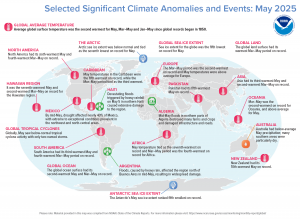
In May 2025, North America experienced its sixth warmest May and fourth warmest March-May period on record. The arctic sea ice extent was below normal and tied for the seventh lowest on record for May. Devastating floods triggered by heavy rainfall on May 5th in northern Haiti caused extensive damage to the region. By mid-May, drought affected nearly 40% of Mexico with extreme to exceptional conditions prevalent in the northwest and north-central areas. Floods caused by heavy rain affected the region north of Buenos Aires, Argentina in mid-May, resulting in widespread damage. Oceania saw its second warmest March-May on record with above average temperatures in May. (Image Credit: NOAA Global Climate Report)
- The Global Climate Change Report for May 2025 has been released by NOAA’s National Centers for Environmental Information and reveals further proof that global climate change remains a concern. May temperatures were much warmer than average across much of the globe, particularly across most ocean areas and parts of every continent. Higher temperatures were most notable in northern North America, the central and southern parts of South America, the British Isles and surrounding ocean, northern and southwestern Asia, and across much of Antarctica and the Arctic region. Despite the unusual warmth across much of the globe, record-warm temperatures were limited to parts of the Arctic region, the British Isles and surrounding ocean, southwestern Asia, across parts of the western Indian Ocean, the western Pacific Ocean, and a small area in Mexico. Overall, approximately 7% of the world’s surfaces hit a record-high May temperature. This percentage is the second-highest on record for May, following the all-time record of 15% set in May 2024. The global land-only surface temperature for May 2025 was also the second-highest in the 176-year record, with a temperature 1.61°C (2.90°F) higher than the 20th Century average. May 2024 was the warmest on record, with a temperature 1.63°C (2.93°F) higher than average. The global ocean surface had its second warmest May and March-May on record. The global ocean-only May surface temperature was 0.88°C (1.58°F) higher than average – also the second-highest for May in the 176-year record. Only May 2024 was warmer (+0.98°C / +1.76°F). May 2025 saw varied precipitation patterns globally. Many regions experienced drier-than-average conditions, including parts of North and South America, as well as northern Europe, southwestern Asia, southern Australia and areas in Russia and China. Southern Alaska, the eastern U.S., northern and southern parts of South America, northern and southeastern Australia and widespread parts of Asia had wetter-than-average conditions. Preliminary data indicates that the May 2025 globe land, averaged as a whole, had the wettest May in the historical record, which spans from 1979 to present.
- Summer is here and with it comes hordes of sunbathers seeking the sun’s rays to bask in. Many use what’s called the UV, or ultraviolet, index to determine if the sun’s rays are strong enough to lay out in and at what times. The UV index can be analyzed and visualized across different geographic locations, providing valuable information for public health and environmental studies. This helps in understanding UV exposure patterns, assessing risks such as for skin cancer, and developing targeted prevention strategies. Here is a quick summer of how GIS is used in conjunction with the UV Index:
Mapping UV Index Values:
GIS can map UV index data, creating spatial representations of UV radiation levels across regions, cities, and even city blocks.
Analyzing UV Exposure:
GIS can be used to analyze UV exposure levels based on factors like time of day, season, altitude, and cloud cover.
Understanding Health Impacts:
GIS can be used to link UV index data with health outcomes, such as sunburn rates, skin cancer incidence, and other UV-related health problems.
Public Health Planning:
GIS can help identify areas with higher UV exposure risks, enabling public health professionals to develop targeted education and prevention programs.
Environmental Studies:
GIS can be used to study the impact of UV radiation on ecosystems and other environmental processes.
Forecasting and Prediction:
GIS can be used to create UV index forecasts and predict future UV radiation levels based on various factors.
Public Health Education:
GIS can be used to create maps showing UV index values and recommend appropriate sun protection measures for specific locations.
Skin Cancer Research:
GIS can be used to investigate the spatial patterns of skin cancer diagnoses and identify potential environmental factors contributing to its diagnosis.
Environmental Monitoring:
GIS can be used to monitor UV radiation levels over time and track changes in UV exposure patterns.
Brock Adam McCarty
Map Wizard
(720) 470-7988
brock@apollomapping.com

Leave a Reply