If you thought that this was an invitation to a cool party, well no. But someone please take note, we need a Cocktails and Great Maps event. I feel like some mappy folks might be excited about it. If you’re following along with my column, you’ll realize that some inspiration or interesting fact crosses my mind or desk that spawns an interactive search for aha moments on the topic that is remotely spatial in nature.
Today’s inspiration felt like a reach at first. An article about wild chimps enjoying “boozy fruit” as part of their regular habits. Anna Bowland from the Centre for Ecology and Conservation at Exeter’s Penryn Campus in Cornwall said, “We also know that sharing alcohol–including through traditions such as feasting–helps to form and strengthen social bonds. So–now we know that wild chimpanzees are eating and sharing ethanolic fruits–the question is: could they be getting similar benefits?” It is interesting research and made me think. How much research and data is out there about alcohol and wine, and their consumption.
 Photo created in Canva.
Our chimpanzee friends prefer a natural process to create their “booze.” After a recent trip to the Texas wine country, I learned more about wine production than I had learned at other tasting experiences. The bottle of wine that you’re enjoying might have been produced from grapes in multiple locations, not just the winery of the label. I recommend signing up for an educational tasting experience with a sommelier and some friends. I learned more about the information on the label, the life of different types of wine, and how much to spend. To find an experience near you, check out WineMaps.com. You can filter by winery or wine bars globally. While I’m sure some fine wineries might not be represented here, it is one option to start planning that next wine trip. Old school maps might be your preference. If so, peruse the WineTourism maps available to download and print. They also have an interactive map where you can quickly zoom down to a winery and the cost of experiences there. If you’d prefer a more geographic approach to the information, “The Geography of Wine” shares some insights into wine regions and uses GIS to explore that data.
Perhaps wine isn’t your thing. If you enjoy an interesting cocktail, Taste Atlas has an interactive map showcasing the origin of global cocktails with links to recipes and ingredients. Each cocktail is also cross-referenced with other drinks of similar origin or ingredients. If you’d like to focus on the United States, the folks at VinePair have an interesting article about the birthplace of US cocktails like a cosmopolitan, lemon drop, rum runner, or sazerac.
Origins and social culture of regions vary. According to another article on vinepair.com, “in 2022 Americans consumed a whopping 7.9 billion gallons of alcohol via beer, wine, and spirits.” Global alcohol consumption data says our European friends lead the world in consumption per capita, and men surpass women; however, heavy drinker data takes us to the African continent. According to Worldmapper data from 2018, “The average Western European drinks over a third more alcohol than the average person living in any other region.” The cartograms on this site are particularly interesting…puffy maps. They are a great way to introduce data to non-GIS folks. It might make you look even smarter at the cocktail party!
Like a game of six degrees, boozy fruit eaten by chimps connects to a wine trip then grapes and geographic regions. That information sends us over to regional cocktails and then alcohol consumption data. Turns out geospatial connections are a little like Kevin Bacon (iykyk)!
Happy Summer! If you need me, I’m making a fresh batch of lemon martinis from my favorite recipe…just right for the hot July days.
Barbaree Duke
Geospatial Crusader
I have encountered many situations where the solution wasn’t readily available. Perhaps “the plan” didn’t pan out or something “broke.” What do you do? You find a fix, a reasonable conclusion, or a theory to try so you can move forward. I’ve been told that I am creative and innovative. While I noticed my idea might be unique in that circle of people, I often wondered if I had truly been creative or just survived the circumstance by working the problem with a viable solution. Maybe I just found a new problem that no one else noticed and sought to fix it.
This topic comes up often with a dear friend and collaborative colleague of more than 25 years. Together we have been labeled as “super creative…a dynamic duo.” We never see it that way. She says, “I have had to work at it. Everyone has creativity that comes out when given the right opportunities, and you surround yourself with people who allow you to be who you are and appreciate the talents and experiences you bring to the table.” I believe that we must acknowledge that personal perspective and a willingness to help find solutions drive how creative we become. Over time, you choose to improve that skill, or don’t.
 Image created by B. Duke in Canva.
In this article, “Creativity Can Be Learned,” creativity is defined as generating new ideas. In a fast-changing world, new ideas and solving problems becomes more important than just knowledge. Dr. Tina Seeling believes we can learn this skill. In her TEDXStanford talk, “A crash course in creativity,” she shares her conclusion that our individual attitude, knowledge, and imagination (imagination engine) combined with our habitat, culture, and resources are the key to unlocking personal creativity.
Unfortunately, our life experiences have squelched potential, even discouraged looking beyond the box, the right answer, or the minimum required. Sir Ken Robinson made a case several years ago for school undermining creativity. George Land said that creativity has been buried by rules and regulations. We understand the importance of innovation and creativity in GIS. In fact, geospatial technologies are a collection of tools we use to research, document, analyze, and visualize both problems and solutions.
How do you jumpstart your creativity? Steven Kotler shares these three science-based strategies:
- Make friends with your ACC. “Right before people viewed a problem that they’d eventually solve with insight, there was heightened activity in their brain’s anterior cingulate cortex (ACC). The ACC plays a role in salience and executive attention, and it’s the part that handles error correction by detecting conflicting signals in the brain.” The things we discussed in previous posts, will help fire up your ACC and in turn spawn your creativity.
- Understand the importance of time. “We need to build non-time into our schedules. Non-time is time for daydreaming and psychological distancing. Daydreaming switches on the default mode network, enabling our subconscious to find remote associations between ideas. Non-time also gives us a little distance from our problems. That allows us to see things from multiple perspectives, to consider another’s point of view. If we don’t have the time to get that space from our emotions and take a break from the world, then we won’t have the luxury of alternative possibilities.”
- Think inside the box. “That’s why one of my cardinal rules in work is: Always know your starts and your endings. If I have these twin cornerstones in place, whatever goes in between — a book, an article, a speech — is simply about connecting the dots. Without dots to connect, I can get stuck or waste time wandering into tangential territory (which helps explain why my first novel took 11 years to complete).”
Here are some things that help me “be creative,” when an answer doesn’t seem obvious:
- Phone a friend. Talk through the problem with a coworker or trusted friend. Two heads are most often better than one. Sometimes you just need to say it outloud, and bring it into the light for a new solution to make sense.
- Poll the audience. Crowdsourcing is almost “normal” today. With social media, forums, and open-source resources, you probably have good company in needing a solution.
- Research the topic. Often a simple internet search on the general topic leads me down a few rabbit holes of inspiration and enlightenment on the topic.
“Everyone has the key to their innovation engine, it’s up to them to turn it.”–Dr. Tina Seeling
If you need me, I’m already working on a new creative project!
Barbaree Duke
Geospatial Crusader
Something special happens to your brain when you become a “GIS person.” You think differently. You see patterns where others don’t. You notice connections more quickly. It changed your brain. Eventually, it will probably touch most people. It becomes hard to not see the shapes and networks that emerge.
Often when I describe GIS to regular folks, people that haven’t met GIS yet, as points, lines, polygons, and images that are connected to a place with data about or associated with that place. Consider your city a dot on the map. There are many details about your city, and therefore we can associate all those details with the dot on the map that represents your town. Because of the data associated with that dot and all the other city dots, we can look at a map and ask questions. How many dots are within a state? How many of those dots have 20k people or less? How many were founded before 1900? You and that favorite mobile device are a point with many gigs of tracked information. Your dot has become a line or route. Your dot crosses into a geofence or polygon that prompts interactions at a store. To the regular person, they can begin to imagine a map of city dots with different sizes to represent the population data. They think about walking into the store. As GIS professionals you get it. Have you thought about how the notion of a point or the power of a point has changed over time?
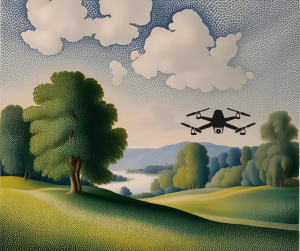 Image created in Canva–AI created background in Seurat style.
The power of the point could be aligned to art. Dots can be art. Pointillism began with Georges Seurat and Paul Signac in the late 1800s as they created collections of dots that formed an image like seen in “A Sunday on La Grande Jatte.” The fascination and creativity to give meaning and purpose to a dot as a collective artwork was cutting edge. Even if you’re not an art person, this should appeal to the modern GIS-er. Dots in mass become hotspots. Can you imagine if we processed Seurat’s painting as locations and ran hotspot analysis? Glowing people and animals would emerge.
Thanks to lidar and photogrammetry tools, points aren’t just cities or objects. Landscapes, anything really, can be measured and documented as a point cloud. I imagine that Seurat would have loved this concept. Dots become sculpture with the help of drones and other cool tools!
Now, “art” is 3D. We fly through landscapes, see details that are humanly impossible to reach or very unlikely and dangerous to capture by human hand. A recent Titanic digital twin was created and showcased in a National Geographic documentary, “amounting to 16 terabytes of data (equivalent to the hard drive footprint of six million e-books).” Researchers and subject matter experts dispelled myths associated with the Titanic. They helped prove personal accounts that had been dismissed to create an even more realistic interpretation of what happened April 15, 1912. Points changed history again.
The points of the cloud, the dots on the map, your destination, or the point you’re making in your presentation…all important. I’m reminded of the poem by Linda Ellis, “The Dash Between,” that shares the importance of the dash on a tombstone and what it really represents. The power of that dash is like the power in a point to tell a story, mark a moment, inspire a crowd, or right a wrong. Let’s continue to put our points to work and make a difference!
If you need me, I think that I will dust off my watercolor tools and get artsy to add some creativity to my dot.
Barbaree Duke
Geospatial Crusader
 Screenshot of Fahlo app.
Your sense of place starts early. Think about your childhood neighborhood. Scale isn’t important at that age, and concepts of near and far evolve as you grow. When recalling your neighborhood, what locations or landmarks stand out? How do you give directions to a friend–by landmarks or using street names and cardinal directions? Does the address matter, or is it just about finding the destination?
During a recent visit to my local zoo, I noticed a geospatial product available in the gift shop–an elegant bracelet adorned with a carved animal charm that claims to track an individual animal. A friend of mine owns one featuring a giraffe that she monitors. The giraffe, named Bilan, provides daily location updates to support conservation efforts. It is remarkable to observe the extensive distances covered by a single giraffe. Naturally, this made me think, other than your steps via your watch or NORAD keeping a close eye on Santa on December 24th, “How many things are tracked?”
 Screenshot of a Moveback map of the Eastern Wild Turkey in Alabama.
For the animal enthusiasts, consider exploring Movebank. They offer a collection of data and map interfaces tailored for tracking animals. This site provides data on various species, such as the northern bald ibis in Africa or the eastern wild turkey in Alabama. Each point, when clicked, displays the movement path of that bird or animal. The collection is replete with research, tracks, and downloadable data. Although the interface is minimalistic and could be improved with enhanced imagery, it effectively allows users to explore information before integrating it into their own projects. There’s much to explore. It’s like Geo-Alice saw a screen that said, “Click me!”
Perhaps space and the stars capture your attention. Check out SkyLive’s planetarium to track where you are compared to the sky above. While not radically new, it does help us connect to spaces and science beyond our visual scope. They also have a ton of other space-based content to explore and track.
Care about trees? Organizations like Veritree, Greenstand, Trees That Feed and others are helping to plant trees globally by partnering with businesses and individuals. Veritree is using some of our favorite geospatial technology (LiDAR, satellite imagery, and drone data) to track progress and share that data on dashboards. Like many great ideas, they share how a cool idea to connect clothing and planting trees led to their work today.

Feeling grounded and connected to a place gives us some significance, maybe even comfort. This might explain the shame linked to homelessness, the unease of being between homes, or living out of a suitcase. There’s no place like home.
The environments we create and curate within our homes reflect our identities and values. They become an extension of who we are, a canvas where our tastes, passions, and histories are displayed. The shared experiences within its walls and beyond weave a tapestry of connection and community, enriching our lives in immeasurable ways.
Ultimately, the true value of a home lies not in its size or its grandeur, but in the love and care that fill its spaces. It is the feeling of being welcomed and cherished, of having a refuge from the outside world where we can be our most authentic selves. In this sense, a happy home is more than just a place–it’s a state of being, an essential ingredient for a fulfilling and balanced life.
If you need me, I’ll be at the firepit enjoying some marshmallows, gazing into the night sky, and contemplating, “How many more trees I can plant in the yard without my husband noticing?” It’s for a good cause!
Barbaree Duke
Geospatial Crusader
It’s carnival season! In the Gulf Coast states, we’re thinking of beads, king cake with a hidden baby, and fun parades with throws for Mardi Gras, but seasonal celebrations aren’t something new, nor exclusively southern. Big secret: when we moved to southeast Louisiana in the 2000s, I really didn’t know much about Mardi Gras or Carnival season, and was surprised to learn it was tied to religion. It seemed a little funny to me that the year’s biggest party was followed by the year’s longest penance. According to Meertens, “From an anthropological point of view, Carnival is a reversal ritual, in which social roles are reversed and norms about desired behavior are suspended.”
Evidence of these types of celebrations globally is replete. On the Gulf Coast of the United States, Mardi Gras, as we know it, began in 1703 in Mobile, Alabama. While the Louisiana folks claim 1699 somewhere south of New Orleans as the beginning, neither city can beat what archeologists have found in Brazil. They have evidence of similar celebrations from 2,300 to 1,200 years ago near Pelotas. “The researchers tentatively identified some of the earliest evidence of alcoholic drink production in the region, with cutting-edge analysis of the pottery revealing traces of beverages made using vegetables–likely to have been tubers, sweet corn and palm. Other pottery fragments contained evidence of the processing of fish.” These celebrations have long histories with amazing food, dance, artists, and music.

The globe is glowing with traditions that make each celebration unique. Masks are popular adornments for parades and parties. One of those traditions started with the Ancient Romans’ masks which really took off in the 15th Century. The NEA National Heritage Fellows highlighted many talented artisans such as Juan Alidato in Puerto Rico for his masks and Allison “Tootie” Montana for her costumes in New Orleans.
Carnival in Rio de Janeiro credits their celebratory beginnings to Greece. Catholicism and later African dance influences helped morph the event into the world class party it is today. Quebec’s Winter Carnival tradition of the arrow sash is traced to aboriginal roots. Trinidad and Tobago credits French immigrants’ masquerade balls and their slaves in the 1780s for starting the experiences they have today. Venice’s Carnevale di Venezia became an official public event in the 1200s, but Napoleon abolished it in 1797. It was revived in 1979 and their masks, the “papier-mâché and ribbons have not been replaced by plastic, and each product is a true masterpiece, created with patience and attention to details.” These masks, costumes, and dances together tell important stories in their communities: speaking against slavery, highlighting roles of women, reenacting hunters, and food preparation.
Celebratory traditions have been part of the human community fabric for many millennia. If we strung all these place markers and their origins together on a map with explanations, it would resemble a crime solving board of suspects and clues. These connections remind me how beautifully interconnected our histories in human civilization are. We do not have traditions without deep ties to influencers both human and natural. I hope that we can continue to embrace the good in our world and each other while celebrating with joyful abandon.
If you need me, I’ll be working on my samba moves and bead catching techniques.
Barbaree Duke
Geospatial Crusader
3D is often part of a WOW moment whether you’re looking at data skyscrapers populating the globe or flying through a digital twin of your favorite city. GIS and 3D, once a couple of cool kids in the same class, are now grownup business partners changing how we visualize data. It was and remains… impressive!

If you introduce aerial photography to someone, the first place they want to see is home. Many years ago, I was teaching a group of teachers about geospatial technologies that were ready to integrate into their classrooms. I led them through a variety of tools, one of which was a very new Google Earth (long before Facetime), freshly renamed from Keyhole. When opening the software for the first time, many teachers were dazzled like a kid on Christmas morning. One teacher replied, “It looks so real…like we’re really flying!” She then proceeded to find “home,” her beloved grandmother’s house. The next encounter with the map I had not seen before, or frankly since. She got as close as she could to the screen and began waving and shouting, “Hey Grandma! Can you see me!?! Here I am!” Now, in 2025, this feels unbelievable. You’re probably laughing. I assure you that it’s a true story. So how much of what we “see” online and in data is REAL?
By the title, you might have been expecting some reminder of planes taking photos or the aforementioned Keyhole that became Google Earth. Or, perhaps you were thinking of something out of Pixar studios. You’d be incorrect on both counts. Archeologists have proof that the world’s oldest 3D map, carved into stone, is in France dating to 13,000 years ago. Anthony Milnes, a study co-author and a geologist at the University of Adelaide in Australia, said in a statement, “What we’ve described is not a map as we understand it today–with distances, directions, and travel times–but rather a three-dimensional miniature depicting the functioning of a landscape, with runoff from highlands into streams and rivers, the convergence of valleys, and the downstream formation of lakes and swamps.” Our need to map and inform others of natural phenomena has existed for a very long time.
This discovery made me think about the experience of touching the map to make it more realistic. Perhaps the scale helps our brain appreciate how tall or how far. In a computer-driven world, that experience can get lost. One way to experiment with 3D, scale, and our impact on environments is the Augmented Reality Sandbox. Playing in the sandbox isn’t just for kids. This representation can allow even professionals to plan and test the impact of moving and changing natural topography. We can all appreciate the need to understand our environment deeply to avoid or manage natural disasters.
Looking for new resources? If you would like to experiment with a computer map, check out the National Library of Scotland’s Georeferenced 3D Maps Viewer. You can fly around Scotland and test quickly the impact of exaggeration on the map.
I wonder. What would Lewis and Clark have to say about these things? As their explorations took them by the Cahokia Mounds? What might they have imagined about the ancient culture that moved earth to create a system of mounds, always near a water source? Were they planning for floods, or just liked standing on higher ground? Even our landscapes tell stories.
As you go about your GIS work, integrating stunning imagery and configuring the perfect 3D environments, think about the story that will linger as our world changes. The paleolithic people left us map stories and so much more. What stories will you create this year?
If you need me, I’ll be planning a “3D masterpiece” for the backyard, also known as my garden.
Barbaree Duke
Geospatial Crusader
It’s the season of renewal. The gyms will be more packed this month. Closets will be looking more organized. The word “resolution” will be filling the air and your social media feeds. One of my favorites is the embrace of a focus word for the year to create positive change, much like a mission statement. Can that one word help change the way you think? Can you learn to think more effectively? Is all that multitasking making you think better?

Since the beginning of my career, I have been fascinated with the brain and how we learn. As an educator, understanding the brain helped me make more effective opportunities for my students, appreciating unique qualities and needs in each student. I also appreciate the power of choosing to think positively. If you start a bit of research, the subject of thinking is like falling down Alice’s rabbit hole. I’ll save you some trouble and encourage an exploratory trip on the subject with the hope that your new year begins with positive thoughts.
Be open-minded. GIS work often involves a process that requires open communication between different organizations. James Clear says, “World-class thinkers are often silo-free thinkers. They avoid looking at life through the lens of one subject.” Multiple perspectives help us think and sort through ideas and connections. Perhaps geospatial professionals have a head start.
Perspective matters. Your reality matters. We create mental models of thought as we gain life experience and expertise. An article about how to train your brain says to “consider this example from biologist Robert Sapolsky. He asks, “Why did the chicken cross the road?” Then, he provides answers from different experts.
- If you ask an evolutionary biologist, they might say, “The chicken crossed the road because they saw a potential mate on the other side.”
- If you ask a kinesiologist, they might say, “The chicken crossed the road because the muscles in the leg contracted and pulled the leg bone forward during each step.”
- If you ask a neuroscientist, they might say, “The chicken crossed the road because the neurons in the chicken’s brain fired and triggered the movement.”
Technically speaking, none of these experts are wrong. But nobody is seeing the entire picture either. Each individual mental model is just one view of reality. The challenges and situations we face in life cannot be entirely explained by one field or industry. All perspectives hold some truth. None of them contain the complete truth.” If you want to change or improve your perspective, you’ll need to allow room for other points of view and how they can connect to your experiences, even small ones.
Focus. The focus on a single concept or idea gives your brain the ability to make stronger connections. It’s what helps you find those patterns and identify important intersections in data. One way to help focus and “engage with an idea is to write about it.” Score one for all those bloggers and keepers of the post-it note collections. The more that we practice communicating and organizing what we learn, the more effective our thought process. Word of caution, in spite of our deep desire to multitask, this blog shares a collection of research that says multitasking impairs quality thinking. The old adage of one step at a time is indeed timeless and effective.
Be kind to yourself about where you’re starting this year in thought and goals. We live in a noisy world. Mats Lederhausen in his learning to think blog says, “… in a world of distraction, inundation, and short-termism, I think it’s choosing what to think that matters more. It would benefit us all to harness the discipline and intention to focus our own thoughts on matters that give us energy and bring us joy.” I like that idea. In as much as we might want to improve thinking, a simple focus, thoughtful communication, and a kind perspective can foster our refinement.
If you need me, I’m avoiding my propensity to multitask and hoping to find a way to decide on this year’s word. At the moment, “encourage” is winning.
Barbaree Duke
Geospatial Crusader
How do you feel about puzzles…things like word search, find the missing items, etc? My Dad, a car mechanic and avid fisherman, was drawn to puzzles. He couldn’t get enough of them, getting lost for hours in putting each piece in its perfect spot. Maybe it’s the sense of accomplishment that your 1000 pieces match the photo on the box or the calmness of focusing on a singular task, an extremely spatial task.
Like I mentioned last month, making things is fun for me and puzzles are an easy connection to that pastime. I didn’t realize it but all those puzzles that I loved as a kid and then those years in high school marching band…all paved the way for my proclivity for geospatial technologies.
 The iconic Stonehenge in England as imaged by Pete Linforth from Pixabay.
My brain, even my physical body, was trained to be more spatial than some of my peers. Does that make me smarter? Probably not, but it is sometimes perceived that way as those people that easily can mentally move things around and envision how all the things will fit in a prescribed space.
Let’s look at loading a dishwasher. The manual might make some recommendations, but rarely do two people perform that task the same. I always put the cups on the top rack and the plates lined up parallel to the utensil basket; however, my husband has a radically different approach. He loads according to what he picks up first without a visual layout. I learned long ago from a wise friend to never complain or micromanage when partners voluntarily help with household tasks. Both ways are fine! The dishes are clean. There are occasions where spatial planning matters like building things. Imagine what Stonehenge might have looked like without some careful spatial planning. Even a replica like the one near my home takes some thought.
According to Frontiers for Young Minds, “We use spatial thinking to understand the location (position) and dimensions (such as length and size) of objects, and how different objects are related to each other. It is important to understand that spatial thinking is not just one skill, but a set of different skills.” When experts begin to outline the different spatial measures (mental rotation, disembedding, spatial scaling, and navigation), all I see is geospatial technology. Diana Sinton wrote, “‘Geospatial’ sets a scale that limits spatial to the domain of the Earth and the human activities on it.” Turns out whether geospatial or just spatial, it is a set of skills that you can improve.
How do you become better at spatial tasks? According to Healthline, there are some recommendations:
- Pick up a new hobby. Hey, we talked about this last month! “Hobbies like photography and drawing help promote spatial awareness.”
- Try video games. “Focus on games where you manipulate and move objects. For example, an older study found that playing Tetris improved spatial skills in older adolescents.”
- Take time to play. “As in children, various games or activities may help improve spatial awareness, such as putting together puzzles, trying out visual memory games, and playing chess.”
- Stay active. “Exercise is good at any age. A 2014 study found that resistance exercise might help improve spatial awareness in older adults.”
Celebrate your spatial self! It might be time to get outside, take some photos and be active, plan a game night, or go beyond your comfort zone. If you need me, I’ll be with my friends on Fridays at game night. You need to stay spatially sharp!
Barbaree Duke
Geospatial Crusader