
If you are searching for medium and high-resolution satellite imagery, the search is over as Image Hunter is the solution you’ve been looking for! Featuring satellite and aerial imagery as well as digital elevation models (DEMs) from a constantly expanding list of 60+ constellations/datasets and 19 vendors, our database contains more than 200-million images/records meaning there is just no other website out there with this breadth of commercial data products. Our interface is slim-lined and modern, loading quickly on all platforms, browsers and operating systems. Further, our database is updated multiple times an hour with the most recent images collected by WorldView-3, Pléiades 1, PlanetScope, SuperView-1 and many more so you are sure to get the most current view of all the imagery and DEM databases we work with. Once you submit your request, an Apollo Mapping representative will be in touch within 4 Colorado business hours to get you the pricing information you need for your project.
So why wait? Give Image Hunter a try now to find the imagery and/or DEM data you need for your next mapping project!
Key Improvement(s) From The Past Month
You might not know this new acronym, WBFB, as well we made it up, hehe. But it means We Be Fixing Bugs, which is what we did for the past month again. We promise we will be moving on to more exciting items but all in due time!
Here is a summary of the changes/improvements we made to Image Hunter during the past month:
- We blocked another wave of bots that were slowing down the system for everyone, bad little bots they were!
- Improved the handling of digital elevation models (DEM) and other metadata in persistent URLs.
- Restored Formosat-2 and Formosat-5 previews.
- Turned off some unnecessary backend functions that also slowed the system for our users.

Data Alert–An Automated Daily Imagery Search
Have you checked out Data Alert which lets you define an area of interest anywhere around the globe, the resolution your project requires and the number of months we should keep the alert active? Once an alert is set up, we check for new data over your area of interest every single day, and send you an email when we find coverage that meets your specifications. We have a short YouTube video with directions to set up a Data Alert, check out the last video; and we have written directions for Data Alert here.
The Sensors Available in Image Hunter
As you might have seen in past articles, we now feature hourly updates (seriously!) of GaoFen 1/2, GeoEye-1, KOMPSAT 2/3/3A, Pléiades 1 and Neo, SPOT 6/7, SuperView-1, TripleSAT, WorldView-1/2/3/Legion and ZiYuan-3!
Image Hunter can be accessed 24 hours a day, 7 days a week and is a one-stop shop for every major source of medium and high-resolution satellite (and aerial!) imagery on the market today, including:
- WorldView Legion
- WorldView-4
- WorldView-3
- WorldView-2
- WorldView-1
- QuickBird
- GeoEye-1
- IKONOS
- EROS B
- KOMPSAT-3A
- KOMPSAT-3
- KOMPSAT-2
- Pléiades 1 constellation
- Pléiades Neo constellation
- TerraSAR-X (TerraSAR-X, TanDEM-X and PAZ)
- GEOSAT-1
- GEOSAT-2
- TripleSat
- BJ3A
- BJ3N
- SPOT 1 to 7 constellation
- RapidEye
- GaoFen-2
- GaoFen-1
- ZiYuan-3 01/02 (mono and stereo!)
- FORMOSAT-5
- FORMOSAT-2
- ALOS PRISM (stereo)
- AW3D Standard (DEM)
- SkySat constellation
- PlanetScope constellation (including 5-band SuperDove data)
- SuperView-1 constellation
- SuperView-2
- SuperView NEO-1 01/02
- Landsat 1-8
- TeLEOS-1
- Hexagon (HxGN Content Program aerial imagery) imagery + DEM
- WorldDEM
- WorldDEM Neo
- Vricon DEMs
- Orbita Hyperspectral Satellite (OHS)
- KazEOSat-1
- KazEOSat-2
- Jilin-1 Optical
- Jilin-1 Video (including nighttime imagery)
- Jilin-1 GF/DP
- Jillin-1 KF
- Orbita Video Satellites-1/2/3 (OVS-1/2/3)
- BlackSky Global series
Key Features of Image Hunter
If any of our readers have struggled with other geospatial search engines that are clunky, only query one data source and/or do not provide image previews, then Image Hunter is the solution to your woes as it features:
- Online browsing of satellite and aerial imagery from 19 data providers and 56 satellite and aerial imagery derived datasets.
- Near-instantaneous loading of low-resolution preview imagery with collection date, cloud cover and other key metadata.
- The ability to define your area of interest by address, coordinates, geometric shape or shapefile/KMZ.
- A responsive basemap with street names to provide spatial context when discovering data as well as crowd-sourced updates for the most accurate map possible.
- Exports of the area of interest you create as well as the scenes you select in shapefile or KMZ format.
- Support for all operating systems, and not just our friends with Windows machines!
Image Hunter can be accessed here all day and night, we are excited to find out what you think about our imagery search engine! So if you have any ideas and/or feedback to improve Image Hunter, please let us know at sales@apollomapping.com or (303) 993-3863.
- Are you ready for a massive list of fun technological advancements?! Even if not, here we go 😊
Four-dimensional crystals could improve imaging systems.
Electronic memory speed could get a big boost soon.
Making a key fertilizer from thin air.
Improved material for carbon dioxide capture.
From electronic waste to a catalyst to capture carbon dioxide.
New, non-metallic conducting material for nano-electronics.
This is a biodegradable, fungi-based battery!
Buildings could help us store carbon in the future.
Filter that captures 99% of aluminum in industrial waste water.
Graphene altered so it can be used in filtration and sensing.
A reusable and biodegradable alternative to superglue.
This sustainable wall coating holds moisture in too.
Using microwaves to make hydrogen fuel.

North America had its warmest year on record. Hurricane Helene was the deadliest Atlantic hurricane since 2017 and the deadliest hurricane to hit the continental U.S. since Hurricane Katrina in 2005. Hurricane Beryl became the first Category 4 hurricane in the Atlantic Ocean in June. Severe drought conditions affected large parts of South America. Australia had its second warmest year since national records began in 1910. An extreme rain storm in the Persian Gulf region in April brought a two-year rain deficit up to normal in 24 hours. Typhoon Yagi struck as a Category 4 storm and was one of the strongest typhoons to hit northern Vietnam and southern China in record history. (Image Credit: NOAA Global Climate Report)
- The annual Global Climate Change Report for 2024 has been released by the National Centers for Environmental Information and it reveals further proof that global climate change remains a very serious concern. The year 2024 was the warmest year since global records began in 1850 at 1.29°C (2.32°F) above the 20th Century average of 13.9°C (57.0°F). In total there were 14 straight months of record-breaking global temperatures from June 2023 through July 2024. Global ocean temperatures in 2024 were also noteworthy, reaching 15-straight months of record-breaking temperatures, from April 2023 through June 2024. The 2024 Northern Hemisphere surface temperature also was warmest on record, 1.67°C (3.01°F) above average. The Northern Hemisphere winter, spring and summer seasons were each warmest on record. Below-average annual precipitation occurred in areas that included much of Canada extending into parts of the western U.S. and Mexico. The most expansive and severely drier-than-average conditions occurred across much of South America. In contrast, anomalously high precipitation fell in areas that included a large part of the African Sahel, where record and near-record conditions were widespread.
- February is a month for love, relationships, chocolates, dinner and wine. Geographic information systems, or GIS, are often used by viticulturists to guide them as they raise grapes in the vineyard that are used to make wine. GIS can incorporate a wide array of information about vineyard blocks (cultivars, rootstocks, irrigation, fertilization, crop production, soils, slope, history, etc.) that when combined with high-resolution aerial or satellite imagery can provide clues to understanding differences in vine performance that might not be obvious in the field. Symington Family Estates produces some of the top port wines of the world. Located in the Douro River Valley in Portugal, it uses GIS technology for viticulture management, which has led to significant improvements in wine quality. The use of GIS helps with the tight sequencing of the harvest and allows winemakers to conduct detailed analysis of productivity levels and see where improvements can be made. Symington’s winemakers record the changing conditions and the corresponding health of the grapes and soil by using an enterprise GIS. It allows them to track the variables for each of the family’s 27 estates. Their R&D team assess the health and ripeness of every bunch of the 53 grape varieties grown in the vineyard, and tracks this information in a GIS (along with the maturation date); they call it the Grape Library project. The Grape Library is used to create maps that guide field crews across each winery. Through GIS, viticulturists manage the health of the soil, ensuring its fertility for future crops. GIS also helps them implement strategies aimed at mitigating the impacts of climate change on their vineyards. Using GIS to analyze the different parameters affecting soils allows the vintners to make informed decisions on how to improve and maintain the quality of the soil at their 27 estates, too.
Brock Adam McCarty
Map Wizard
(720) 470-7988
brock@apollomapping.com
3D is often part of a WOW moment whether you’re looking at data skyscrapers populating the globe or flying through a digital twin of your favorite city. GIS and 3D, once a couple of cool kids in the same class, are now grownup business partners changing how we visualize data. It was and remains… impressive!

If you introduce aerial photography to someone, the first place they want to see is home. Many years ago, I was teaching a group of teachers about geospatial technologies that were ready to integrate into their classrooms. I led them through a variety of tools, one of which was a very new Google Earth (long before Facetime), freshly renamed from Keyhole. When opening the software for the first time, many teachers were dazzled like a kid on Christmas morning. One teacher replied, “It looks so real…like we’re really flying!” She then proceeded to find “home,” her beloved grandmother’s house. The next encounter with the map I had not seen before, or frankly since. She got as close as she could to the screen and began waving and shouting, “Hey Grandma! Can you see me!?! Here I am!” Now, in 2025, this feels unbelievable. You’re probably laughing. I assure you that it’s a true story. So how much of what we “see” online and in data is REAL?
By the title, you might have been expecting some reminder of planes taking photos or the aforementioned Keyhole that became Google Earth. Or, perhaps you were thinking of something out of Pixar studios. You’d be incorrect on both counts. Archeologists have proof that the world’s oldest 3D map, carved into stone, is in France dating to 13,000 years ago. Anthony Milnes, a study co-author and a geologist at the University of Adelaide in Australia, said in a statement, “What we’ve described is not a map as we understand it today–with distances, directions, and travel times–but rather a three-dimensional miniature depicting the functioning of a landscape, with runoff from highlands into streams and rivers, the convergence of valleys, and the downstream formation of lakes and swamps.” Our need to map and inform others of natural phenomena has existed for a very long time.
This discovery made me think about the experience of touching the map to make it more realistic. Perhaps the scale helps our brain appreciate how tall or how far. In a computer-driven world, that experience can get lost. One way to experiment with 3D, scale, and our impact on environments is the Augmented Reality Sandbox. Playing in the sandbox isn’t just for kids. This representation can allow even professionals to plan and test the impact of moving and changing natural topography. We can all appreciate the need to understand our environment deeply to avoid or manage natural disasters.
Looking for new resources? If you would like to experiment with a computer map, check out the National Library of Scotland’s Georeferenced 3D Maps Viewer. You can fly around Scotland and test quickly the impact of exaggeration on the map.
I wonder. What would Lewis and Clark have to say about these things? As their explorations took them by the Cahokia Mounds? What might they have imagined about the ancient culture that moved earth to create a system of mounds, always near a water source? Were they planning for floods, or just liked standing on higher ground? Even our landscapes tell stories.
As you go about your GIS work, integrating stunning imagery and configuring the perfect 3D environments, think about the story that will linger as our world changes. The paleolithic people left us map stories and so much more. What stories will you create this year?
If you need me, I’ll be planning a “3D masterpiece” for the backyard, also known as my garden.
Barbaree Duke
Geospatial Crusader

Cricket’s Chirp is created for Apollo Mapping by Ron Ruelle, a Wilmington, NC (formerly Boulder, CO) based cartoonist, lllustrator and teacher. No animals are harmed in the creation of these comics, but Ron sometimes breaks a pencil in frustration. You can see more of his work at www.ronruelle.com
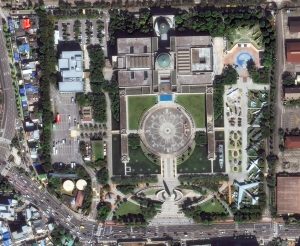
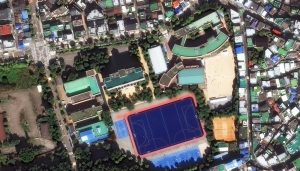 Seoul, the capital of South Korea, is a huge metropolis where modern skyscrapers, high-tech subways and pop culture meet Buddhist temples, palaces and street markets. Seoul’s history traces back to 18 BC when it was founded by the people of Baekje, one of the Three Kingdoms of Korea. Seoul is geographically set in mountainous and hilly terrain. Seoul has embraced a surge in modern architectural development, with iconic landmarks including the N Seoul Tower, the 63 Building, the Lotte World Tower, the Dongdaemun Design Plaza, Lotte World, the Trade Tower, COEX, IFC Seoul, and Parc1. Seoul was named the World Design Capital in 2010 and has served as the national hub for the music, entertainment, and cultural industries that propelled K-pop and the Korean Wave to international prominence. The 30-cm WorldView Legion image featured here was collected on October 4, 2024, and has custom processing and color balance applied by Apollo Mapping. (Satellite Imagery © 2025 Maxar Technologies)
In this monthly article, we travel the world to check out unique, fun and sometimes a bit weird 30-centimeter (cm) color imagery samples from the WorldView constellation. In January, we marveled over images of Chalet Zermatt Peak in Switzerland. For this edition of the 30-cm Color WorldView Image of the Month, we feature our first Legion images in this series from Seoul, South Korea.
30-cm WorldView-3 (WV3) launched in late 2014, WorldView-4 (WV4) launched in late 2016 and then the first WorldView Legion satellites launched in 2024. Taken together, this is the most advanced satellite constellation the commercial marketplace has ever had access to. Here are a few of the features that really set these satellites apart from the competition:
- Improved Resolution
- Higher resolution means you can see more detail in WorldView imagery
- Data collected at nadir will have 31-centimeter (cm) panchromatic, 1.24-meter (m) visible and near infrared, 3.7-m SWIR (WV3 only) and 30-m CAVIS (WV3 only) bands.
- Additional Spectral Bands
- If spectral analysis is part of your project, then no other satellite can match WorldView-3 and WorldView Legion with their 8 bands of visible and near-infrared data; and then 8 shortwave infrared bands (WV3 only) which are crucial for geological studies.
- Better Positional Accuracy
- With accuracies of 3.5-m CE90% or better (without ground control even!), the 30-cm WorldView constellation has no rivals for its enhanced positional accuracy.
- Daily Revisits
- With multiple WorldView-3 and WorldView Legion satellites orbiting our planet, daily revisits are available for most locations.
- WV4 is no longer collecting new imagery.
- Increased Collection Capacity
- WV3/4 feature 13.1-km swath widths (at nadir) with the ability to collect up to 680,000 square kilometers (sq km) of high-resolution data per day per satellite (though WV4 is dead now).
- When fully launched, WorldView Legion will feature six 30-cm satellites, significantly boosting the collection capacity of this leading high-resolution constellation.
If you are interested in WorldView-3, WorldView-4 and/or WorldView Legion imagery for your next project, please let us know by phone, 303-993-3863, or by email, sales@apollomapping.com.
You can also find more WV3 samples and technical information on our website here; WV4 samples and information can be found here; and then finally here is more information about WorldView Legion.
In this monthly feature, we span the globe to examine Our Changing Landscape with a time series of medium-resolution PlanetScope satellite imagery. The PlanetScope constellation dates back to 2016 and collects hundreds of millions of square kilometers of four and eight-band 3-meter imagery daily! In January, we looked at the aftermath of Hurricane Helene and the widespread path of destruction she left behind in Asheville, N.C. For the February edition of this series, we are sliding into Colorado where the first major winter storm of 2024-2025 dumped nearly 3 feet of snow and shut down most major highways in the state with blizzard-like conditions.
 Click on the image above to see an animation of 3-meter natural color PlanetScope image collected over the Idaho Springs, Colorado area on November 2 and 10, 2024. And wow what a difference a day makes as you can see that before the November 8, 2024 snowfall, this region was still in full, early Fall mode! (Images Courtesy: © Planet 2025)
The PlanetScope Microsat Constellation
PlanetScope is a constellation of more than 240 microsats referred to individually as Doves. Each Dove is able to collect up to 20,000 square kilometers (sq km) per day of 3-meter (m) 4-band multispectral (i.e. blue, green, red and near-infrared [NIR]) imagery; and newly launched SuperDoves collect 8-band multispectral adding in valuable red-edge spectral data. Across the constellation, PlanetScope is archiving more than 200 million sq km of medium-resolution imagery a day, making it the go to source for daily imagery over most locations. This massive archive dates back to 2016, offering the most complete and continuous record of spatial data on the planet since the start of the constellation’s ongoing launch schedule. Collecting 3-meter multispectral imagery is the equivalent of ‘high-resolution’ multispectral data imaged by a 75-centimer (cm) satellite (as this satellite would feature 75-cm panchromatic and 3-m multispectral), making PlanetScope an extremely competitively priced option at just $2.25 per sq km. With well registered images and nearly daily collections of most locations, PlanetScope is the ideal imagery source for this current-events focused series, Our Changing Landscape.
First Winter Snowstorm Buries Parts of Colorado
On November 8, 2024, Coloradans found themselves digging out of a whopping 3 feet of snow that fell between the Front Range and Eastern Plains. After five days of nearly non-stop snowfall, Colorado had to deal with its largest November snowstorm in decades. The snow stopped falling on Saturday after overnight blizzard-like conditions made travel impossible.
Government offices, schools and even some businesses closed that Friday. Governor Jared Polis declared a disaster emergency for the storm, authorizing the Colorado National Guard to step in and help impacted people; and he also activated the state emergency operations center. Denver received 9” (inches) of snow with 13” reported in Aurora and 15” in Highlands Ranch and Lakewood.
This last round of heavy snow developed in the morning hours of November 8th and continued through the early morning hours of November 9th. Additional accumulations during this period topped a foot of snow over the far southeast portions of the Denver metro area through much of rural Arapahoe, eastern Douglas and Elbert counties. This round of snow was very heavy and wet, and resulted in scattered power outages. Around 30,000 customers were without power in the Denver metro area on the morning of November 9th. Meanwhile, major interstates (I-70 east of Denver) and most highways remained closed in east-central Colorado. It took days to reopen some rural roads.
The storm’s impacts were not limited to the ground as travelers passing through Denver International Airport faced more than 1,300 canceled or delayed flights on Friday, including 269 canceled SkyWest flights, 127 canceled Southwest flights and 64 canceled Frontier flights.
If you would like to find out more about using 3-meter PlanetScope imagery for your academic studies, engineering projects or any landscape analysis, let us know at sales@apollomapping.com or (303) 993-3863.

We love maps.
We love imagery.
We love work breaks.
We hope you like them as well!
The biggest celebration of Carnival in the world will take place February 28 to March 8, 2025 with an estimated 2 million flooding the streets each day. Held in Brazil, Carnival has been labeled The Greatest Show on Earth.
Whether you’re planning a once in a lifetime trip down south to celebrate or plan to observe the festivities from home, we have an image you’ll surely appreciate. For this month’s Imagery Work Break, we feature a 30-centimeter Pléiades Neo 4 image from February 12, 2024, that was taken over Rio de Janerio during Carnival. You can even see the floats as they march down the street.
The Rio Carnival starts on Friday and runs until Tuesday, a day shy of Ash Wednesday, a Catholic tradition that signals the start of Lent. It was brought to South America by Portuguese invaders in the 1600’s who celebrated with balls and masquerade dances. African slaves and workers brought to Brazil by the Portuguese soon incorporated their own traditional customs, paying homage to their culture and gods. Present-day celebrations are a fusion of African, Portuguese and Indigenous traditions, giving it an Afro-European blend that defines Brazilian culture.
The top samba schools get the honor of performing in front of millions at the Sambodromo. There’s a panel of approximately 40 judges who sit at key points throughout the stadium, evaluating every movement, costume, song and connection to the samba. The champion is announced on Ash Wednesday. Four different types of samba parades take place at the Sambadrome during carnival time, and these usually follow the same pattern year after year, beginning with the Access Group Parades and ending with the Winner’s Parade.
The first Carnival in Rio de Janeiro was held in 1723. The word carnival originates from the Portuguese “Carne Vale,” interpreted as “Farewell to meat.” The phrase refers to Carnival as being the ultimate celebration before a period of abstinence from alcohol, meat and pleasure begins. The Carnival in Rio de Janeiro has more than just Samba schools and parades; it also has many street parties called “Blocos.” The city’s streets are filled with the rhythm of samba as numerous street parades take place.
Have a great rest of your workday! 😊
(Image Courtesy: Airbus. Processed by Apollo Mapping for improved color accuracy and clarity.)
 This map shows the areas imaged by the Pléiades 1 constellation from June 1 to August 31, 2024 over Indonesia and the Philippines. Please note that in many instances, multiple images were collected over the same area which is difficult to portray on this static map.
In this monthly piece, we give our readers a sense of the high-resolution imagery coverage collected over a geography during a specified window. To do this, we pick a high-resolution satellite constellation, a defined time period and area of interest, then report key statistics on the total amount of imagery collected in square kilometers (sq km). Without further delay, let’s jump into our analysis.
Graphic Region of Interest: Indonesia and Philippines plus off-shore islands
Land Mass Covered: 2,180,911.0 sq km
Time Period: June 1 to August 31, 2024
High-Resolution Satellite Constellation: Pléiades 1 (i.e. Pléiades 1A and 1B)
Pléiades 1 Constellation Imaging Statistics–Indonesia and Philippines
Total Area Collected: 796,329.7 sq km; 4,327.9 sq km per satellite/per day
Area Collected @ 20% or Less Clouds & 30 Degrees or Less Off-Nadir: 187,309.4 sq km; 1,018.0 sq km per satellite/per day; 23.52% of total