
Are you working on an atmospheric correction for QuickBird, WorldView-2 or GeoEye-1 imagery?

Perhaps you need to convert raw digital numbers for any of these satellites to radiance?
If so, then we have new documents online that you need to check out. They provide critical spectral response values as well as advice on radiance conversions and top of atmosphere corrections (i.e. ATOC).
Here are links to download these new documents from our website:
- A spreadsheet with the exact values used to create the relative spectral radiance response curves for WorldView-2, QuickBird and WorldView-1.
- A PDF with information regarding radiance conversions and ATOCs on GeoEye-1 satellite imagery.
- A spreadsheet with the exact values used to create the relative spectral radiance response curves for GeoEye-1.
- There seems to be major advancements in solar technology quicker than this short snippet section can keep up with so this month, I turn my attention back to this source of renewable energy. First let’s take a look at some new, innovative materials used to construct solar panels. Silicon is a key component of most solar panels today but it takes temperatures of 2,000 degrees Fahrenheit to get the element into a form that is usable. A team from the University of Michigan however has found a way to produce the silicon crystals on a soft metal (gallium) at temperatures less than 200 degrees, saving significant energy and therefore costs. Scientists at Vienna University of Technology hope to replace silicon solar cells with layers of oxide materials which are far more efficient and ultra-thin. Stanford University researchers have replaced metallic compounds in solar panels with graphene and carbon nanotubes. While only in the prototype phase, many of the metallic compounds in solar panels are in short supply; so carbon-based panels will likely be a leading technology in the not too distant future. Georgia Institute of Technology and Purdue University teamed to develop the first solar panel made of complete renewable materials, cellulose nanocrystals derived from plants and trees. And researchers at the University of Georgia have figured out how to use the photosynthetic structures in leaves which are nearly 100% efficient to produce power from the sun.
In the second part of this snippet, we examine four technologies that could improve energy storage which is a major barrier for renewable power given that it is not produced on-demand as is energy from fossil fuels. First, a University of Minnesota professor has invented a system to store energy in portable pipes filled with compressed air, as opposed to in underground caves. Harvard University has been awarded a USDOE grant to look at low-cost, low-environmental impact liquid batteries based on small organic molecules. Another team of University of Arkansas researchers is investigating low-cost, long-lasting concrete plates to store energy as heat as opposed to packed rocks (a common method now) which damage tanks due to thermal expansion. Finally, University of Missouri engineers have developed a way to harness plasma, the fourth and likely least know state of matter, so that it can be in the same room as a human with no damaging effects. Plasma is hotter than the surface of the Sun and the MU innovation allows it to be stored at room temperature without any containment, using its own self-magnetic field.
 A screengrab of the CommonCensus.org map that shows where fans of a particular baseball team are concentrated.
- The Hunt for October is on and well, it’s an understatement to say that I am excited for the MLB playoffs that will be starting soon. Go Orioles!!!!! As the postseason approaches, what could be more fun than a baseball-related map I ask? The answer is NOTHING! So here you go, check out this fun map that shows the region where baseball teams are the most popular. While this map was not produced using strict statistical sampling techniques, it is based off more than 31,000 votes so there is some validity to it. Get out your magnifying glass and click around this map to see where the fans of your favorite are located!
- Peach season is on here in Colorado so this month I googled ‘GIS and peaches,’ and much to my surprise and happiness, I actually had a few hits! One of the pieces was written by two researchers at Penn State University with a focus on the economic impacts of land use changes in the urban-rural interface of Berks County, Pennsylvania. The results of the study might not be surprising to those of you who recently purchased or are looking to purchase a home. They found that proximity to open space increased home values the most drastically; while proximity to industrial space decreased it the most drastically. It would be interesting to see how these results might be different in an urban jungle such as Brooklyn where some popular neighborhoods, like Williamsburg, are close to or even encompass industrial-use parcels.
- From Florida we head a bit north to Atlanta, Georgia for our next review of online, city GIS resources. And you might expect for one of America’s largest cities, the GIS resources of Atlanta are robust. For the casual user of online mapping data, there are web maps which display a wide variety of layers, including zoning, education, environment and public saftey. For more advanced users, you are able to browse a catalogue of all the GIS layers maintained by the city and then request them from the agency that owns the data. The data layers maintained by the Office of Planning can be downloaded here. Nice work Atlanta, you have one top-notch GIS website!
Brock Adam McCarty
Map Wizard
(720) 470-7988
brock@apollomapping.com
 A chart showing times of the year (with respect to latitude) that nighttime imaging is possible with EROS B.
Do you need high-resolution satellite imagery collected at nighttime over nearly any location on the planet?
If so, Apollo Mapping has a solution for you! Partnering with ImageSat International, owners and operators of EROS A and EROS B, we are able to provide you with custom collections of ~70-cm panchromatic imagery over areas as small as 50 square kilometers. As an added bonus, the price for this nighttime imagery is still below what you would pay for the minimum collection of color, high-resolution, daytime imagery.
We have tasked EROS B on multiple occasions and have been impressed with the turnaround time and high-quality panchromatic imagery it can deliver. While many people shy away from it, for nighttime imagery there is little to no difference between black and white and color data. Further, by collecting only panchromatic data, EROS B can maximize collection capacity so you receive tasked imagery quicker.
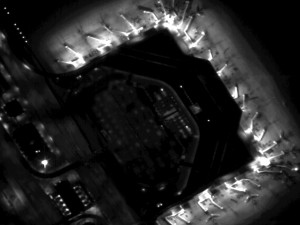
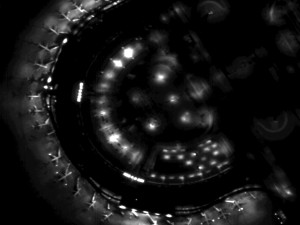 Previews of ~70-cm EROS B imagery collected during the night over Dallas-Fort Worth Airport on September 14, 2008. (Images Courtesy: ImageSat International)
Key Specifications of EROS B
- Launch Date – April 25, 2006
- Spectral Bands – panchromatic only
- Resolution – 70 centimeter (varies with orbital height, off-nadir angle and imaging mode)
- Revisit Time–~3.5 days (varies with latitude and off-nadir angle)
- Swath Width – 7 km (varies with orbital height and off-nadir angle)
- Bit Depth – 10-bits
- Orbit Height – 520 km (varies about this average)
For more information on this new nighttime, high-resolution tasking service, please visit our website or contact the Apollo Mapping sales team at (303) 993-3863 or sales@apollomapping.com.
From the East Coast of the USA we travel to the ‘big apple’ of the South with a stop at East Lake Golf Club in Atlanta, Georgia for this Pléiades 1 Golf Course of the Month. Since 2004, East Lake has been the site of the TOUR Championship which is the final event of the US PGA season and the last of 4 playoff rounds in the ‘Chase for the FedEx Cup.’ The field consists of the top 30 players according to the current FedEx Cup point standings so the stellar field this year is likely to include top players such as Tiger Woods, Phil Michelson, Adam Scott and Jason Day. The TOUR Championship will be played from September 19th to 22nd this year.
East Lake Golf Club was opened in 1904 and is Atlanta’s oldest course. In 1913, the course was redesigned by renowned architect Donald Ross who may be best known for Pinehurst Number 2. East Lake is well known for its ties to legendary amateur golfer, Bobby Jones, who hailed from the Atlanta area. The Par 70, 7,154 yard course features 72 bunkers and 3 water hazards with MiniVerde Bermuda grass greens, Meyer Zoysia fairways and Tifway 419 Bermuda roughs. In recent history, the Par 4, 520 yard Fifth Hole has played the most difficult with the Par 5, 525 yard Fifteenth Hole the easiest.
What truly separates East Lake from all other golf courses is their community outreach program. In 1993, Tom Cousins purchased the course and started a renovation effort that included the entire surrounding neighborhood. All of the club’s profits and donations support the East Lake Foundation which has transformed the neighborhood into a thriving, mixed-income community with a diverse population.
The Pléiades 1 High-Resolution Satellite Constellation
The Pléiades 1 constellation (or at least part of it!) has been in orbit since December 2011 and if you have not had a chance to check out any sample imagery, take a few moments and have a look at the gallery on our website. If you work with high resolution imagery, you should consider Pléiades 1 for your next geospatial project.
A variety of Pléiades 1 products are available from both a growing archive and as a new collection, including 50-centimeter (cm) pansharpened imagery and 50-cm panchromatic–2-meter (m) 4-band multispectral bundles. We are happy to discuss the technical specifications, pricing and tasking options available with this new satellite constellation as Pléiades 1A has been joined in space by its twin, Pléiades 1B, which is now fully operational.
Working with Pléiades 1 for the past year plus, we have noticed that:
- Astrium is able to deliver on their tasking feasibilities.
- The data is crisp with excellent color saturation so that it is on par with competitors’ 50-cm satellites.
The Apollo Mapping sales team can answer any questions you might have about the high resolution satellite constellation, Pléiades 1. We can be reached anytime at (303) 993-3863 or sales@apollomapping.com.
More sample images and technical information about Pléiades 1A and 1B can be found on our website here.
Starting immediately, we are happy to announce reduced minimum order sizes and new pricing for medium resolution SPOT 6 imagery. As a quick recap to our readers, SPOT 6 is able to deliver 1.5-meter pansharpened 4-band imagery with a footprint that is 60-kilometers (km) x 60-km. It is an excellent option for new collections as well as for orders from a rapidly expanding archive.
Specifically, here are the new minimum order sizes for SPOT 6:
- Archive imagery–100 square kilometers (sq km)
- Tasked imagery–500 sq km
As for new pricing, we are now able to provide 6-meter multispectral SPOT 6 imagery at a reduced cost. If you are interested in this new product option, drop us a line at sales@apollomapping.com for additional details.
 A 1.5-meter natural color SPOT 6 image collected on December 23, 2012 over Buenos Aires, Argentina. These images were photo enhanced by Apollo Mapping. © CNES 2012, Distribution Astrium Services / Spot Image S.A., France, all rights reserved.
Key Specifications of SPOT 6
- Spectral Bands: panchromatic, 4-band multispectral (blue, green, red and near-infrared)
- Product Resolution: 1.5-m panchromatic, 6-m multispectral
- Average Revisit Time: at most 1 day (once SPOT 7 is operational)
- Footprint Width: 60 km (at nadir)
- Orbital Height: 694 km (at equator)
- Launch Date: September 9, 2012
For more information about SPOT 6 and available archive coverage, please contact us at (303) 993-3863 or sales@apollomapping.com.
In this monthly piece, we give our readers a sense of the high-resolution imagery coverage collected over a specified geography during a three month window. To do this, we pick a high resolution satellite, a defined time period and geography and then report key statistics on the total amount of imagery collected in square kilometers (sq km). Without further delay, let’s jump into our analysis.
 This map shows the areas imaged by WorldView-2 from January 1 to March 31, 2013 over Australia (in orange). Please note that in many instances, multiple images were collected over the same area which is difficult to portray on this static map.
Graphic Region of Interest: Australia
Land Mass Covered: 7,683,406.3 sq km
Time Period: January 1 to March 31, 2013
High Resolution Satellite: WorldView-2
Australia WorldView-2 Imaging Statistics
Total Area Collected: 2,005,964.5 sq km; 22,288.5 sq km per day
Area Collected @ 20% or Less Clouds & 30 Degrees Off-Nadir: 1,501,703.3 sq km; 16,685.6 sq km per day; 74.9% of total
Busan is the second largest city in South Korea, and home to the country’s largest port. Its location allows the city to serve as the gateway to Japan and Eurasia. Busan is home to Korea’s largest mountain, Geumjeongsan, which is roughly 2,600 feet tall and one of the nation’s favorite hiking destinations. In the valley of the mountain sits a small community known as Sanseongmaeul, it is widely recognized for its barbecued goat meat. The country’s longest river, the Nakdong, also flows through the city into the Korean Strait. The river has played a significant role in Korea’s history as during earlier periods, many of the citizens established residences and towns along its winding route. The Nakdong also played a pivotal role during the Korean War for American troops, as it was a pinch point in establishing the Pusan perimeter. Busan was formally known as Pusan until 2000 when the Korean government entered the Revised Romanization period of their language development.
 Built for the 2002 Asian Games and used in the 2002 World Cup as well, the Asiad Main Stadium in Busan is also home to the Korean professional football (soccer) team, Busan IPark. Image courtesy of DigitalGlobe, captured by the 50-cm satellite, WorldView-2, on March 8, 2011. Photo enhanced by Apollo Mapping.
 The Sajik Baseball Stadium is part of the Busan Sports Complex. It was built in 1985, but has been updated many times since its original construction. Sajik is home to the Lotte Giants, one of the original franchises in the Korean Baseball Organization league. Image courtesy of DigitalGlobe, captured by the 50-cm color satellite, WorldView-2, on March 8, 2011. Photo enhanced by Apollo Mapping.
And while it is just the second largest city in the country at 3.5 million residents, it is home to the world’s largest department store. The Shinsegae Centum City is over 3 million square feet with a 60 tee golf course, driving range and ice skating rink inside. The structure measures 14 stories high with another 4 stories below ground as well. All of the floors are marble and crystal chandeliers line the store’s ceilings, giving it quite the posh atmosphere. But Shinsegae isn’t the only massive structure within the city, the Busan Sports Complex, originally completed in 1984 and updated in 1989 and 2002 for the Asian Games, is home to an indoor gymnasium, swimming pool and rill field, as well as tennis courts, baseball fields, lawn bowling fields, a gymnastic gymnasium and of course the main stadium. The architecture of the Asiad Main Stadium is based on the city’s ‘image’ with many curves built in to reflect the rolling waves that lap against the nearby shore.
Busan is not all about infrastructure as it has a vibrant culture as well. In Japan’s attempt to conquer the country in the late 16th Century, Busan was integral to stemming the tide. Busan became the temporary capital during the Korean War for three years, and it has been at the foundation of multiple democratic movements during: the Japanese occupation in the 1910’s; the revolutionary movement of 1961; the democratic movement in 1979; and the student movement of the 1980’s. Its history is full of important developments from the First Century onward. Around 42 A.D., the Gaya confederacy was born. It was one of the three kingdoms of Korea, along with Baekje to the west and Silla to the east. At that time, as the story goes, there were six eggs that descended from heaven, each is said to have born a king that would rule over the 6 regions of Gaya. Their rule persisted for 600 years, but the three kingdom system fell in the late 7th Century when Silla took over Gaya.
Today, Busan is known for its arts and protection of the surrounding natural environment. There are numerous art and film festivals, museums and parks that provide the people of Busan with expansive entertainment. The seventeen acre Yongdusan Park is home to a gallery and an aquarium, as well as 70 species of trees which makes it a popular tourist destination. Silla University researches the impacts of the maritime industry on Korea’s coastlines and leads public service campaigns on proper stewardship of natural resources. The city has been progressive for a century or more. Its focus on the future should be a model for growing cities around our Small World to adapt to changing times while valuing history, nature and culture.
Justin Harmon
Staff Writer
Apollo Mapping is pleased to announce that we have expanded our geospatial services offerings to include web map creation, custom GIS application development and (coming soon) a flexible GIS cloud. In fact, we already have an example of our web map services as Image Hunter Version 2 was designed and created by our own development team. This team is based here in Boulder, Colorado so technical support and product development happen in real-time rather than the delayed responses international companies provide.
 Image Hunter Version 2 was designed and programmed from the ground up by our product development team here in Boulder, Colorado.
If you give Image Hunter a test, you will find that it displays search results faster than even the imaging companies offer for their datasets with an easy-to-navigate, modern design. We can make your web maps and GIS apps work as smoothly and look as appealing as this–let us show you what we can do for your organization.
Specifically, here are some of the customized geospatial services Apollo Mapping is happy to help you with now:
- Online web map applications to improve internal business processes, for client-facing government websites and for consumer navigation. We design our web maps with an emphasis on flexible and easy-to-expand architecture, browsing speed and efficient user interfaces. These applications can be hosted in the cloud or on your own servers. We are able to integrate all forms of geospatial data, APIs and media files on the platforms and languages that make the most sense for your project.
- Custom GIS plugins that help you get the most out of ArcGIS. By building custom applications that are able to automate repetitive GIS tasks, you save time, increase your efficiency and prevent costly errors. We can build GIS apps as simple or complex as your project calls for.
- And coming soon, a truly flexible GIS cloud that users can get up and running within minutes, not days like the other clouds out there. Our cloud will feature monthly service contracts with real-time tracking of incurred charges, industry-leading data redundancy and data access times quicker than often experienced with internal servers. The Apollo Mapping GIS cloud will be the most user-friendly and scalable product on the market, hands down.
To find out more about our new geospatial application development services, give us a call at (303) 993-3863 or send an email to sales@apollomapping.com.