
In the ever-changing world of geospatial technology, Airbus offers a groundbreaking solution for repeat imagery collections. Airbus’ Pléiades Neo OnePlan is a powerful monitoring solution that combines cutting-edge innovation with unparalleled collection capability at 30-centimeter (cm) resolution.
 A 30-cm color Pléiades Neo image collected on April 28, 2023 over Roozengaarde in the Skagit Valley, Washington, USA during the annual Tulip Festival.
With 30-cm Pléiades Neo, Apollo Mapping clients are able to monitor urban growth, track environmental changes, and gain valuable insights into infrastructure development with unprecedented resolution and repeat collections. Its state-of-the-art capabilities ensure timely data delivery, enabling informed decision-making like never before. Airbus has a successful track record of quickly collecting beautiful imagery, making it the best option for monitoring applications.
The Pléiades Neo OnePlan tasking solution has a flexible pricing structure, offering a discounted per-square-kilometer cost that makes it a fantastic choice for a wide range of applications.
Airbus’ Pléiades Neo also boasts an impressive standard delivery time of 12 hours or less once the imagery is collected and downlinked, ensuring that you have access to the latest data when you need it most. Unlock a world of possibilities in monitoring, analysis, and decision-making with 30-cm resolution Pléiades Neo OnePlan tasking.
To find out more about 30-cm Pléiades Neo OnePlan tasking for site monitoring, send us an email at any time to sales@apollomapping.com and we will get right back to you!

Cricket’s Chirp is created for Apollo Mapping by Ron Ruelle, a Wilmington, NC (formerly Boulder, CO) based cartoonist, lllustrator and teacher. No animals are harmed in the creation of these comics, but Ron sometimes breaks a pencil in frustration. You can see more of his work at www.ronruelle.com
We love maps.
We love imagery.

We love work breaks.
We hope you like them as well!
April means spring is in full swing and Coachella has arrived. The Coachella Valley Music and Arts Festival will be held April 11-13 and April 18-29 this year at the Empire Polo Club in Indio, California.
The annual event features live music from many genres, including rock, pop, indie, hip hop and electronic dance music. There are also art installations and sculptures, as well as food and beverage vendors. For this month’s Imagery Work Break, we feature a 30-centimeter (cm) Pléiades Neo image that was taken on April 14, 2024, which was the last day of the first weekend of music last year where Doja Cat headlined the day.
The lineup for this year’s event consists of headliners Lady Gaga, Green Day and Post Malone, while Travis Scott will “design the desert,” what’s been previously called the “returning to the desert” slot. Other notable acts scheduled to perform include Missy Elliott, Charli XCX, Megan Thee Stallion, Gustavo Dudamel & LA Phil, The Go-Gos, Zedd, and FKA twigs and BLACKPINK members Jennie and Lisa who will perform as solo artists.
Be sure and check out our 30-cm Pléiades Neo featured image and see if it inspires you to plan your next trip to California to catch a wave and this epic music festival.
(Image Courtesy: Airbus. Processed by Apollo Mapping for improved color accuracy and clarity.)
We are pleased to announce that our newest high-resolution satellite imagery is live in Image Hunter, it’s 50-centimeter (cm) 8-band SuperView Neo-3! A part of the SuperView Neo constellation, Neo-3 differentiates itself from its satellite twins, Neo-1 01/02, with 2-meter (m) 8-band multispectral imagery as well as an industry-leading 130-kilometer (km) wide footprint. SuperView Neo-3 also images at 10° or less off-nadir so there is less tilt in the data, which is crucial in areas with tall buildings, trees, and mountains as well as those with deep, narrow passages. A massive 130-km wide footprint allows Neo-3 to collect an impressive 1.4 million sq km of 50-cm 8-band data daily.
 A 50-cm color SuperView Neo-3 image collected over Washington, DC on December 12, 2024.
Here are a few of the specifications that set SuperView Neo-3 apart from the competition:
- 50-cm panchromatic and 2-m 8-band multispectral, including blue, green, red and near infrared (NIR) plus coastal blue, yellow, red edge and NIR2.
- All images collected at 10° off-nadir or less.
- 130-km wide image footprint.
- 1.4-million sq km per day collection capacity.
So, if you are looking to uplevel your next spectral analysis, 50-cm 8-band SuperView Neo-3 is sure to be one of your go-to satellites.
You can query 50-cm SuperView Neo-3 on Image Hunter at any time! And if you have additional questions about using SuperView Neo-3 for your next mapping project, you can contact us now at sales@apollomapping.com.
In this monthly feature, we span the globe to examine Our Changing Landscape with a time series of medium-resolution PlanetScope satellite imagery. The PlanetScope constellation dates back to 2016 and collects hundreds of millions of square kilometers of four and eight-band 3-meter imagery daily! In March, we were awed by the November 2024 eruption of Mt. Lewotobi Lake-laki, which is located on the island of Flores in Indonesia. For the April edition of this series, we check out the January 2025 historical snowfall in Kansas City here in the USA.
 Click on the image above to see an animation of 3-meter natural color PlanetScope image collected over the Kansas City metro area on January 1 and 6, 2025. And wow what a difference a few days makes as before this massive blizzard, the region was snow free–but that was definitely not the case on January 6th as you can see a thick blanket of white snow covering Kansas City, burr! (Images Courtesy: © Planet 2025)
The PlanetScope Microsat Constellation
PlanetScope is a constellation of more than 240 microsats referred to individually as Doves. Each Dove is able to collect up to 20,000 square kilometers (sq km) per day of 3-meter (m) 4-band multispectral (i.e. blue, green, red and near-infrared [NIR]) imagery; and newly launched SuperDoves collect 8-band multispectral adding in valuable red-edge spectral data. Across the constellation, PlanetScope is archiving more than 200 million sq km of medium-resolution imagery a day, making it the go to source for daily imagery over most locations. This massive archive dates back to 2016, offering the most complete and continuous record of spatial data on the planet since the start of the constellation’s ongoing launch schedule. Collecting 3-meter multispectral imagery is the equivalent of ‘high-resolution’ multispectral data imaged by a 75-centimer (cm) satellite (as this satellite would feature 75-cm panchromatic and 3-m multispectral), making PlanetScope an extremely competitively priced option at just $2.25 per sq km. With well registered images and nearly daily collections of most locations, PlanetScope is the ideal imagery source for this current-events focused series, Our Changing Landscape.
January 2025 Historical Snowfall In Kansas City
Just four days after the new year, the Kansas City metro area, which spans both Kansas (KS) and Missouri (MO), was hit with a snowstorm that brought the most snow the area had seen in at least 30 years. First, ice covered K.C., then the snow moved in followed by extremely cold temperatures with wind chills ranging from -15 to -20°F.
In fact, it was in 1993 when Kansas City last saw 10.5 inches fall. The final snowfall total Sunday, January 5, at Kansas City International Airport was 11 inches, which broke the previous record for that date of 10.1 inches set in 1962, according to the National Weather Service. The snowfall was also Kansas City’s fourth largest single-day snowfall on record, dating back to 1888. The top 3 were 16.1 inches on March 23, 1912, and 11.8 inches on both Jan. 18, 1962 and Feb. 27, 1900.
It is extremely rare for the metro to have more than 10 inches of snow on a single day. Before Sunday, it only happened seven other times during the city’s 137 years of recorded weather history, according to The Kansas City Star.
Atchison, KS took the top spot at 14.0 inches, Cameron, MO and St. Joe, MO each reported 13.0 inches, while Platte City, MO, Blue Springs, MO and Olathe, KS each received 12.0 inches. Overland Park, KS got a healthy 10.0 inches, which was matched by downtown Kansas City.
City crews worked around the clock for five consecutive days, plowing streets, applying salt, and ensuring all routes were covered. The Snow Angels program took effect, which is where volunteers shovel sidewalks and plow driveways for those unable to do so themselves.
If you would like to find out more about using 3-meter PlanetScope imagery for your academic studies, engineering projects or any landscape analysis, let us know at sales@apollomapping.com or (303) 993-3863.
- If you read this article often, you know that we always start off with fun technological advancements from the past weeks, so here we go with that list again!
Tiny copper flowers create useable carbon products from the sun and water.
An approach to recycle before impossible-to-recycle materials.
Another method to create sustainable fuel from ambient carbon dioxide and sunlight.
While this technique produces hydrogen fuel without carbon dioxide emissions.
A sustainable alternative to plastic.
Who would have thought that cigarette butts can clean wastewater?
Extracting drinking water from thin air with natural materials.
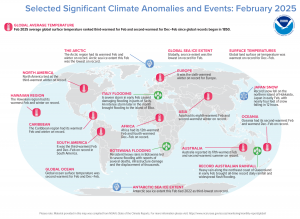
In May 2025, the Arctic region had its warmest February and winter on record. North America tied as the third warmest winter on record. The Hawaiian region had its warmest February and winter on record. The Caribbean region had its warmest February and winter on record. Antarctic sea ice extent was the third lowest on record. Oceania had its second warmest February and warmest December-February on record. (Image Credit: NOAA Global Climate Report)
- The NOAA Global Climate Report for February 2025 has been released by the National Centers for Environmental Information and reveals further proof that global Climate Change remains a concern. The global surface temperature was 2.27°F above the 20th Century average of 53.8°F, making it the third warmest February on record. It was the fourth warmest February for the global land air temperature and the second warmest February for the global ocean surface temperature. The Northern Hemisphere had its fourth warmest February on record at 2.90°F above average. The Northern Hemisphere land-only temperature also was fourth warmest while the Northern Hemisphere ocean-only temperature was second warmest on record for February. Temperatures in the Southern Hemisphere ranked second warmest on record at 1.64°F above average. The average ocean-only and land-only temperatures for February in the Southern Hemisphere also individually ranked second warmest on record. There were areas of drier-than-average conditions covering much of Europe, eastern Kazahkstan stretching eastward through southern Mongolia into eastern China and the southern two-thirds of Japan. Below average precipitation also occurred in a large part of Australia, East Africa westward to Atlantic coastal areas of Central Africa, the southern half of Brazil, Bolivia, Paraguay and northern Argentina, as well as a large part of Canada, southern Alaska, the central U.S. and much of the southern U.S. southward into a large part of Mexico.
- April Fool’s Day falls on the first of the month and many people have fallen victim to a prank or two. In 2015, The Winnipeg Sun pulled a big one over on readers. The newspaper ran an article about a proposed plan from the provincial government to begin issuing GPS-tracked speeding tickets the following year. As you can imagine, numerous readers were furious about the proposal. One reader even called the newspaper to say he had called the mayor’s office and several MLAs to express his dismay with the alleged plan, then admitted he didn’t read to the bottom of the story, which made it fairly clear it was a prank. Others mostly appreciated the prank article–which was listed as having been written by Roger L. Easton, the primary inventor of GPS–even if they didn’t immediately catch on. “Thanks for getting my blood boiling,” wrote one reader. “I was ready to move if this was actually going to happen in Manitoba.” On April 1, 1977, the Guardian produced a seven-page travel supplement about the tiny tropical republic of San Serriffe, “a small archipelago, its main islands grouped roughly in the shape of a semicolon, in the Indian Ocean,” which was apparently celebrating 10 years of independence. The article included a GIS map of the island republic. The country was in fact completely made up as an April Fool’s joke. GIS was also used to create a fictitious map released for April Fool’s Day. Mac Studio teased blog readers with an unveiling of ArcGIS for macOS, which Map Happenings debunked.
Brock Adam McCarty
Map Wizard
(720) 470-7988
brock@apollomapping.com
After sticking around in my hometown for college, thus logging the first 22 years in one place, I became a rather nomadic person after that, in part due to curiosity or following job or schooling opportunities, in part due to failed endeavors, plus a little wanderlust. From age 23 through 38, I never lived in the same place for more than three consecutive years, and even some of those stints were broken up with extended absences of a couple months elsewhere. To say I never got settled may be an understatement. I assume I wanted to be “settled” (in some ways, and definitely not in others), but life just didn’t work out that way. During that 15-year period I lived in five states and moved about 10 times. But with time comes the need to “put away childish things” as the saying goes, and eventually, I found something resembling a career and have been settled into it now for about nine years. I would say I’m largely comfortable where I am. While I have a few complaints–I would have some inevitably wherever I lived–none are entirely disqualifying of the location or the job, so I really shouldn’t grumble. But I’ve found with comfort also comes restlessness. And being that I’m a routine-type person, I’ve started to become bored with my habits. I’ve been thinking whether I could do what I do on a day-by-day, week-by-week basis for the next 10 or 15 years, and the answer is “yes,” but that affirmation also comes with an accompanying sigh.
I guess this is not uncommon for many people, though. As we age, and especially while we’re in that transitory midlife bracket, we have a longing for other opportunities, a wish for something new and exciting to come along. I imagine most people are so consumed with their lives, though, especially if married and with kids, and possibly taking care of aging parents, that they don’t have much time to spend in that funk or irrepressible sense of wanderlust. Being that I’m unmarried and childless (thank god), and my parents are hundreds of miles away and not in need of my care, I have more time to allocate to the wandering eye of middle age.
 I hope it doesn’t come to this. (Image retrieved from here and comes courtesy of Timur Weber.)
Over the last 3-4 years, I’ve applied for several jobs in my field, mostly as a “heat check” to see if anyone would want me. The first couple rounds yielded a series of distinct “no’s,” but the last few rounds I’ve gotten a little traction, with a handful of Zoom interviews, most of which didn’t lead to invites to the second stage of the onsite grilling, let alone an offer. I did have one invite for an onsite, but I turned it down. It was part pay, part rank, and part hesitancy; I couldn’t see past the short-term sacrifices to the long-term gain. I will openly admit I regret my decision to not see how far I could’ve gone, but regrets come at a dime a dozen in my life, so it goes…
But while I’ve mostly been looking because of my own curiosity and quest for something new, I’m starting to see the writing on the wall in that, eventually, I may have to start looking out of necessity. I work for a university, and as you may or may not know, the industry has been in freefall for a while, and that was only expedited by the pandemic. Add in a shrinking pool of traditional students, the coffers getting squeezed by state legislatures, and all sorts of financial and administrative mismanagement along the way, and you get dire straits for some colleges and universities, especially those small liberal arts colleges without much name recognition and the satellite campuses of flagship public universities, like the one I work at. We had an external auditor come in post-pandemic and that led to a cleaning of the shop resulting in the elimination or curtailment of 18 programs and departments, including many faculty, including those with tenure, something that until recent years would never have happened. But oh, how the times have changed…
Somehow, my department slipped through on those cuts, and I honestly can’t tell you why. Had I been in charge, I would’ve cut us, if for no other reason than we’ve been hemorrhaging students for years. My department’s enrollment is about 21% of its 2016 high–that’s a pretty nasty drop. I guess the fact that we didn’t get the axe is testament to how incompetent our administration is. Add in that they cut growing departments and those whose student credit hour generation was through the roof, and one can walk away from the situation thinking there was bias, ideological preferences, and a lack of capable leadership throughout the process. But I should be thankful, because here I sit, still with a job. For now…
I assume that will change soon, though. It has to if anyone is paying attention. I guess it’s possible we could turn things around, but I don’t think it’s likely. And this is not just my department–my field across the nation for decades has been in decline, losing upwards of 5-6 departments every year. We’re a dying dinosaur. I was hoping I could outrun it and make it to retirement, but I don’t think that’s realistic, hence why my curious job search really needs to quickly turn into one with intention of moving on. So be it. But I don’t want to move from one bad situation to another. Though, while you would think any department hiring new people would be in a good place, I don’t think it’s necessarily true. A few of the places I’ve interviewed for don’t have many more students than we have currently, though their numbers are going up–but they’re still small enough that they could easily be dissolved in the wrong political winds or due to the whims of a power-hungry administration. It’s also true even stable-in-terms-of-numbers departments aren’t always desirable. They could be in places one wouldn’t want to live, or their teaching load and other assigned duties could be backbreaking. With a shrinking field and a lot of competition, it’s slim pickings out there. Hence, why I’ve been silently kicking myself for the one golden opportunity I passed on largely due to arrogance: they’re busting at the seams with students. So it goes…
So, we’ll see what happens the next time the job mill starts churning come August. I may have ended up painting myself into a corner where I’ll just have to be happy with whatever I can get unless some sign from above comes in and sways my belief that the ship I’m currently sailing on won’t sink. But I’d rather get out to somewhere safe, even if not ideal, and be wrong about my reading of the tea leaves than be overzealous, and by necessity on the market, when the time has officially run out. It’s quite a conundrum. But hey, I’m just trying to read the writing on the wall.
Marco Esquandoles
Linked Out

We love maps.
We love imagery.
We love work breaks.
We hope you like them as well!
Even with winter in affect across much of the United States, many golf fans cannot wait to watch the 2025 Masters Tournament, which will be held April 10th to the 13th in in Augusta, Georgia at August National Golf Club.
If you’re lucky enough to land tickets to watch the 2025 Masters Tournament in person or plan to watch from home or the golf club, we have an image that’ll pique your interest and put you back in the swing of things to get excited for this year’s big tournament. So for this month’s Imagery Work Break, we feature a 30-centimeter WorldView-3 image that was taken at 11:16 a.m. Eastern Standard time on April 12, 2024 during the 3rd Round of the 2024 Masters Tournament.
The first Masters Tournament was held March 22, 1934, and beginning in 1940, the Masters was scheduled each year during the first full week in April. Upon his retirement from championship golf in 1930, Bobby Jones decided to build a golf course, which is now home to the Masters Tournament. In this WorldView-3 satellite image, you can see the beautifully manicured course, the paths the golfers walk and drive carts upon, the sand pits, the putting greens, and even the densely wooded patches of trees and water bodies to make it even more challenging yet beautiful to behold.
Be sure and check out this 30-cm WorldView-3 image and see if it inspires you to get your golf clubs ready.
Have a great rest of your workday! 😊
(Image Courtesy: Maxar. Processed by Apollo Mapping for improved color accuracy and clarity.)