
Sometimes a picture is worth a thousand words, and that is especially the case if you have ever read my verbose Geospatial Frequently Asked Question (G-FAQ) series, haha! So this month, I break from tradition with a video tutorial as the focus of this G-FAQ on color balancing rasters (or imagery) in ArcGIS 10.x. This is a topic that could take hours to cover, so this month I focus on one specific issue I have noticed with ArcGIS 10: the automatic color balance it applies to rasters.
Specifically, this G-FAQ will address this set of questions:
How do I know if ArcGIS applied a stretch to my imagery? How do I turn this stretch off? How can I make the stretch ArcGIS automatically applies look better?
Before you jump into the video posted with this G-FAQ, let me spend a bit of time introducing this topic. When you snap a picture on your cell phone, there is an involved process on the backend which takes the raw image and makes the colors look as ideal and realistic as possible. And as many of you have found out, this automated process is not always ideal–hence cell phone makers have given us the power to edit the images, for instance with the Auto-Enhance option on the iPhone. The process I just described is often referred to as: color balancing, histogram stretching or color enhancement (in the world of remote sensing and/or GIS that is).
Color imagery, including a cell phone photo, is created by combining the blue, green and red reflectance values from a surface. When speaking of satellite and aerial imagery specifically, these blue, green and red surface reflectance values can be reported in either 8 or 16-bit depth. While we do not have the time to cover this topic in full (see our January 2013 G-FAQ for a more detailed handling of bit depth), bit depth refers to the number of blue, green and red shades that are possible in an image. In 8-bit depth, there are 256 shades possible and then with 16-bit there are 65,536 shades. However, a computer monitor cannot read 16-bit depth images, so they must be converted to 8-bit depth to be visible. Before a 16-bit image is converted to 8-bit depth, it will look like an all black tile. Once converted to an 8-bit image (or even if you started with an 8-bit image), you should see colors in a program like ArcGIS when you load a raster but they might not be ideal. And so that is what color balancing is for!
Okay, now that we have introduced the topic, it is time to move on to the tutorial. In this video, I will load both 8 and 16-bit depth satellite images into ArcGIS 10.1 to show our readers what happens and then offer a few color balancing tips.
Do you have an idea for a future G-FAQ? If so, let me know by email at brock@apollomapping.com.
Find Out More About This Topic Here
- Esri–Raster Stretch Functions
- Fort Lewis College–Digital Image Analysis Techniques III–Image Enhancement
- University of California, Irvine–How to Stretch Image Pixel Values
Brock Adam McCarty
Map Wizard
(720) 470-7988
brock@apollomapping.com
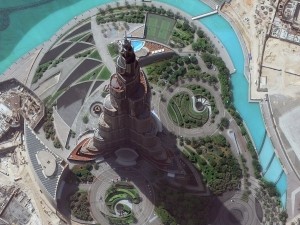 An amazing 40-cm color WorldView-3 image of the world’s tallest building, Burj Khalifa, in Dubai, United Arab Emirates collected on September 19, 2014. Check out the shadow cast by the four-headed light fixture over the tennis courts. (Image Courtesy: DigitalGlobe)
 Zabel Park from the same 40-cm WorldView-3 image collected over Dubai. The detailed, colored veins you can see on the five rocks is absolutely incredible. (Image Courtesy: DigitalGlobe)
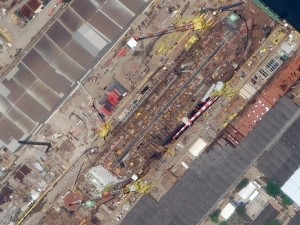 A ship unloading in the docks of Rio de Janeiro, Brazil. This 40-cm WorldView-3 image collected on October 23, 2014 is detailed enough to show the steel lattice structure of the shipyard cranes. (Image Courtesy: DigitalGlobe)
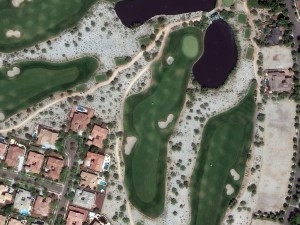 And finally, a WorldView-3 image collected on September 5, 2014 over Verrado Golf Course, Arizona. With 40-cm resolution, golf carts are more than a speck and you can even start to make out individual roof tiles that are different colors. (Image Courtesy: DigitalGlobe)
We cannot get enough of this amazing 40-cm WorldView-3 (WV3) data and we hope you agree! So this month, we feature four color images from the United States, Brazil and the United Arab Emirates. If you have not heard of the recently-launched satellite, WorldView-3, here are the features that really set it apart from the competition:
-
- Improved Resolution
- Higher resolution means you can see more detail in WV3 imagery.
- Data collected at nadir will have 31-centimeter (cm) panchromatic, 1.24-meter (m) visible and near infrared, 3.7-m short-wave infrared and 30-m CAVIS bands.
- At 20 degrees off-nadir, the resolution is 34-cm panchromatic, 1.38-m visible and near infrared and 4.1-m short-wave infrared.
- With the easing of US government regulations, we will be able to provide WV3 imagery at a maximum of 30-cm resolution during Q1 2015.
- Additional Spectral Bands
- If spectral analysis is part of your project, then no other satellite can match WV3 with its: 8 bands of visible and near-infrared data; 8 shortwave infrared bands which are crucial for geological studies; and 12 CAVIS bands to detect water vapor, dissolved aerosols, snow, clouds and more.
- Better Positional Accuracy
- With accuracies of 3.5-m CE90% or better (without ground control even!), WV3 has no rivals for its enhanced positional accuracy.
- Daily Revisits
- At 40 degrees latitude, WV3 will be able to image each location daily with 1-meter or better resolution and then every 4.5 days at 34-cm resolution or better.
- Increased Collection Capacity
- WV3 features a 13.1-km swath width (at nadir) with the ability to collect up to 680,000 square kilometer (sq km) of high-resolution data per day.
- Improved control movement gyros translate into larger maximum contiguous collection areas per pass, with up to ~7,500 sq km of mono imagery and ~3,000 sq km of stereo possible.
- Improved Resolution
If you are interested in WorldView-3 imagery for your next project, please let us know by phone, 303-993-3863, or by email, sales@apollomapping.com.
Many of our readers have likely not heard of KOMPSAT-3. If you are one of them, we suggest you think about it for your next project requiring high resolution satellite imagery. And in particular, for those of you who work with vegetation and/or spectral analysis as KOMPSAT-3 is the only multispectral high resolution satellite in the world to collect data in the afternoon. Further, KOMPSAT-3 has the highest data quantization of any satellite on the market.
If you are not familiar with KOMPSAT-3, here is a summary of the key satellite specifications:

 70-cm natural color sample images collected by KOMPSAT-3 on May 2, 2014 over Lisbon, Portugal. This data has been photo enhanced by Apollo Mapping. Additional samples of color 70-cm KOMPSAT-3 imagery can be found here.
- Launch Date: May 17, 2012, 16:39 UTC
- Spectral Bands:
- Panchromatic
- 4-band multispectral (blue, green, red and NIR)
- Sensor Resolution:
- At nadir–70-cm panchromatic & 2.8-m multispectral
- 20° off-nadir–82-cm panchromatic & 3.28-m multispectral
- 30° off-nadir–1.02-m panchromatic & 4.08-m multispectral
- 45° off-nadir–2.11-m panchromatic & 8.44-m multispectral
- Dynamic Range: 14-bits
- Revisit Frequency: (at 40°N)
- 1.4 days (< 45° off-nadir)
- 4.1 days (< 20° off-nadir)
- Mean Local Crossing Time: 13:30 local time (approximate; across lit side of Earth)
- Footprint Width: 16 km (at nadir)
- Maximum Collection Geometry:
- Mono, strip mode–16 km x 4,000 km (1 strip wide)
- Mono, wide area mode–48 km x 100 km (3 strips wide)
- Stereo, single pass mode–16 km x 200 km (2 pairs wide)
- Daily Collection Capacity: 300,000 sq km
- Georeferenced Horizontal Accuracy: 48.5-m CE90 (global average, dependent on terrain)
Having worked with sample images for the past several weeks, we are impressed with the crispness of KOMPSAT-3 data and its color reproduction. We feel that KOMPSAT-3 separates itself from other high-resolution satellites in two key ways:
(1) 14-bit depth which is important for spectral analysis. With 14-bit depth data, KOMPSAT-3 has a maximum digital number (or pixel value) range of 16,384 units. Compared with the maximum digital number range of 4,096 for Pléiades 1 and then 2,048 for the other high-resolution satellites in orbit now, this is a significant advantage for you remote-sensing academics and professionals out there.
(2) A 1:30 PM local collection time. All other multispectral high-resolution satellites collect imagery during the mid-morning, so an afternoon collection time can be an advantage in persistently cloudy areas like tropical islands. This is also an advantage for vegetation analysis as chlorophyll concentrations change though out the day; so coupling KOMPSAT-3 with imagery collected during the morning, can give researchers a more complete picture of plant health.
If you are interested in pricing, coverage and/or have any additional questions about KOMPSAT-3 data, please let the Apollo Mapping sales team at sales@apollomapping.com or (303) 993-3863.
For the past three years, Airbus’ twin high-resolution radar satellites, TerraSar-X and TanDEM-X, have imaged the entire land surface of our planet multiple times to create the first ever global 12-meter (m) elevation model. The WorldDEM is ideal for all mapping projects requiring accurate elevation models including orthorectification, floodplain determination, mineral exploration and hydrocarbon development.
 A comparison of 30-m SRTM and 12-m WorldDEMTM elevation data over Arkansas, USA.
WorldDEM November 2014 Product Updates
During November, significant sections of eastern Asia and Australia were made available. Areas that are available take a minimum of 10 days to deliver.
To date, there is more than 55,590,000 square kilometers (sq km) of WorldDEM data that is available! And some 10,160,000 sq km of WorldDEM was made available for delivery in the past month.
WorldDEM Specifications
The key product specifications of Airbus’ WorldDEM are as follows:
- Resolution: 12-m
- Coverage: entire landmass of the Earth, ~150 million square kilometers (sq km)
- Absolute Vertical Accuracy: < 4-m Linear Error 90% (LE90)
- Relative Vertical Accuracy: < 2-m LE90 (slopes ≤ 20%), < 4-m LE90 (slopes > 20%)
- Absolute Horizontal Accuracy: < 10-m Circular Error 90% (CE90)
- Vintage: all data collected within 3 years
- Source: interferometry from synthetic aperture radar (SAR) satellites TerraSAR-X & TanDEM-X
- Minimum Order: 500 sq km per polygon
- File Format: GeoTIFF
- Projection: geographic WGS84 (EGM2008, vertical datum), meter vertical unit
- Product Line Options:
- WorldDEMcore–unedited digital surface model (DSM), includes spikes, wells and voids
- WorldDEM–a DSM with removal of artifacts and water body flattening
- WorldDEM DTM–artifacts and surface features removed, i.e. a digital terrain model (DTM)
 A coverage map of the one-degree cells that are currently available for delivery. Areas that are available will take a minimum of 10 days to deliver.
WorldDEM Coverage and Pricing
WorldDEM data has a 500 sq km minimum order size with a 10-km width requirement. Prices for two of the product lines have been set:
- WorldDEMcore–$10.80 per sq km
- WorldDEMTM–$13.50 per sq km
WorldDEM Samples
You can download three 12-m WorldDEMTM samples here:
- Buraydah, Saudi Arabia–desert with agriculture present; 576 m to 737 m
- Mjosa Lake, Norway–hilly terrain with large water bodies; 100 m to 840 m
- Wagga Wagga, Australia–forest and urban with many water bodies; 137 m to 922 m
For more information about 12-m WorldDEM data, please send us an email at sales@apollomapping.com.
Do you need high-resolution satellite imagery collected at nighttime over nearly any location on the planet?
 A chart showing the times of the year (with respect to latitude) that nighttime imaging is possible with EROS B.

 Previews of ~70-cm EROS B imagery collected during the night over Dallas-Fort Worth Airport on September 14, 2008. (Images Courtesy: ImageSat International)
If so, Apollo Mapping has a solution for you! Partnering with ImageSat International, the owner and operator of the satellites EROS A and EROS B, we are able to provide you with custom nighttime collections of ~70-cm panchromatic imagery over areas as small as 50 square kilometers. As an added bonus, the price for this nighttime imagery is still below what you would pay for the minimum collection of color, high-resolution, daytime imagery.
We have tasked EROS B on multiple occasions and have been impressed with the turnaround time and high-quality panchromatic imagery it can deliver. While many people shy away from black and white only data, when it comes to nighttime imagery, there is little to no difference between black and white and color data. Further, by collecting only panchromatic data, EROS B can maximize collection capacity so you receive tasked imagery quicker.
Key Specifications of EROS B
- Launch Date – April 25, 2006
- Spectral Bands – panchromatic only
- Resolution – 70 centimeter (varies with orbital height, off-nadir angle and imaging mode)
- Revisit Time–~3.5 days (varies with latitude and off-nadir angle)
- Swath Width – 7 km (varies with orbital height and off-nadir angle)
- Bit Depth – 10-bits
- Orbit Height – 520 km (varies about this average)
For more information on this new nighttime, high-resolution tasking service, please visit our website or contact the Apollo Mapping sales team at (303) 993-3863 or sales@apollomapping.com.
This is the last month to take advantage of DigitalGlobe’s 50% discount on imagery products older than 18 months. So it’s time to check what is left in your yearly budget and make a purchase of the data you will need for your spatial next project!
As a quick recap, this 50% off offer applies to purchases of 1,000 square kilometers (sq km) of satellite imagery that is older than 18 months, including WorldView-2, QuickBird, GeoEye-1, IKONOS and WorldView-1 data.
If you would like to check for coverage over your area of interest, give our online search engine, Image Hunter, a try. With Image Hunter, you can search for all DigitalGlobe satellite imagery quicker and easier than you can on their own site. It will literally only take a second or two to load all of the search results over your area of interest!
Here are the specifics on this DigitalGlobe imagery discount offer:
- Discount Offer: 50% off
- Regional Restrictions: US clients only
- Minimum Order: 1,000 sq km (across all polygons; at least 25 sq km per polygon)
- Age Restriction: greater than 18 months old
- Satellites Offered: WorldView-2, QuickBird, GeoEye-1, IKONOS and WorldView-1
- Products Offered: georeferenced panchromatic, natural color, 4-band pansharpened/bundle, 8-band bundle and stereo
- Promotion Dates: now through December 31, 2014
- Academic discounts still apply
If you would rather we check for coverage over your area of interest(s), no problem! Just send an email with your latitude/longitude coordinates, shapefile or KMZ to sales@apollomapping.com.
There has been a slurry of pricing updates from DigitalGlobe with the long-awaited launch of WorldView-3 so let’s take a few moments to recap them all while we have your attention.
Here is a handy summary of the current pricing changes and promotions available for DigitalGlobe satellite imagery products:
- There is a new price list for 30-cm satellite imagery products offered by DigitalGlobe. Please email the Apollo Mapping sales team at sales@apollomappping.com for additional details on these new prices. The new price list also includes changes to 8-band WorldView-2/3 archived and tasked imagery.
- 30-cm WorldView-3 products will not be available until Q1 2015. Check our monthly newsletter, The Geospatial Times, for details on exactly when 30-cm products will be made available.
- 40-cm and 50-cm tasking requests for WorldView-3 only will be subject to the new 30-cm resolution pricing table.
- New collections at 30-cm resolution will have regional prices dependent on the country that is being tasked. We can tell you more about the regional prices to expect if you email us at sales@apollomappping.com.
- Through the end of 2014, requests for WorldView-3 only 40-cm tasking orders will be priced 50% off the list price.
- Any WorldView-3 order placed before February 25, 2015 are eligible for 50% off redelivery at 30-cm once the US government eases the resolution restriction.
- Through the end of 2014, customers based in the Americas who are also ordering data over the Americas will receive these discounts: (a) 8-band archive imagery at 4-band data pricing; and (b) 8-band tasked imagery for a 10% uplift on 4-band data pricing. There is a 25 square kilometer (sq km) minimum order for archive data and then 500 sq km for tasked imagery.
- There is a 50% off discount for DigitalGlobe imagery older than 18 months–you can find out more about this promotion here.
If you have questions about any of these WorldView-2/3 price changes and/or promotional discounts, please contact the Apollo Mapping sales team at sales@apollomapping.com.
In this monthly piece, we give our readers a sense of the high-resolution imagery coverage collected over a geography during a specified window. To do this, we pick a high resolution satellite, a defined time period and area of interest, then report key statistics on the total amount of imagery collected in square kilometers (sq km). Without further delay, let’s jump into our analysis.
 This map shows the areas imaged by the Pléiades 1 constellation from June 1 to August 31, 2014 over the continental USA. Please note that in many instances, multiple images were collected over the same area which is difficult to portray on this static map.
Graphic Region of Interest: continental USA
Land Mass Covered: 7,779,029.0 sq km
Time Period: June 1 to August 31, 2014
High Resolution Satellite Constellation: Pléiades 1
Pléiades 1 Constellation Imaging Statistics–Continental USA
Total Area Collected: 5,041,495.9 sq km; 27,399.40 sq km per satellite/per day
Area Collected @ 20% or Less Clouds & 30 Degrees Off-Nadir: 3,426,334.8 sq km; 18,621.4 sq km per satellite/per day; 67.96% of total