
It has been a rough few months for those admirers and users of commercial high-resolution satellite imagery with the announced decommissioning of QuickBird in March; and now we are sad to announce the end of IKONOS’ operational life. Launched into space on September 24, 1999, IKONOS surpassed its life expectancy by nearly ten years. During its nearly 15 years in space, IKONOS collected 599,754 images with 80-centimeter panchromatic and 3.2-meter multispectral resolution. Amassing more than 408 million square kilometers of coverage, IKONOS offers the longest record of any high-resolution commercial satellite ever launched.
 Perhaps one of the most iconic IKONOS images ever collected. This is the site of the World Trade Center just 4 days after the tragedy of 9/11. You can see smoke still rising from the smoldering site of the World Trade Center in this 80-cm color IKONOS image collected on September 15, 2001. We offer this IKONOS data as a visual memorial to the lives lost in this tragic event–we will never forget. (Image Courtesy: DigitalGlobe)
While it is certainly sad to lose one of our most beloved satellites, perhaps the biggest news story associated with the end of IKONOS’ mission is the suspension of all IKONOS archive orders starting immediately. The suspension of IKONOS archive orders is expected to last several months and perhaps into Q3 2015 or beyond. We will alert our valued clients with another Geospatial Times article when sales of the IKONOS archive recommence. We apologize up front for any inconvenience this may cause you!
If you would like to find out more about IKONOS’ technical specifications, you can refer to our website here. Or if you have any questions about the end of IKONOS’ mission or suspension of archive orders, please reach out to the Apollo Mapping sales team at sales@apollomapping.com.
Hopefully that title encouraged you to open this article and check it out as we have two important updates for our high-resolution imagery clients.
First, DigitalGlobe has overhauled their entire licensing system. While there are far too many changes to mention in this short article, we feel the most exciting change is the return of the non-profit discount! All qualifying non-profits will now receive 50% off DigitalGlobe imagery products. That is a huge discount for our treasured non-profits trying to change the world for better. For more details on these license changes, it would be best to give us a call at (303) 993-3863.
Second, DigitalGlobe has increased pricing on several of their core products. The most pertinent change is an increased price for all 50-cm color georeferenced products. For a complete list of the new DigitalGlobe prices, please send us an email at sales@apollomapping.com.
Feel free to reach out to us with any additional questions or clarifications you might have about these two important changes with regards to DigitalGlobe pricing and licenses.
In this monthly feature, we span the globe to examine Our Changing Landscape with time series of medium resolution RapidEye satellite imagery. The RapidEye archive dates back to late 2008 and already contains more than 5 billion square kilometers of data. This month, we revisit a previous edition of Our Changing Landscape with a look at recent changes in the water level of the Dead Sea.
The RapidEye Constellation
 Click on the image above to see the original animation of changes in the Dead Sea’s water depth run in our June 2012 edition. This three layer imagery stack contains 5-meter natural color RapidEye images collected on 1/27/2010, 7/25/2011 and 3/5/2012. Focus on the shoreline in the animation to see the retreat of the Dead Sea during this ~2 year span. (Images Courtesy: RapidEye)
 Now, click on the image above to see an updated animation of RapidEye imagery collected over the Dead Sea on March 5, 2012 (the same final image from the first graphic), March 21, 2013, March 20, 2014 and March 5, 2015. In this updated animation, you will see a continuation in the disturbing trend of rapidly retreating Dead Sea water. If anything, it appears the decline in water level has accelerated recently. (Images Courtesy: RapidEye)
RapidEye is a constellation of five 5-meter medium resolution satellites each offering five spectral bands of information. The RapidEye constellation offers daily revisits to every location on the planet with a huge footprint that is 77-km wide. The data is priced competitively with a starting cost of $1.28 per square kilometer for all five spectral bands–academics do receive discounts. RapidEye adds a fifth band, the red edge, to the ‘traditional’ multispectral set of blue, green, red and near-infrared (NIR). The additional spectral data in the red edge band allows users to extract more useful land ‘information’ than can be from traditional 4-band imagery sources. When RapidEye imagery is ordered as a Level 3A Orthorectified product, images from multiple dates are extremely well registered, making it the ideal data source for Our Changing Landscape.
An Update on the Dead Sea
In the June 2012 edition of Our Changing Landscape, we introduced the pending environmental disaster of the Dead Sea and its surrounding lands; and in this April 2015 edition, we continue the story with a look at changes in this body of water over the past three years. Unfortunately, the story has changed very little since our 2012 article as the water level in the Dead Sea continues to drop. 2015 estimates put the decline in water level at about 1.1 meters per year with the current level at about 425 meters, which is more than 40-meters lower than it was measured in the 1950s.
During December 2013, heavy rains fell on Israel but the water levels in the Dead Sea continued to decline despite increases in surrounding water bodies and aquifers. The drop in December 2013 was about 3-centimeters (cm) which is far less than in December 2012 (i.e. it was 11-cm). That said, it is a disturbing trend to see water levels continuing to drop despite heavy rains. This suggests much of the rain was absorbed by the parched surrounding lands, and that inflows from the Jordan River, the main source of water for the Dead Sea, continue to decline.
One possible ray of sunshine for the Dead Sea is the historic agreement recently reached between Israel and Jordan. In part, the agreement calls for the construction of a desalination plant by the Red Sea to provide clean drinking water to both Israel and Jordan. Further, Israel will sell more water to Jordan from the Sea of Galilee. Finally, the 100 million cubic meters of briny leftovers from the desalination plant will be piped some 180 kilometers to the Dead Sea. While this agreement is a start in slowing the declining Dead Sea water levels, it is not close to the estimated 800 million cubic meters of water that would be required to halt it all together.
If you would like to find out more about using RapidEye for your academic studies, engineering projects or any landscape analysis, let us know at sales@apollomapping.com or (303) 993-3863.
As a DigitalGlobe Gold Partner, we pride ourselves on promoting changes or updates to their suite of imagery products and services to our customers. You may have seen some previous articles from myself and other Apollo Mapping staff members discussing ACC (Advanced Country Coverage) offline/online country-wide, high-resolution basemaps. We’ve recently been informed that ACC has gone through a rebranding and is now known as BASEMAP + VIVID.
In case you didn’t get the chance to read some of our previous articles on this product, below is a high level overview.
What is BASEMAP + VIVID?
BASEMAP + VIVID is a color-balanced, country-wide orthomosaic of 50 cm resolution imagery–mostly WorldView-2 and GeoEye-1, with minimal amounts of QuickBird to fill in coverage gaps. Data sheets for each country mosaic provide imagery age specifics, but in general, roughly 70-80% of the imagery is from 2011 or newer. Please contact me directly for a country-specific data sheet.
What Countries are Available?
Here is a list of the countries currently produced by global region. All produced countries are also available online via a Cloud Services subscription.
| Americas | |||
| Argentina | ElSalvador | Honduras | Nicaragua |
| Belize | Guatemala | Mexico | |
| EMEAR | |||
| Algeria | Ghana | Mali | Sudan |
| Bahrain | Guinea | Mauritania | Swaziland |
| Benin | Guinea‐Bissau | Morocco | Syria |
| BurkinaFaso | Iran | Niger | Tajikistan |
| Burundi | Iraq | Nigeria | Togo |
| Cameroon | Israel | Oman | Tunisia |
| CentralAfricaRepublic | IvoryCoast | Pakistan | Turkmenistan |
| Chad | Jordan | Qatar | Uganda |
| Djibouti | Kenya | Rwanda | UnitedArabEmirates |
| Egypt | Kuwait | SaudiArabia | Uzbekistan |
| Eritrea | Lebanon | Senegal | WestBank |
| Ethiopia | Lesotho | SierraLeone | WesternSahara |
| Gambia | Liberia | Somalia | Yemen |
| GazaStrip | Libya | SouthAfrica | Kazakhstan |
| APAC | |||
| Australia | |||
What Countries are Currently Being Produced?
Here is a list of countries ‘in production’ and an estimated timeline for their completion.
Expected Q2 2015 Completion:
| APAC | ||||
| China (portion) | India | Japan | North Korea | South Korea |
BASEMAP + VIVD Coverage Map–March 2015
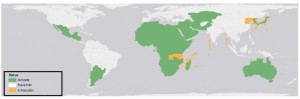
During the past month, Kazakhstan was completed and is now available. India, portions of China, Japan, and North and South Korea are still in production and scheduled to be completed in early Q2 2015.
Can I Have my Country Produced if it’s Not on the ACC List?
BASEMAP + VIVID has a pre-determined product roadmap; and as of today, the production schedule for 2015 is already set because of processing capacity. The process to create ACC, even for a small country, is very time intensive. If there is a project that may require this type of product and you know about it far in advance, then please contact us for a production feasibility.
How is BASEMAP + VIVID Delivered and How Long does it Take?
Each country is expected to be available via FTP approximately 5-15 days after you place an order with Apollo Mapping. If hard drives are requested for delivery, the additional processing and shipping time will be provided by your Apollo Mapping sales rep as part of your quote.
What Can I Customize?
We can certainly review certain customizations such as down-sampling, delivery of partial countries, reprocessing into different files formats, re-projection, delivery on appliances and other options not mentioned.
Who is BASEMAP + VIVD Right For?
 The capital city of Astana, Kazakhstan. Cloud-free coverage from the BASEMAP + VIVD product. (Image Courtesy: DigitalGlobe)
This question has come up often lately and the only answer is, “Anyone who needs a seamless, high-resolution, mostly cloud-free basemap.”
There is no particular industry vertical more appropriate to use this product as we have received inquiries from just about every major industry in the world.
To find more about this one-of-a-kind product and to receive updates, please feel free to reach out to me directly. I’ll be updating this article monthly by presenting new maps and production schedules. We look forward to working with you on your next project.
Robert O’Munneke
Chief of Sales
(703) 304-6425
Robert@apollomapping.com
For three years, Airbus’ twin high-resolution radar satellites, TerraSar-X and TanDEM-X, imaged the entire land surface of our planet multiple times to create the first ever global 12-meter (m) elevation model. The WorldDEM is ideal for all mapping projects requiring accurate elevation models including orthorectification, floodplain determination, mineral exploration and hydrocarbon development.
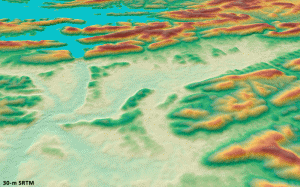 A comparison of 30-m SRTM and 12-m WorldDEMTM elevation data over Arkansas, USA.
WorldDEM March 2015 Product Updates
During March, sections of western Africa, the Middle East and Scandinavia were made available. WorldDEM areas that are available to order take a minimum of 10 days to deliver.
To date, there is more than 88,096,000 square kilometers (sq km) of WorldDEM data that is available! And some 9,100,000 sq km of WorldDEM was made available for delivery in the past month.
WorldDEM Specifications
The key product specifications of Airbus’ WorldDEM are as follows:
- Resolution: 12-m
- Coverage: entire landmass of the Earth, ~150 million square kilometers (sq km)
- Absolute Vertical Accuracy: < 4-m Linear Error 90% (LE90)
- Relative Vertical Accuracy: < 2-m LE90 (slopes ≤ 20%), < 4-m LE90 (slopes > 20%)
- Absolute Horizontal Accuracy: < 10-m Circular Error 90% (CE90)
- Vintage: all data collected within 3 years
- Source: interferometry from synthetic aperture radar (SAR) satellites TerraSAR-X & TanDEM-X
- Minimum Order: 500 sq km per polygon
- File Format: GeoTIFF
- Projection: geographic WGS84 (EGM2008, vertical datum), meter vertical unit
- Product Line Options:
- WorldDEMcore–unedited digital surface model (DSM), includes spikes, wells and voids
- WorldDEM–a DSM with removal of artifacts and water body flattening
- WorldDEM DTM–artifacts and surface features removed, i.e. a digital terrain model (DTM)
WorldDEM Coverage and Pricing
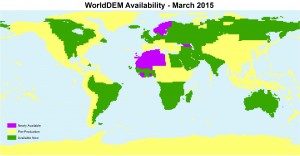 A coverage map of the one-degree cells that are currently available for delivery. Areas that are available will take a minimum of 10 days to deliver.
WorldDEM data has a 500 sq km minimum order size with a 10-km width requirement. Prices for two of the product lines have been set:
-
-
-
-
-
- WorldDEMcore–$10.80 per sq km
- WorldDEMTM–$13.50 per sq km
-
-
-
-
WorldDEM Samples
You can download three 12-m WorldDEMTM samples here:
-
-
-
-
-
- Buraydah, Saudi Arabia–desert with agriculture present; 576 m to 737 m
- Mjosa Lake, Norway–hilly terrain with large water bodies; 100 m to 840 m
- Wagga Wagga, Australia–forest and urban with many water bodies; 137 m to 922 m
-
-
-
-
For more information about 12-m WorldDEM data, please send us an email at sales@apollomapping.com.
Often times, the events of my life inspire the topics I cover in my monthly articles, and well this Geospatial Tip of the Month (GTM) is no exception. For the past six months, my trusty Sony Vaio laptop was on its last leg, so during the slow-down that is common in January, it was time to find a replacement machine. And as you can imagine, when you are required to connect to the Interwebs in order to get your job done on a daily basis, having any downtime is just not acceptable. So in this GTM, I will share some of my experiences searching for the best computer as well as a few software tips that might help you get your job done quicker and more efficiently.
What I Needed in a New Computer
Working with satellite and aerial imagery requires a powerful computer given the typical file sizes of these datasets (i.e. from 400 megabytes to 20 gigabytes [GB] and up). As such, unless you want to spend a lot of timing waiting for files to load, pan across the screen, etc., you need a powerful machine. Here is what I was looking for in a new laptop:
- A Windows-based machine–as many geospatial software packages only run in Windows
- Lots of memory–at least 8 GB of RAM and 1 GB of video RAM
- A powerful processer–a quad-core motherboard running at 2.5 gigahertz (GHz) or more
- Light and portable–with a 13.3” monitor and lighter than 4 pounds
- Extensive disk storage–at least 512 GB
- Reliable–my last Sony laptop lasted 3.5 years of extensive daily use, the new laptop should match this
My First FAILED Experience–An ASUS Zenbook
After hours of research and many a conversation with my Apollo Mapping team members, I settled on a 13.3” ASUS Zenbook. The ASUS I selected meet or exceeded all the expectations set forth above, though admittedly I was concerned about the Window 8.1 operating system having used XP and 7 for the past years. I was very excited when the new Zenbook arrived in a single day and I spent Friday and the weekend installing my files and required software. Well, on Sunday, just two days after receiving my new ASUS, the PCIe SSD hard drive failed and the computer was inoperable–ugh!!
As you can imagine, I was rather upset that my new ASUS failed so quickly, but hey, lemons happen so I was fully prepared to return the broken laptop for a replacement model. This is where the “fun” starts… On Monday, I spent nearly two hours on a combination of hold (the vast majority of the time) and actually speaking to people at ASUS; and after three calls, I was no closer to resolving the issue than when I started. When Tuesday midday hit with not a single call back from ASUS, I transitioned from being annoyed about a lemon to simply pissed off, so it was time to seek out another laptop solution!
Before moving on to the solution I settled on, I need to close the loop on the nightmare with ASUS. On Thursday, I finally received a call from ASUS customer service where I was told I could not return the computer. Well that was not the answer I wanted to hear, so we instantly stopped payment with ASUS and sent the computer back to them–unreal that a company would not take back a clearly defective product. In the end, two weeks later, I received an email that my return was accepted and that a credit would be issued, but seriously, avoid ASUS products at all costs!!
An Ideal Solution–A MacBook Pro Running Windows 7
The title pretty much says it all. After much considerations and several calls with very knowledgeable and friendly Apple employees, I settled on a 13.3” MacBook Pro with a Retina display, 16 GB of RAM and a 3.0 GHz processor. I had considered an Apple product in the past but I was concerned that programs like ENVI would not be able to harvest the required serial number from the motherboard in order to license the software. Well, my experience with ASUS and the positive one with Apple, the lack of any other similar powerful and transportable laptops and the fact that they use Intel chips now said it was time to give a Mac a try–and thank goodness I did, I could not be happier!
Here are a few tidbits of knowledge I can share from the start of the installation process in Mac’s OS X Yosemite operating system:
- Do not use FileVault 2!!! Avoid it like the plague. When I started the setup process on my new Mac Pro, one of the questions was using the file encryption software called FileVault 2. It seemed innocent enough to me and since more security is a good thing, I opted in. In the end, the encryption process failed and after two calls to (again) very knowledgeable and friendly Apple technical support employees, I had to format hard drive and reinstall my entire operating system. Which was a breeze given the internal recovery mechanisms built into all MacBooks.
- While I was willing to give a MacBook a chance, I was not willing to use OS X. But thankfully Apple makes it easy to install a copy of Windows on your new MacBook with a program called Boot Camp. With the help of a 4 GB USB drive, I was able to install a copy of Windows 7 Pro on my new laptop, so off and away I went installing software and copying over files!
Some Software I Cannot Live Without
Now that I have given you my feelings on the best computer to use in the geospatial industry, a MacBook Pro, it is time to share a few of the software packages and add-ons I could not live without!
- Avast–this is the most robust and lowest ‘memory hog’ of any active antivirus software I have ever tried out.
- CCleaner–this software will clean up temporary files and other unnecessary files that are missed by most other disk cleanup utilities.
- Dropbox–this program is an automated cloud storage system that lets you sync files to multiple machines as well as stores changed and deleted versions of your files as an added bonus.
- ENVI Output to Tile– this ENVI Classic add-on lets you output a raster file to a set of tiled images, super handy and the only tool like it that we have found!
- ET Geowizards–an invaluable add-on for ArcGIS loaded with tons of commonly needed tools for vectors and rasters.
- FastStone Capture– a great freeware program that lets you take custom-sized screengrabs of your screen.
- Glary Utilities–a self-fix program that will keep your Windows operating system working as fast and smoothly as possible.
- Google Chrome Tab Saver–this browser add-on will store your open tabs which saves time if you often open the same set of websites.
- Intel Driver Update Utility–this software will keep your Intel graphics card, modem, etc. drivers up to date with a single button push.
- KatMouse–this lightweight program works well with Windows 7 and lets you mouse-wheel scroll through a program window on your desktop even if it is not active; which is super handy if you have a bunch of windows open and are copying data from one program to another.
- KoolCal–this calendar application is lightweight and super easy to use, I would forget every major event on my schedule without it!
- Malwarebytes–this tool removes viruses that many other programs miss.
- Thunderbird Quicknote–this Thunderbird add-on lets you draft an email with a keystroke which saves time if you send form emails out commonly.
- Thunderbird XNote++–and this Thunderbird add-on lets you add sticky notes to emails as a quick reminder of where you are at with things.
A short YouTube video showing you a few of the programs I could not make it through a day of work without as well as turning on XP DPI Scaling.
Dealing With High Resolution Monitors and Low Resolution Software
Many new laptops come with extremely high resolution monitors, such as the 2560 x 1600 Retina display on MacBook Pros. While this extra resolution sounds amazing, practically speaking few software packages or websites take full advantage of the extra pixels. And the software/websites that do not take advantage often look quite wonky on your monitor, be it on my Retina display or the high res monitor on ASUS Zenbooks.
The solution I found is a combination of changing your monitor’s DPI as well as a function called XP DPI Scaling–in the video that accompanies this GTM, I will show you how to turn these on in Windows 7 Pro. I am currently using a 150% DPI setting and it produces crisp fonts and menus of appropriate sizes (or at least it usually does–nothing is perfect after all). Originally, I tried a 156% DPI scaling but in many cases menu items blurred together and text was not well centered. I have noticed that XP DPI Scaling forces programs to have tiny, yet crisp text and icons; for some users, these items might be too small. In this case, you might try to disable compatibility DPI scaling which forces programs to use larger text and fonts but creates a fuzzy appearance. You can read more about DPI scaling here and here; this resource gives you more tips on making Windows look nice on high res monitors; and finally this is more of a developer’s take on DPI issues.
Do you have an idea for a future GTM? If so, let me know by email at brock@apollomapping.com.
Brock Adam McCarty
Map Wizard
(720) 470-7988
brock@apollomapping.com

If you are anything like me, keeping your computer up to date with the most recent drivers possible is a high priority. And while Windows Update does a great job keeping this software and many drivers current, it has definitely missed a few crucial updates for me time and time again. Well, this excellent freeware utility from Intel makes keeping your crucial Intel drivers up to date a snap! Depending on your computer, the Intel Driver Update Utility can automatically detect and update graphics, modem, Bluetooth drivers and more with just a few button pushes.
Until my next edition of the Free For All, happy hunting for free geospatial goodies!
Brock Adam McCarty
Map Wizard
(720) 470-7988
brock@apollomapping.com
 This map shows the areas imaged by the Pléiades 1 constellation from January 1 to January 31, 2015 over southern Africa and Madagascar. Please note that in many instances, multiple images were collected over the same area which is difficult to portray on this static map.
In this monthly piece, we give our readers a sense of the high-resolution imagery coverage collected over a geography during a specified window. To do this, we pick a high resolution satellite, a defined time period and area of interest, then report key statistics on the total amount of imagery collected in square kilometers (sq km). Without further delay, let’s jump into our analysis.
Graphic Region of Interest: Southern Africa and Madagascar
Land Mass Covered: 9,870,194.5 sq km
Time Period: January 1 to January 31, 2015
High Resolution Satellite Constellation: Pléiades 1A + 1B
Pléiades 1 Constellation Imaging Statistics–Southern Africa and Madagascar
Total Area Collected: 495,311.4 sq km; 7,988.9 sq km per satellite/per day
Area Collected @ 20% or Less Clouds & 30 Degrees Off-Nadir: 183,986.6 sq km; 2,967.5 sq km per satellite/per day; 37.15% of total