
If you thought that this was an invitation to a cool party, well no. But someone please take note, we need a Cocktails and Great Maps event. I feel like some mappy folks might be excited about it. If you’re following along with my column, you’ll realize that some inspiration or interesting fact crosses my mind or desk that spawns an interactive search for aha moments on the topic that is remotely spatial in nature.
Today’s inspiration felt like a reach at first. An article about wild chimps enjoying “boozy fruit” as part of their regular habits. Anna Bowland from the Centre for Ecology and Conservation at Exeter’s Penryn Campus in Cornwall said, “We also know that sharing alcohol–including through traditions such as feasting–helps to form and strengthen social bonds. So–now we know that wild chimpanzees are eating and sharing ethanolic fruits–the question is: could they be getting similar benefits?” It is interesting research and made me think. How much research and data is out there about alcohol and wine, and their consumption.
 Photo created in Canva.
Our chimpanzee friends prefer a natural process to create their “booze.” After a recent trip to the Texas wine country, I learned more about wine production than I had learned at other tasting experiences. The bottle of wine that you’re enjoying might have been produced from grapes in multiple locations, not just the winery of the label. I recommend signing up for an educational tasting experience with a sommelier and some friends. I learned more about the information on the label, the life of different types of wine, and how much to spend. To find an experience near you, check out WineMaps.com. You can filter by winery or wine bars globally. While I’m sure some fine wineries might not be represented here, it is one option to start planning that next wine trip. Old school maps might be your preference. If so, peruse the WineTourism maps available to download and print. They also have an interactive map where you can quickly zoom down to a winery and the cost of experiences there. If you’d prefer a more geographic approach to the information, “The Geography of Wine” shares some insights into wine regions and uses GIS to explore that data.
Perhaps wine isn’t your thing. If you enjoy an interesting cocktail, Taste Atlas has an interactive map showcasing the origin of global cocktails with links to recipes and ingredients. Each cocktail is also cross-referenced with other drinks of similar origin or ingredients. If you’d like to focus on the United States, the folks at VinePair have an interesting article about the birthplace of US cocktails like a cosmopolitan, lemon drop, rum runner, or sazerac.
Origins and social culture of regions vary. According to another article on vinepair.com, “in 2022 Americans consumed a whopping 7.9 billion gallons of alcohol via beer, wine, and spirits.” Global alcohol consumption data says our European friends lead the world in consumption per capita, and men surpass women; however, heavy drinker data takes us to the African continent. According to Worldmapper data from 2018, “The average Western European drinks over a third more alcohol than the average person living in any other region.” The cartograms on this site are particularly interesting…puffy maps. They are a great way to introduce data to non-GIS folks. It might make you look even smarter at the cocktail party!
Like a game of six degrees, boozy fruit eaten by chimps connects to a wine trip then grapes and geographic regions. That information sends us over to regional cocktails and then alcohol consumption data. Turns out geospatial connections are a little like Kevin Bacon (iykyk)!
Happy Summer! If you need me, I’m making a fresh batch of lemon martinis from my favorite recipe…just right for the hot July days.
Barbaree Duke
Geospatial Crusader
In this monthly feature, we span the globe to examine Our Changing Landscape with a time series of medium-resolution PlanetScope satellite imagery. The PlanetScope constellation dates back to 2016 and collects hundreds of millions of square kilometers of four and eight-band 3-meter imagery daily! In June, we checked out the 2024 edition of the Bonnaroo Festival, which ran from June 13th to 16th with artists performing on more than 10 stages. For the July edition of this series, we are looking at the 7.7 earthquake in Myanmar that hit the area on March 28, 2025.
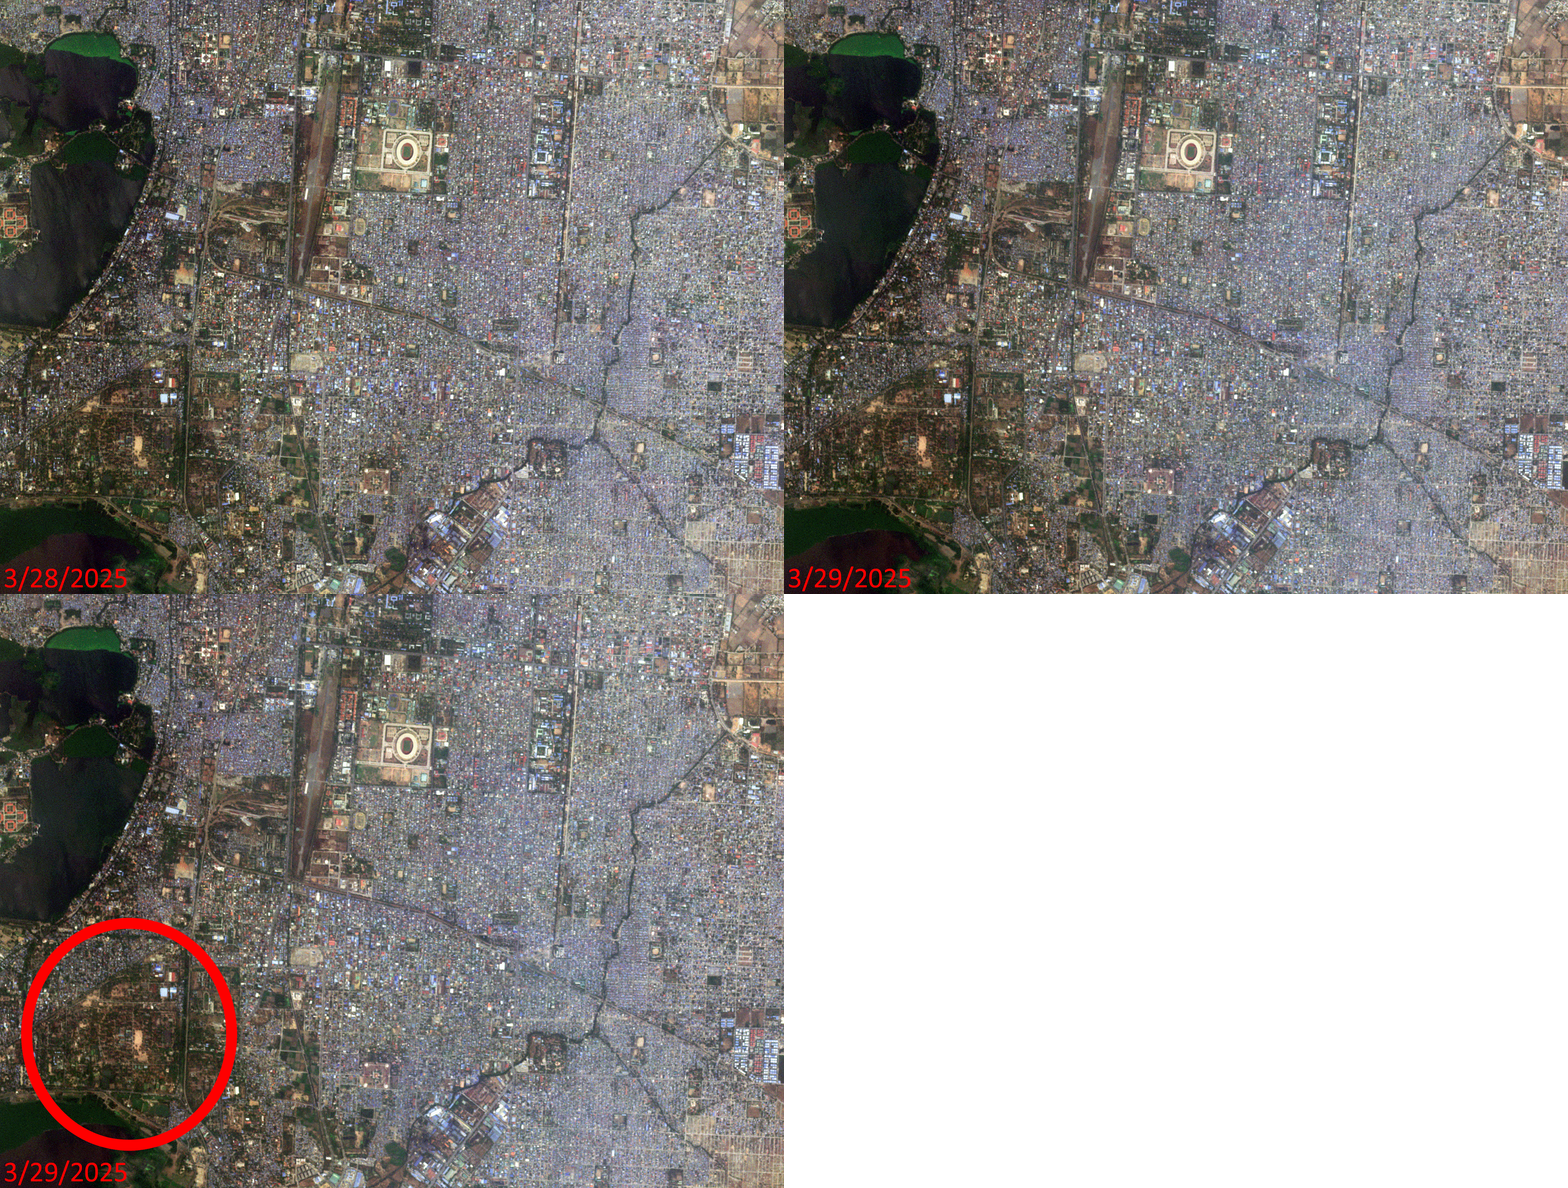 Click on the image above to see an animation of 3-meter natural color PlanetScope image collected over Mandalay, Myanmar on March 28 and 29, 2025. In this animation, we actually capture Mandalay the day of the 7.7 magnitude earthquake just hours before it struck–very sad indeed; as in the March 29th image, even at 3-meter resolution, the extent of the destruction is obvious. In the third slide, we circled a region to track in the animation to see the extent of the destruction. Our hearts are with the nation of Myanmar as they grieve and recover from this major disaster. (Images Courtesy: © Planet 2025)
The PlanetScope Microsat Constellation
PlanetScope is a constellation of more than 240 microsats referred to individually as Doves. Each Dove is able to collect up to 20,000 square kilometers (sq km) per day of 3-meter (m) 4-band multispectral (i.e. blue, green, red and near-infrared [NIR]) imagery; and newly launched SuperDoves collect 8-band multispectral adding in valuable red-edge spectral data. Across the constellation, PlanetScope is archiving more than 200 million sq km of medium-resolution imagery a day, making it the go to source for daily imagery over most locations. This massive archive dates back to 2016, offering the most complete and continuous record of spatial data on the planet since the start of the constellation’s ongoing launch schedule. Collecting 3-meter multispectral imagery is the equivalent of ‘high-resolution’ multispectral data imaged by a 75-centimer (cm) satellite (as this satellite would feature 75-cm panchromatic and 3-m multispectral), making PlanetScope an extremely competitively priced option at just $2.25 per sq km. With well registered images and nearly daily collections of most locations, PlanetScope is the ideal imagery source for this current-events focused series, Our Changing Landscape.
March Earthquakes In Myanmar
More than 3,000 people died and another 4,500 were injured when a 7.7 magnitude earthquake rattled Myanmar on March 28, 2025. The earthquake was so strong that it could be felt in Thailand and southwest China, according to the BBC.
The epicenter of the earthquake was near the country’s second largest city, Mandalay. The first tremor could be felt around 12:50 p.m. followed by a second earthquake 12 minutes later that registered 6.4. Aftershocks continued to ripple for days, even reaching magnitudes of 5.1. A little more than 600 miles away, a high-rise building in Bangkok toppled because of the earthquake, the BBC reported.
The damage caused by the earthquakes could be seen in the buckled roads, damaged bridges and flattened buildings. A state of emergency was declared in the six most damaged regions. People were trapped for days and searchers dug through rubble with bare hands to try and unearth them, reported the BBC. Hundreds of people remained missing in the days following the earthquake.
Two months later, on May 6th, 10 mild earthquakes with magnitudes ranging from 1.3 to 3.0 were recorded in Myanmar as well as in northern and northeastern Thailand in the morning, according to the Thai Meteorological Department.
The earthquakes arrived at a time when the war-struck region was already struggling. Four years of war has ravaged Myanmar; 3 million people have been displaced by the fighting and the earthquake has only deepened an already dire humanitarian crisis in which at least 20 million people need aid, according to CNN.
If you would like to find out more about using 3-meter PlanetScope imagery for your academic studies, engineering projects or any landscape analysis, let us know at sales@apollomapping.com or (303) 993-3863.
¡Bienvenidos a julio! Nosotros en Apollo Mapping estamos gustosos de tenerlos otro mes aquí en los resúmenes españoles del mes de julio.
Producto Destacado–Monitoreo de Sitios con Descuento usando Pléiades Neo de 30 cm
 Imagen en color de 30 cm capturada por Pléiades Neo el 28 de abril de 2023 sobre Roozengaarde, en el Valle de Skagit, Washington, EE. UU., durante el Festival Anual de los Tulipanes.
En el mundo en constante evolución de la tecnología geoespacial, Airbus ofrece una solución revolucionaria para la recolección repetida de imágenes. Pléiades Neo OnePlan es una potente herramienta de monitoreo que combina innovación de vanguardia con una capacidad de recolección inigualable a una resolución de 30 centímetros (cm).
Con Pléiades Neo de 30 cm, los clientes de Apollo Mapping pueden monitorear el crecimiento urbano, seguir los cambios ambientales y obtener información valiosa sobre el desarrollo de infraestructura con una precisión sin precedentes. Sus capacidades de última generación garantizan una entrega de datos oportuna, lo que permite tomar decisiones informadas como nunca antes. Airbus tiene un historial comprobado de recolección rápida de imágenes de alta calidad, lo que lo convierte en la mejor opción para aplicaciones de monitoreo.
La solución de programación Pléiades Neo OnePlan ofrece una estructura de precios flexible, con un costo por kilómetro cuadrado con descuento, lo que la convierte en una excelente opción para una amplia gama de aplicaciones.
Pléiades Neo de Airbus también ofrece un impresionante tiempo estándar de entrega de 12 horas o menos una vez que la imagen ha sido capturada y descargada, asegurando acceso rápido a los datos más recientes cuando más los necesitas. Descubre un mundo de posibilidades en monitoreo, análisis y toma de decisiones con las tareas programadas de Pléiades Neo OnePlan a resolución de 30 cm.
Para obtener más información sobre las tareas de monitoreo con Pléiades Neo OnePlan a 30 cm, envíanos un correo en cualquier momento a sales@apollomapping.com y te responderemos de inmediato.
Imagen del mes en color a 30 cm–Neom, Arabia Saudita
 Neom es una arcología y ciudad planificada actualmente en construcción por Arabia Saudita en la provincia de Tabuk. Lanzado en 2017 por el príncipe heredero Mohammad bin Salman, el sitio se ubica en el extremo norte del Mar Rojo, al este de Egipto, frente al Golfo de Aqaba y al sur de Jordania. El área total planificada de Neom es de 10,200 millas cuadradas. Están previstas múltiples zonas dentro del proyecto, incluyendo un complejo industrial flotante, un centro global de comercio, resorts turísticos y una ciudad lineal alimentada por fuentes de energía renovable. Arabia Saudita afirma que Neom creará alrededor de 460,000 empleos y añadirá aproximadamente $48 mil millones al PIB del país. Miles de personas han sido desplazadas por la fuerza para dar paso al proyecto, y varias aldeas han sido demolidas. Aunque se planea que la mayor parte de la ciudad esté terminada para 2039, algunos expertos han expresado escepticismo sobre las ambiciones de este megaproyecto. Los costos estimados superan los 8.8 billones de dólares (más de 25 veces el presupuesto anual de Arabia Saudita). Inicialmente, Arabia Saudita tenía como objetivo completar las partes principales del proyecto en 2020 y expandirlo para 2025, pero el plan se ha retrasado considerablemente. El nombre Neom proviene de dos palabras. Las tres primeras letras vienen del prefijo griego antiguo neo, que significa “nuevo”. La “M” es la inicial de Mustaqbal, una palabra árabe que significa “futuro”. La “M” también representa la primera letra del nombre del príncipe heredero, Mohammed bin Salman. En las imágenes de WorldView Legion a 30 cm que se presentan aquí, puede observarse el campus de Neom donde se alojan los trabajadores; y en la otra imagen, se ve la construcción del edificio The Line. Las imágenes fueron capturadas el 29 de enero de 2025 y han sido procesadas por Apollo Mapping con balance de color personalizado. (Imágenes satelitales © 2025 Maxar Technologies)
En esta serie mensual, viajamos por el mundo para observar muestras únicas, curiosas y a veces un poco extrañas de imágenes en color a 30 centímetros (cm) capturadas por la constelación WorldView. En junio, exploramos dos imágenes sobre campos agrícolas al noreste de Gaborone, Botsuana. Para esta edición de la Imagen de 30 cm en Color de WorldView del Mes, destacamos dos imágenes capturadas desde gran altura sobre el campus de Neom, en Arabia Saudita.
WorldView-3 (WV3) fue lanzado a finales de 2014, WorldView-4 (WV4) a finales de 2016, y los primeros satélites WorldView Legion se lanzaron en 2024. Juntas, estas plataformas forman la constelación satelital más avanzada a la que ha tenido acceso el mercado comercial.
Algunas características que distinguen a estos satélites de la competencia:
- Resolución Mejorada
- Mayor resolución significa mayor nivel de detalle en las imágenes de WorldView.
- Datos recopilados en nadir incluyen: 31 cm pancromático, 1.24 m en visible e infrarrojo cercano, 3.7 m SWIR (solo WV3) y 30 m CAVIS (solo WV3)
- Bandas Espectrales Adicionales
- Para análisis espectral, ningún otro satélite iguala a WorldView-3 y WorldView Legion con sus 8 bandas en visible e infrarrojo cercano; y también 8 bandas SWIR (solo WV3) que son esenciales para estudios geológicos
- Precisión Posicional Mejorada
- Con una precisión de 3.5 m CE90% o mejor (¡incluso sin control terrestre!), la constelación de WorldView de 30 cm no tiene rivales en cuanto a precisión posicional mejorada.
- Revisitas Diarias
- Con múltiples satélites WorldView-3 y WorldView Legion orbitando el planeta, se pueden obtener imágenes diarias en la mayoría de las ubicaciones.
- WV4 ya no recopila imágenes nuevas.
- Mayor Capacidad de Recolección
- WV3/WV4 cuentan con un ancho de barrido de 13.1 km en nadir, con la capacidad de recolectar hasta 680,000 km² de datos de alta resolución por día y por satélite (aunque WV4 ya no está operativo).
- Cuando esté completamente desplegada, WorldView Legion contará con seis satélites de 30 cm, aumentando significativamente la capacidad de recolección de esta constelación líder en alta resolución.
Si estás interesado en imágenes de WorldView-3, WorldView-4 o WorldView Legion para tu próximo proyecto, contáctanos por teléfono al 303-993-3863 o por correo a sales@apollomapping.com.
También puedes encontrar más muestras e información técnica sobre WV3, WV4 y WorldView Legion en nuestro sitio web.
Colecciones de Imágenes de Alta Resolución Pléiades 1–Europa (excepto Rusia), febrero a mayo de 2025
 Este mapa muestra las áreas captadas por la constelación Pléiades 1 entre el 19 de febrero y el 19 de mayo de 2025 sobre Europa y sus islas, excluyendo Rusia. Ten en cuenta que en muchos casos se recolectaron múltiples imágenes sobre la misma zona, lo cual no se refleja fácilmente en este mapa estático.
En esta serie mensual ofrecemos a nuestros lectores una visión general de la cobertura de imágenes satelitales de alta resolución recolectadas sobre una región durante un período determinado. Para ello, seleccionamos una constelación satelital, un marco temporal y un área de interés específicos, y luego reportamos estadísticas clave sobre la cantidad total de imágenes recolectadas en kilómetros cuadrados (km²).
Región Gráfica de Interés: Europa y sus islas asociadas, excluyendo Rusia
Superficie Terrestre Cubierta: 5,966,899.4 km²
Período de Tiempo: del 19 de febrero al 19 de mayo de 2025
Constelación de Satélites de Alta Resolución: Pléiades 1 (Pléiades 1A y 1B)
Estadísticas de Imágenes de la Constelación Pléiades 1–Europa (excepto Rusia)
Área Total Recolectada: 2,230,968.3 km²; 12,394.3 km² por satélite/día
Área recolectada con 20% o menos de nubes y 30 grados o menos de inclinación: 1,247,923.9 km²; 6,932.9 km² por satélite/día; 55.94 % del total
Fernando Gutierrez
Topographic Translator
In the ever-changing world of geospatial technology, Airbus offers a groundbreaking solution for repeat imagery collections. Airbus’ Pléiades Neo OnePlan is a powerful monitoring solution that combines cutting-edge innovation with unparalleled collection capability at 30-centimeter (cm) resolution.
A 30-cm color Pléiades Neo image collected on April 28, 2023 over Roozengaarde in the Skagit Valley, Washington, USA during the annual Tulip Festival.With 30-cm Pléiades Neo, Apollo Mapping clients are able to monitor urban growth, track environmental changes, and gain valuable insights into infrastructure development with unprecedented resolution and repeat collections. Its state-of-the-art capabilities ensure timely data delivery, enabling informed decision-making like never before. Airbus has a successful track record of quickly collecting beautiful imagery, making it the best option for monitoring applications.
The Pléiades Neo OnePlan tasking solution has a flexible pricing structure, offering a discounted per-square-kilometer cost that makes it a fantastic choice for a wide range of applications.
Airbus’ Pléiades Neo also boasts an impressive standard delivery time of 12 hours or less once the imagery is collected and downlinked, ensuring that you have access to the latest data when you need it most. Unlock a world of possibilities in monitoring, analysis, and decision-making with 30-cm resolution Pléiades Neo OnePlan tasking.
To find out more about 30-cm Pléiades Neo OnePlan tasking for site monitoring, send us an email at any time to sales@apollomapping.com and we will get right back to you!
- I can’t wait to share this month’s list of technological advancements with you, so without delay let’s go!
This postage-size circuit can create energy from sunlight and carbon dioxide.
A new class of antibiotics is discovered.
This is a soft, squeezable battery.
Durable and efficient perovskite solar cells designed.
A new class of crystals could power future technology.
Did you know that plants can hear?
New material collects water without the need for energy inputs.
A glimpse at next-generation electric commercial airplanes.
And this super-charged fuel cell could power an airplane one day.
A step forward in green ammonia production.
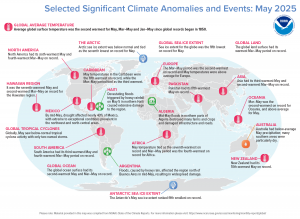
In May 2025, North America experienced its sixth warmest May and fourth warmest March-May period on record. The arctic sea ice extent was below normal and tied for the seventh lowest on record for May. Devastating floods triggered by heavy rainfall on May 5th in northern Haiti caused extensive damage to the region. By mid-May, drought affected nearly 40% of Mexico with extreme to exceptional conditions prevalent in the northwest and north-central areas. Floods caused by heavy rain affected the region north of Buenos Aires, Argentina in mid-May, resulting in widespread damage. Oceania saw its second warmest March-May on record with above average temperatures in May. (Image Credit: NOAA Global Climate Report)
- The Global Climate Change Report for May 2025 has been released by NOAA’s National Centers for Environmental Information and reveals further proof that global climate change remains a concern. May temperatures were much warmer than average across much of the globe, particularly across most ocean areas and parts of every continent. Higher temperatures were most notable in northern North America, the central and southern parts of South America, the British Isles and surrounding ocean, northern and southwestern Asia, and across much of Antarctica and the Arctic region. Despite the unusual warmth across much of the globe, record-warm temperatures were limited to parts of the Arctic region, the British Isles and surrounding ocean, southwestern Asia, across parts of the western Indian Ocean, the western Pacific Ocean, and a small area in Mexico. Overall, approximately 7% of the world’s surfaces hit a record-high May temperature. This percentage is the second-highest on record for May, following the all-time record of 15% set in May 2024. The global land-only surface temperature for May 2025 was also the second-highest in the 176-year record, with a temperature 1.61°C (2.90°F) higher than the 20th Century average. May 2024 was the warmest on record, with a temperature 1.63°C (2.93°F) higher than average. The global ocean surface had its second warmest May and March-May on record. The global ocean-only May surface temperature was 0.88°C (1.58°F) higher than average–also the second-highest for May in the 176-year record. Only May 2024 was warmer (+0.98°C / +1.76°F). May 2025 saw varied precipitation patterns globally. Many regions experienced drier-than-average conditions, including parts of North and South America, as well as northern Europe, southwestern Asia, southern Australia and areas in Russia and China. Southern Alaska, the eastern U.S., northern and southern parts of South America, northern and southeastern Australia and widespread parts of Asia had wetter-than-average conditions. Preliminary data indicates that the May 2025 globe land, averaged as a whole, had the wettest May in the historical record, which spans from 1979 to present.
- Summer is here and with it comes hordes of sunbathers seeking the sun’s rays to bask in. Many use what’s called the UV, or ultraviolet, index to determine if the sun’s rays are strong enough to lay out in and at what times. The UV index can be analyzed and visualized across different geographic locations, providing valuable information for public health and environmental studies. This helps in understanding UV exposure patterns, assessing risks such as for skin cancer, and developing targeted prevention strategies. Here is a quick summer of how GIS is used in conjunction with the UV Index:
Mapping UV Index Values:
GIS can map UV index data, creating spatial representations of UV radiation levels across regions, cities, and even city blocks.
Analyzing UV Exposure:
GIS can be used to analyze UV exposure levels based on factors like time of day, season, altitude, and cloud cover.
Understanding Health Impacts:
GIS can be used to link UV index data with health outcomes, such as sunburn rates, skin cancer incidence, and other UV-related health problems.
Public Health Planning:
GIS can help identify areas with higher UV exposure risks, enabling public health professionals to develop targeted education and prevention programs.
Environmental Studies:
GIS can be used to study the impact of UV radiation on ecosystems and other environmental processes.
Forecasting and Prediction:
GIS can be used to create UV index forecasts and predict future UV radiation levels based on various factors.
Public Health Education:
GIS can be used to create maps showing UV index values and recommend appropriate sun protection measures for specific locations.
Skin Cancer Research:
GIS can be used to investigate the spatial patterns of skin cancer diagnoses and identify potential environmental factors contributing to its diagnosis.
Environmental Monitoring:
GIS can be used to monitor UV radiation levels over time and track changes in UV exposure patterns.
Brock Adam McCarty
Map Wizard
(720) 470-7988
brock@apollomapping.com
In June, we looked at the rugged San Juan Mountains of Southwestern Colorado where the Telluride Bluegrass Festival offers a music festival set in the beautiful mountains. This month for the Pléiades 1–Pléiades Neo Point of Interest, we discover the history behind Castillo De San Marcos in St. Augustine, Florida, which is the oldest permanently settled city in the United States.
About the Point of Interest: Castillo de San Marcos is the oldest masonry fort in the continental United States. It is located on the western shore of Matanzas Bay in St. Augustine, Florida. It was designed by the Spanish engineer Ignacio Daza, with construction beginning in 1672, 107 years after the city’s founding by Spanish Admiral and conquistador Pedro Menéndez de Avilés, when Florida was part of the Spanish Empire. The fort’s construction was ordered by Gov. Francisco de la Guerra y de la Vega after a raid by the English privateer Robert Searles in 1668 that destroyed much of St. Augustine and damaged the existing wooden fort. The construction of the core of the current fortress was completed in 1695, although it has undergo many alterations and renovations over the centuries.

 These two satellite images show the island from above. The Pléiades Neo 4 30-cm color image is from July 12, 2024, and shows the lay of the land and how the city was originally created around the historic fort. In the second photo, a Pléiades 1A 50-cm image captured January 3, 2025, you can see the growth of the community outward from the fort. These images have custom processing and color balancing applied by Apollo Mapping. PLEIADES © CNES 2025, Distribution Airbus DS.
Fun Factoids: (1) When Britain gained control of Florida in 1763 pursuant to the Treaty of Paris, St. Augustine became the capital of British East Florida, and the fort was renamed Fort St. Mark until the Peace of Paris (1783), when Florida was transferred back to Spain and the fort’s original name was restored. (2) In 1819, Spain signed the Adams–Onís Treaty which ceded Florida to the United States in 1821; consequently, the fort was designated a United States Army base and renamed Fort Marion, in honor of American Revolutionary War hero Francis Marion. (3) The fort was declared a National Monument in 1924, and after 251 years of continuous military possession, it was deactivated in 1933. (4) The 20.48-acre (8.29 ha) site was subsequently turned over to the United States National Park Service. (5) In 1942 the original name, Castillo de San Marcos, was restored by an Act of Congress.
The 50-cm Pléiades 1 High-Resolution Satellite Constellation
The Pléiades 1 constellation (or at least part of it!) has been in orbit since December 2011 and if you have not had a chance to check out any sample imagery, take a few moments and have a look at the gallery on our website. If you work with high-resolution imagery, you should consider Pléiades 1 and Pléiades Neo for your next geospatial projects.
A variety of Pléiades 1 products are available from both a well-established archive and as a new collection, including 50-centimeter (cm) pansharpened imagery and 50-cm panchromatic–2-meter (m) 4-band multispectral bundles. We are happy to discuss the technical specifications, pricing and tasking options available with both of these satellite constellations.
The 30-cm Pléiades Neo High-Resolution Satellite Constellation
Pléiades Neo is our newest high-resolution satellite constellation. The first Neo satellite went up in April 2021 and the second in August of the same year. This 30-centimeter resolution constellation will add two more satellites in the next few months and upgrade from daily to intraday revisits. Pléiades Neo has six multispectral bands with 1.2-meter resolution, including a deep blue and two infrared bands, along with a 30-centimeter resolution panchromatic band.
The archive is growing every day, and the satellites are available for new collections, making Pléiades Neo the perfect solution for site monitoring. Check out our beautiful sample images in the Pléiades Neo gallery.
More sample images and technical information about Pléiades 1 can be found on our website here; while the same can be found here for the Pléiades Neo constellation.
The Apollo Mapping sales team can answer any questions you might have about Pléiades 1 and/or Pléiades Neo. We can be reached at (303) 993-3863 or sales@apollomapping.com.
 This map shows the areas imaged by the WorldView-2/3 constellation from June 1 to August 31, 2024 over Sub-Saharan Africa. Please note that in many instances, multiple images were collected over the same area which is difficult to portray on this static map.
In this monthly piece, we give our readers a sense of the high-resolution imagery coverage collected over a geography during a specified window. To do this, we pick a high-resolution satellite constellation, a defined time period and area of interest, then we report key statistics on the total amount of imagery collected in square kilometers (sq km). Without further delay, let’s jump into our analysis.
Graphic Region of Interest: Sub-Saharan Africa plus off-shore islands
Land Mass Covered: 16,510,458.9 sq km
Time Period: June 1 to August 31, 2024
High-Resolution Satellite Constellation: WorldView-2/3
WorldView-2/3 Constellation Imaging Statistics–Sub-Saharan Africa
Total Area Collected: 8,356,120.0 sq km; 45,413.7 sq km per satellite/per day
Area Collected @ 20% or Less Clouds & 30 Degrees or Less Off-Nadir: 3,712,693.1 sq km; 20,177.7 sq km per satellite/per day; 44.43% of total
I have encountered many situations where the solution wasn’t readily available. Perhaps “the plan” didn’t pan out or something “broke.” What do you do? You find a fix, a reasonable conclusion, or a theory to try so you can move forward. I’ve been told that I am creative and innovative. While I noticed my idea might be unique in that circle of people, I often wondered if I had truly been creative or just survived the circumstance by working the problem with a viable solution. Maybe I just found a new problem that no one else noticed and sought to fix it.
This topic comes up often with a dear friend and collaborative colleague of more than 25 years. Together we have been labeled as “super creative…a dynamic duo.” We never see it that way. She says, “I have had to work at it. Everyone has creativity that comes out when given the right opportunities, and you surround yourself with people who allow you to be who you are and appreciate the talents and experiences you bring to the table.” I believe that we must acknowledge that personal perspective and a willingness to help find solutions drive how creative we become. Over time, you choose to improve that skill, or don’t.
 Image created by B. Duke in Canva.
In this article, “Creativity Can Be Learned,” creativity is defined as generating new ideas. In a fast-changing world, new ideas and solving problems becomes more important than just knowledge. Dr. Tina Seeling believes we can learn this skill. In her TEDXStanford talk, “A crash course in creativity,” she shares her conclusion that our individual attitude, knowledge, and imagination (imagination engine) combined with our habitat, culture, and resources are the key to unlocking personal creativity.
Unfortunately, our life experiences have squelched potential, even discouraged looking beyond the box, the right answer, or the minimum required. Sir Ken Robinson made a case several years ago for school undermining creativity. George Land said that creativity has been buried by rules and regulations. We understand the importance of innovation and creativity in GIS. In fact, geospatial technologies are a collection of tools we use to research, document, analyze, and visualize both problems and solutions.
How do you jumpstart your creativity? Steven Kotler shares these three science-based strategies:
- Make friends with your ACC. “Right before people viewed a problem that they’d eventually solve with insight, there was heightened activity in their brain’s anterior cingulate cortex (ACC). The ACC plays a role in salience and executive attention, and it’s the part that handles error correction by detecting conflicting signals in the brain.” The things we discussed in previous posts, will help fire up your ACC and in turn spawn your creativity.
- Understand the importance of time. “We need to build non-time into our schedules. Non-time is time for daydreaming and psychological distancing. Daydreaming switches on the default mode network, enabling our subconscious to find remote associations between ideas. Non-time also gives us a little distance from our problems. That allows us to see things from multiple perspectives, to consider another’s point of view. If we don’t have the time to get that space from our emotions and take a break from the world, then we won’t have the luxury of alternative possibilities.”
- Think inside the box. “That’s why one of my cardinal rules in work is: Always know your starts and your endings. If I have these twin cornerstones in place, whatever goes in between — a book, an article, a speech — is simply about connecting the dots. Without dots to connect, I can get stuck or waste time wandering into tangential territory (which helps explain why my first novel took 11 years to complete).”
Here are some things that help me “be creative,” when an answer doesn’t seem obvious:
- Phone a friend. Talk through the problem with a coworker or trusted friend. Two heads are most often better than one. Sometimes you just need to say it outloud, and bring it into the light for a new solution to make sense.
- Poll the audience. Crowdsourcing is almost “normal” today. With social media, forums, and open-source resources, you probably have good company in needing a solution.
- Research the topic. Often a simple internet search on the general topic leads me down a few rabbit holes of inspiration and enlightenment on the topic.
“Everyone has the key to their innovation engine, it’s up to them to turn it.”–Dr. Tina Seeling
If you need me, I’m already working on a new creative project!
Barbaree Duke
Geospatial Crusader