
I remember the first time I saw those mountains. Actually, I thought about them long before I saw them. I had really only heard about them. And that was good enough. But I had aspirations long before those mountains. But I guess, in retrospect, those aspirations didn’t measure up to those mountains. Those mountains were simultaneously a culmination and a beginning; what I strived for, and what I hoped to achieve. Little did I know those mountains would be the opposite of what I wanted, the opposite of what I was capable of doing. Instead they would take on the persona of that which could not be done; a constant reminder of the fresh scent of failure. That smell just lingers. It gets in your clothes, and it doesn’t leave. It gets in your nose and permeates your pores. It gets in your conscience and reminds you of what your quashed dreams were made of. Those mountains are a cruel mistress–one you never could reap pleasure from.
I remember the second time I saw those mountains. This was during a life reset. There would be many of those, but this was the first in the presence of the mountains. Reality reared its head and reminded me of what I do and do not like. Those mountains seemed all the more appealing the second go-round. Those mountains were kind of like the second try at a relationship: all those things you felt were not negotiable, well, the second time you’re more forgiving. But for how long? I’m not sure what I gleaned from my second glance at those mountains. I didn’t accomplish much in their presence. I wasn’t able to summit. I wasn’t even able to make basecamp. But this second look at those mountains seemed to be all the more welcoming. Maybe I had learned something since that first glimpse. Maybe when I turned my back on those mountains after that first foray I had grown. Maybe. But I hadn’t shown my ability to overcome them; to stake my flag. No, that second glimpse at those mountains just left me feeling unfulfilled and wanting more. I knew I would be back. I just had to prepare myself. There was no way I wouldn’t return and conquer those mountains. I just needed to prepare myself. I needed to gain wisdom and insight. I needed to mature. Those mountains would be there waiting for me. I just had to make sure I was ready.
I remember the third time I saw those mountains. I felt I had accomplished what was necessary to be competent and productive in their presence. I felt I then knew what it would take to climb to the top. I felt I knew that I could climb to the top over and over again. I felt that I would want to. I felt that nothing could stop me. But, it would seem, those mountains were smarter than me. Tougher than me. Those mountains had seen fools like me before. They would see fools like me again. They would not suffer fools. Those mountains would not give an inch. Time to reorient. Time to take stock. Challenges had been thrown at me by those mountains, and it would seem that any ground I gained was quickly taken back from the trajectory, altitude and elements. Those mountains were not interested in giving me anything. I would have to take it. But to do so I would have to prepare more. I was not refined enough. I was not smart enough. I was not capable enough. Others had what it took to face those mountains, others had what it took to reach the summit. I wanted to be like those others, ready to face those mountains.
I remember the fourth time I saw those mountains. This time I had grown wiser. I would no longer try to summit. I would just take shelter in their presence. I had grown smart enough to know that I was not a match for those mountains, but that I still appreciated them. They still represented much to me. But like a scorned lover, their very sight stung me with the failures of the past. Why I had I returned? Was I a glutton for punishment? Was I looking for more direction? More cruel reminders of the harshness of their elements? On this fourth trip to those mountains it slowly settled in that I would never match those mountains; my defeat was no longer in question–it was imminent. I would never conquer their peaks. Before I had vowed never to return–this is true, but time and again, I did. Those mountains were, to me, like the bright light to the mosquito. Calling me in, only to zap me of life. What were seen by so many as the essence of their being was, to me, the essence of my defeat. Those mountains, I vowed, would not beat me again.
There will not be a fifth time for me to see those mountains. It is not in me any longer. Those mountains are a cruel joke. An unattainable prize. Something not within my grasp. Had I never seen those mountains, would I be better off? Have those mountains corrupted my ability to tackle other great peaks (and feats)? Perhaps. An unattainable love. A heart broken, time, and time again. The saga ends with my admission of defeat to those mountains. What once was aspirational has now become just a nagging reminder of what could have been and never was–of time spent, and nothing gained (?). If something was gained then it was the bitter reminder that fools rush in where angels fear to tread. Those mountains will not remember me, but I will not forget them…
Marco Esquandoles
Don Quixote Impersonator
 A 30-cm color aerial imagery sample collected over Houston, Texas late September 2013.
 And now a 15-cm color aerial imagery sample collected over Pittsburgh, Pennsylvania on April 10, 2014.
For some projects, satellites cannot offer the resolution or cloud-free conditions demanded by your project. In these instances, the solution is our 15-centimeter (cm) and 30-cm aerial imagery. Delivered in color or with four multispectral bands, our new collections of aerial imagery are a reasonably-priced solution for your next geospatial project in the United States (and beyond).
Here are the key specifications of our new tasked aerial imagery offering:
- Spectral Bands: natural color, color infrared (i.e. green, red and near-infrared) or 4-band multispectral (i.e. blue, green, red and near-infrared)
- At Nadir Resolution: 15-cm or 30-cm
- Typical Delivery Time: 1 to 2 months
- Possible Coverage Area: continental United States (other geographies may be available with a custom quote)
- Horizontal Accuracy: ~3-m CE90 (dependent on terrain, can be improved with ground control points)
Our aerial imagery offering is ideal for customers requiring competitively priced, cloud-free data at resolutions not available from a satellite sensor.
If you would like more information on our new tasked aerial imagery services, you can reach us by phone at (303) 993-3863 or email. In the meantime, you can check out additional samples and product specifications on our website here.
- Moving on from our continued focus on solar technology, now it is time to go through my backlog of random but cool advancements I found over the past months–again in no particular order.
Could airplanes fly longer than possible now by using lasers based on the ground to charge batteries while in flight? This autonomous gadget-laden surfboard traveled across the Pacific Ocean collecting data on weather and wave action never known before. This technology can produce coveted hydrogen gas with lasers, charcoal and water. If you use a computer, you might like this new memory that is so large it can save all of your data in real time so it is (basically) never lost.
Is this the solution we need to reduce greenhouse gases by converting them to carbon monoxide based chemicals? Admittedly this is a bit scary but carbon nanotubes can be embedded in plants to improve the efficiency of photosynthesis; while these carbon nanotubes create cheap hydrogen gas. Hot vapor could be used to create organic materials that are hard to produce otherwise; and this technology could efficiently create steam directly from sunlight.
This is the first room-temperature laser; could this lead to the first magnetic refrigerator; or maybe super-high definition, flexible displays? A 40-times improvement in nanogenerator technology brings wearable (or implantable) self-powered gadgets closer to reality. And this idea might power implantable medical devices with a laser; while these wires both store and transmit power.
 The land and ocean monthly temperature departure map produced by NOAA for November 2015. You can see record warmth over much of Central America and then parts of South America and southeast Asia; with small pockets of cooler weather over western states in the USA and Greenland.
- The November 2015 NOAA global climate report confirms that we are seven for seven as it was the warmest November on record (marking the seventh month in a row we have set a monthly temperature record); and then the second warmest month ever in 136-years of record keeping. Most of the globe was either warmer or much warmer than average with record warmth in parts of southeast Asia and northeastern South America. It is hard to deny that something is happening here folks–and 97% of scientist agree humans are the main cause. Can you show me a topic where 97% of scientists agree yet we continue to ignore the problem as a nation?
- The great state of Georgia joined our fine union on January 2, 1788 and in honor of this date, my Google Search for the month was, “GIS and Georgia.” If you scroll through the multiple results you will find, you might stumble upon this thesis by Adam Schieffer of the University of South Florida where he uses GIS to examine settlement patterns along the Chattahoochee River. In Schieffer’s research, he merges multiple archeological databases coming up with 1,885 sites for his final analysis.
- From the Pacific Northwest and after two superb city GIS websites in a row, we come back to reality as we travel east to review Pennsylvania’s largest city’s resources, Philadelphia. And while Philly’s online resources are not the best we have seen, they are also not the worse. The GIS homepage leaves much to be desired but there are links to the two key resources any spatial data user could need: an online web map with a huge variety of layers to display and all the bells and whistles you might need; as well as a website with more than 300 shapefiles, KMZs and streaming layers to download and/or to connect with. The city GIS department even offers a direct email address to request specific datasets.
Brock Adam McCarty
Map Wizard
(720) 470-7988
brock@apollomapping.com
 A comparison of 30-m SRTM and 12-m WorldDEM elevation data over Arkansas, USA.
For three years, Airbus’ twin high-resolution radar satellites, TerraSar-X and TanDEM-X, imaged the entire land surface of our planet multiple times to create the first ever global 12-meter (m) elevation model. Referred to as WorldDEMTM, this data is ideal for all mapping projects requiring accurate elevation models including orthorectification, floodplain determination, mineral exploration and hydrocarbon development.
WorldDEM December 2015 Product Updates
Sales of the bare earth version of WorldDEM, referred to as WorldDEM DTM, have commenced. And in September, the price for 12-meter WorldDEM DTM dropped significantly to $21.60 per square kilometer. Any area that is ready to order can now be produced in all three WorldDEM formats–see below for technical details on these formats.
This is the first time this is happened but we are sad to say that in December, no new data was added to the WorldDEM database. However, to date, there is still more than 138,831,000 square kilometers (sq km) of WorldDEM data that is available!
 A coverage map of the one-degree cells that are currently available for delivery. Areas that are available will take a minimum of 10 days to deliver.
WorldDEM Specifications
The key product specifications of Airbus’ WorldDEM are as follows:
- Resolution: 12-m
- Coverage: entire landmass of the Earth, ~150 million square kilometers (sq km)
- Absolute Vertical Accuracy: < 4-m Linear Error 90% (LE90)
- Relative Vertical Accuracy: < 2-m LE90 (slopes ≤ 20%), < 4-m LE90 (slopes > 20%)
- Absolute Horizontal Accuracy: < 10-m Circular Error 90% (CE90)
- Vintage: all data collected within 3 years
- Source: interferometry from synthetic aperture radar (SAR) satellites TerraSAR-X & TanDEM-X
- Minimum Order: 500 sq km per polygon
- File Format: GeoTIFF
- Projection: geographic WGS84 (EGM2008, vertical datum), meter vertical unit
- Product Line Options:
- WorldDEMcore–unedited digital surface model (DSM), includes spikes, wells and voids
- WorldDEM–a DSM with removal of artifacts and water body flattening
- WorldDEM DTM–artifacts and surface features removed, i.e. a digital terrain model (DTM)
WorldDEM Coverage and Pricing
WorldDEM data has a 500 sq km minimum order size with a 10-km width requirement. Prices for two of the product lines have been set:
- WorldDEMcore–$10.80 per sq km
- WorldDEM–$13.50 per sq km
- WorldDEM DTM–$21.60 per sq km (that’s a 20% savings from the original list price!)
WorldDEM Samples
You can download four 12-m WorldDEM samples here, including one of the WorldDEM DTM product:
- Buraydah, Saudi Arabia–desert with agriculture present; elevations from 576 m to 737 m provided in two formats, WorldDEMcore and WorldDEM
- Mjosa Lake, Norway–hilly terrain with large water bodies; 100 m to 840 m provided in two formats, WorldDEMcore and WorldDEM
- Rapid City, South Dakota, USA–moderate to hilly terrain; elevations from 927 m to 1,765 m provided in two formats, WorldDEM and WorldDEM DTM
- Wagga Wagga, Australia–forest and urban with many water bodies; 137 m to 922 m provided in two formats, WorldDEMcore and WorldDEM
For more information about 12-m WorldDEM data, please send us an email at sales@apollomapping.com or check our website here.
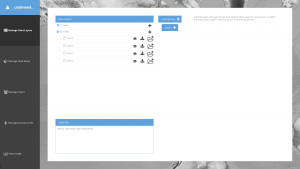
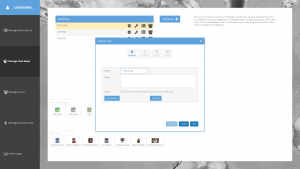
This month we made major strides forward with Map Mavin’s user interface. In fact, we made enough progress to feel comfortable sharing two screengrabs with you. Before you check these out, please keep in mind that these interfaces will still see significant overhauls, but we think they are still pretty cool as they are now!
The sneak preview of Map Mavin below shows you the first step of making a web maps which is loading your project’s spatial layers such as shapefiles, KMZs and TIFFs. This interface lets you group your spatial layers in folders, download them from the cloud and view their metadata.
The second screengrab from Map Mavin shows the interface for publishing web maps. Here you can set your web map’s name, offer it a description and make it public or private among many other options. We also plan on adding directions to each interface, making your user experience that much easier!
While we are busy building out the infrastructure and technology required to support the most flexible GIS cloud on the market, now is a great time to explain a bit about the Map Mavin.
Some of you may have used other GIS cloud services in the past, and in many ways the Map Mavin will be similar to these. But the Map Mavin will distinguish itself in a variety of important manners. Here is a list of the key features that will be unique to the Map Mavin:
- Near-instant set-up–unlike other GIS clouds, the Map Mavin will take less than five minutes to sign up for, load data on to and get started using. No other cloud comes close to that flexibility.
- Tons of free spatial data–included with every subscription is access to more than 4 terabytes (TB) of free vector and raster data covering the United States and many parts of the world.
- A marketplace for spatial data – all users will have access to a library of spatial data that can be added to your GIS cloud. Further, users will be able to post data they have created to the marketplace to sell to other users (or let them use for free if you wish).
- Cloud computing – we will ask all users for feedback on the spatial operations they perform most frequently and will then implement the most popular ones in the Map Mavin.
- Free entry-level subscriptions – users will be able to use the full-functionality of Map Mavin with a free 30-day demo or up to 5 megabytes of storage. And once you pass this storage limit or 30 days of usage, subscriptions will start at just $10.00 per month!
- A robust online viewer–for those users in your organization lacking access to a GIS application, the Map Mavin will feature an online viewer that can be accessed from anywhere in the world as long as users have internet access.
- Enhanced browsing speeds – we will have all of your spatial data cached in multiple locations around the world so access times will be greatly reduced for international users.
- Flexible streaming architecture – administrators will be able to setup multiple WMS and WFS feeds that can be shared with the appropriate teams of data users. Each feed can be seeded with the datasets these users need access to.
- Industry-leading data redundancy – with 99.999999999% data redundancy, you can be assured that your data will not be lost once placed on the Map Mavin.
Do you have any specific questions you would like answered about the Map Mavin? Or perhaps you want to join the beta program? If so, let us know by email at sales@apollomapping.com.
 (Images Courtesy: DigitalGlobe. Processed by Apollo Mapping for improved color accuracy and clarity.)
We love maps.
We love imagery.
We love work breaks.
We hope you like them as well!
It’s been a long day for you so we think it’s time to take a break. Before you head out for that break, take a few minutes to check out this 50-cm centimeter color WorldView-2 image collected of the 89th Macy’s Thanksgiving Day Parade on November 26, 2015 in New York City. The weather over NYC on the 26th was less than ideal for imagery as the skies were partly cloudy; and given that it is close to winter, the sun was low and so the shadows are deeper than we would like. All that said, this is still one cool image of the parade taken by Columbus Circle where the route turns to the east before heading south on 6th Avenue for its final stretch. In the WorldView-2 image, you can see hordes of parade watchers as well as three floats. Did we peak your interest about the Macy’s Thanksgiving Day Parade? If so, check out these fun facts about the parade!
Have a great rest of your workday! J
In this monthly feature, we span the globe to examine Our Changing Landscape with time series of medium resolution RapidEye satellite imagery. The RapidEye archive dates back to late 2008 and already contains more than 7 billion square kilometers of data. For January, our focus stays on controversial infrastructure development with a look at the Kemper County Energy Project in Mississippi.
The RapidEye Constellation
RapidEye is a constellation of five 5-meter medium resolution satellites each offering five spectral bands of information. The RapidEye constellation offers daily revisits to every location on the planet with a huge footprint that is 77-km wide. The data is priced competitively with a starting cost of $1.28 per square kilometer for all five spectral bands–academics do receive discounts. RapidEye adds a fifth band, the red edge, to the ‘traditional’ multispectral set of blue, green, red and near-infrared (NIR). The additional spectral data in the red edge band allows users to extract more useful land ‘information’ than can be from traditional 4-band imagery sources. When RapidEye imagery is ordered as a Level 3A Orthorectified product, images from multiple dates are extremely well registered, making it the ideal data source for Our Changing Landscape.
Kemper County Energy Project
 Click on the image above to see an animation of 5-meter natural color RapidEye imagery collected over the Kemper County Energy Project in rural Mississippi on July 2, 2009, April 2, 2011, October 25, 2013 and May 1, 2015. In the animation you can see the construction of the power plant expand from just open fields and forests to a large complex. The main construction area at the center of the image measures about 3,475 meters long by 1,625 meters wide–that is one big project! (Images Courtesy: BlackBridge)
As has been our approach introducing past controversial projects, the intent here is to report the facts as we see them without taking a stand for either side. With this in mind, first a bit about the Kemper County Energy Project (KCEP) in Kemper County, Mississippi. The 582-megawatt power plant utilizes integrated gasification combined cycle (IGCC) technology to convert local lignite (a lower quality coal product) to natural gas for use in energy production. Sometimes referred to as clean coal, the process is touted to remove up to 65% of the carbon dioxide released in traditional coal power plants. Mississippi Power initiated construction of the plant in 2010 and it is scheduled to be completed in 2016, some two years after the initial estimated completion date. Approximately 109,000 cubic yards of concrete, 40,000 tons of structural steel and 908,000 linear feet of piping have been used in the construction of the mega power plant.
In August 2014, the KCEP combined cycle unit went online and according to Mississippi Power, it produced about one-third of the state’s power in 2014. Mississippi Power also states that the power plant created 12,000 construction jobs, and then 1,000 permanent positions once completed, plus it saves costs on energy production and reduces our dependency on foreign oil.
The critics of the KCEP point to repeated construction delays (now at least totaling two years) and significant budget overruns in their analysis of the project. Originally scheduled for completion in 2014 with a budget of $1.8 billion, the plant is not expected for completion until at least 2016 with a total cost of $6.2 billion or more. Others question the entire concept of clean coal, as they point to safety issues and the overall costs of carbon sequestration and storage that technologies like IGCC require. Another argument levied against the KCEP are the negative environmental and cultural impacts of strip mining by which the local lignite used in the combined cycle unit is extracted.
Whatever your views on the mega power plant project might be, now it’s time to track the progress of KCEP’s construction with a time-series of 5-meter RapidEye imagery.
If you would like to find out more about using RapidEye for your academic studies, engineering projects or any landscape analysis, let us know at sales@apollomapping.com or (303) 993-3863.
In this monthly article, we provide details on updates to Airbus Defense and Space GEO’s SPOTMaps product. SPOTMaps is an orthorectified 2.5-meter (m) and now 1.5-m natural color imagery layer with coverage over more than 110 countries–totaling an impressive 135 million plus square kilometers (sq km). For projects requiring a value-priced basemap better than what 15-m Landsat can offer, there is no other choice than SPOTMaps.
SPOTMaps Product Updates–November 2015
To date, more than 32,833,000 sq km of SPOTMaps1.5 data have been released with some 1,578,000 sq km in the past months alone.

 1.5-meter SPOT 7 natural color images collected over Arrowhead Stadium and the surrounding town of Kansas City, Kansas, USA on September 6, 2015. If you would like to see this stadium in Pléiades 1 50-cm resolution as a comparison, please click here. These images have been processed by Apollo Mapping to improve their sharpness and color balance. © CNES 2015, Distribution Airbus Defense and Space / Spot Image S.A., France, all rights reserved
 This map of SPOTMaps1.5 coverage shows the regions that have been released or updated recently as well as those currently in production. An Apollo Mapping representative can provide more details on the specific year ranges used in each mosaic.
 This map of SPOTMaps2.5 coverage has been color coded to show the collection year which makes up the majority of each mosaic as well as those markets that were added in the final month of production (i.e. August 2013). An Apollo Mapping representative can provide more details on the specific year ranges used in each mosaic.
- These countries are currently in production for the first time and will be added to the SPOTMaps1.5 database soon:
- Afghanistan
- Algeria (part of the country)
- Central African Republic
- Sudan (part of the country)
- These countries are currently being updated from SPOTMap1.5 Version 1 to Version 2:
- Iran
- Iraq
- Saudi Arabia
- Production of SPOTMaps2.5 is complete now that SPOTMaps1.5 are being released.
For those who have never worked with SPOTMaps, below is a summary of key product specifications of the 1.5-m and 2.5-m versions as well as product differentiators.
Key Product Specifications
Here is a summary of the key product specifications of SPOTMaps1.5 and SPOTMaps2.5:
- SPOTMaps1.5
- Resolution: 1.5-m
- Spectral Bands: true natural color (RGB)
- Horizontal Accuracy: 6 to 10-m CE90 (circular error 90%)
- Projection/Datum: UTM WGS84
- Source Data: SPOT6/7 satellite imagery
- File Format: GeoTIFF
- SPOTMaps2.5
- Resolution: 2.5-m
- Spectral Bands: simulated natural color (RGB)
- Horizontal Accuracy: 10 to 15-m RMSE (root mean square error)
- Projection/Datum: UTM WGS84
- Source Data: SPOT5 satellite imagery
- File Format: GeoTIFF
Product Differentiators
These are the product specifications that set apart SPOTMaps from its competition:
- Recent and ready for immediate delivery and integration with your GIS
- Seamless, orthorectified coverage across countries and entire regions in 1.5-m and 2.5-m resolution
- Suitable for work up to 1:10,000 scale
- Custom product framing with minimum orders of ~100 sq km
- Product series is updated nearly every month
- Source data can be delivered with all SPOTMaps mosaics
- Volume and academic discounts are offered
- Multi-user licenses are available
If you would like pricing details and/or additional product details, such as date ranges and accuracy specifications, please let us know at sales@apollomapping.com or (303) 993-3863.