
In September, we looked at Pyongyang’s Mirae Scientists Street in North Korea. This month for the Pléiades 1–Pléiades Neo Point of Interest, we check out Ayodhya, India, where the largest annual celebration of Diwali is held. This year, the event will be on October 20, 2025.
About the Point of Interest: Diwali, also known as the Festival of Lights, holds great significance in Hindu culture. It symbolizes the triumph of light over dark, and good over evil. The festival typically lasts five days and involves various traditions and celebrations. The largest Diwali celebration held in India relies upon thousands of volunteers who set out clay oil lamps along the banks of the Saryu River, in Ayodhya.
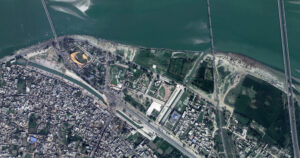
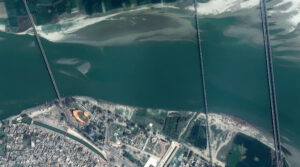 These two satellite images show where lanterns are placed along the Saryu River in Ayodhya, India during the Diwali, or Festival of Lights. The Pléiades 1B 50-cm color image from February 23, 2022, shows the richly hued waters. In the second photo, a Pléiades Neo 4 30-cm image captured March 13, 2022, we can see even more details of the happenings below, including boats floating on the river. These images have custom processing and color balancing applied by Apollo Mapping. PLEIADES © CNES 2025, Distribution Airbus DS.
Fun Factoids: (1) The city of Ayodhya set a new Guinness World Record during its Diwali celebrations on October 30, 2024 as volunteers lit 2.51 million clay oil lamps along the banks of the Saryu River. This display surpassed the previous year’s record of 2.2 million lamps. (2) During the festival, the celebrants illuminate their homes, temples and workspaces with diyas (oil lamps), candles and lanterns. Hindus, in particular, have a ritual oil bath at dawn on each day of the festival. (3) Diwali is also marked with fireworks as well as the decoration of floors with rangoli designs and other parts of the house with jhalars. Food is a major focus with families partaking in feasts and sharing mithai. (4) Some Hindus associate the festival with Goddess Lakshmi, the goddess of wealth and prosperity, and wife of Vishnu. According to Pintchman, the start of the 5-day Diwali festival is stated in some popular contemporary sources as the day goddess Lakshmi was born from Samudra Manthana, the churning of the cosmic ocean of milk by the Devas (gods) and the Asuras (demons)–a Vedic legend that is also found in several Puranas such as the Padma Purana; while the night of Diwali is when Lakshmi chose and wed Vishnu. (5) For others, the holiday symbolizes the return of Prince Rama of Ayodhya to his wife, Sita, and brother, Lakshman, from a 14-year-long exile and a war where Prince Rama stood victorious. The people of Ayodhya lit lamps along the way to light his path in the darkness.
The 50-cm Pléiades 1 High-Resolution Satellite Constellation
The Pléiades 1 constellation (or at least part of it!) has been in orbit since December 2011 and if you have not had a chance to check out any sample imagery, take a few moments and have a look at the gallery on our website. If you work with high-resolution imagery, you should consider Pléiades 1 and Pléiades Neo for your next geospatial projects.
A variety of Pléiades 1 products are available from both a well-established archive and as a new collection, including 50-centimeter (cm) pansharpened imagery and 50-cm panchromatic–2-meter (m) 4-band multispectral bundles. We are happy to discuss the technical specifications, pricing and tasking options available with both of these satellite constellations.
The 30-cm Pléiades Neo High-Resolution Satellite Constellation
Pléiades Neo is our newest high-resolution satellite constellation. The first Neo satellite went up in April 2021 and the second in August of the same year. This 30-centimeter resolution constellation will add two more satellites in the next few months and upgrade from daily to intraday revisits. Pléiades Neo has six multispectral bands with 1.2-meter resolution, including a deep blue and two infrared bands, along with a 30-centimeter resolution panchromatic band.
The archive is growing every day, and the satellites are available for new collections, making Pléiades Neo the perfect solution for site monitoring. Check out our beautiful sample images in the Pléiades Neo gallery.
More sample images and technical information about Pléiades 1 can be found on our website here; while the same can be found here for the Pléiades Neo constellation.
The Apollo Mapping sales team can answer any questions you might have about Pléiades 1 and/or Pléiades Neo. We can be reached at (303) 993-3863 or sales@apollomapping.com.
¡Bienvenidos a octubre! Nosotros en Apollo Mapping estamos gustosos de tenerlos otro mes aquí en los resúmenes españoles del mes de octubre.
Colecciones de Imágenes de Alta Resolución–WorldView-2/3–Medio Oriente, Marzo a Mayo 2025
 Este mapa muestra las áreas capturadas por la constelación WorldView-2/3 del 1 de marzo al 31 de mayo de 2025 sobre el Medio Oriente. Ten en cuenta que, en muchos casos, se recolectaron múltiples imágenes sobre la misma área, lo que es difícil de representar en este mapa estático.
En esta publicación mensual, damos a nuestros lectores una idea de la cobertura de imágenes de alta resolución recopilada sobre una geografía durante un período de tiempo específico. Para hacerlo, seleccionamos una constelación de satélites de alta resolución, un período de tiempo definido y un área de interés, luego informamos estadísticas clave sobre la cantidad total de imágenes recopiladas en kilómetros cuadrados (km²). Sin más demora, pasemos a nuestro análisis.
Región Gráfica de Interés: Medio Oriente
Superficie Terrestre Cubierta: 6,674,329.3 km²
Período de Tiempo: del 1 de marzo al 31 de mayo de 2025
Constelación de Satélites de Alta Resolución: WorldView-2/3
Estadísticas de Imágenes de la Constelación WorldView-2/3–Medio Oriente
Área Total Recolectada: 2,367,187.5 km²; 12,865.1 km² por satélite/día
Área recolectada con 20% o menos de nubosidad y 30 grados o menos de ángulo off-nadir: 1,717,954.2 km²; 9,336.7 km² por satélite/día; 72.57% del total
PRODUCTO DESTACADO–La Constelación WorldView Legion de 30 cm y 8 bandas
¿Trabajas en planificación urbana, monitoreo ambiental o gestión de recursos, y necesitas identificar usos del suelo, rastrear cambios en áreas urbanas, evaluar la salud forestal o planificar proyectos de desarrollo? Si es así, la imágenes de alta resolución con su gran concentración de píxeles para mayor detalle permiten un análisis preciso y la medición de elementos no visibles en imágenes de menor resolución, facilitando la cartografía exacta, reduciendo la necesidad de visitas de campo y generando documentación detallada de nuestro mundo real.
 Imagen de 30 cm de WorldView Legion cortesía de Maxar, capturada sobre el campus de NEOM en Arabia Saudita el 2 de diciembre de 2024. Apollo Mapping aplicó balance de color personalizado y mejoras de imagen.
Desde su lanzamiento en 2024, WorldView Legion de 30 cm y 8 bandas se ha consolidado como una de las constelaciones de satélites de 30 cm más prolíficas en el sector de la teledetección de alta resolución. Con seis satélites actualmente en órbita, la constelación WorldView Legion captura aproximadamente 3.2 millones de km² de imágenes de 30 cm de alta resolución al día, que se añaden casi instantáneamente a Cazador de Imágenes. Además, su avanzado sensor multiespectral capta datos en ocho longitudes de onda diferentes, ofreciendo perspectivas excepcionalmente detalladas de la superficie terrestre y facilitando la identificación de objetos pequeños y la detección de cambios ambientales sutiles tanto en entornos urbanos como naturales. Aplicaciones avanzadas como batimetría, evaluación de vegetación, exploración mineral y monitoreo de incendios forestales son usos comunes de la constelación WorldView Legion.
Dado que el 90% de la población mundial reside entre los 45° Norte y 45° Sur, la constelación está optimizada para intervalos de revisión más rápidos en estas regiones, mientras mantiene cobertura en latitudes más altas gracias a dos satélites en órbitas helio sincrónicas. Cuatro satélites WorldView Legion orbitan en órbitas medias persistentes (MIO), lo que permite una revisión de hasta 15 veces al día en regiones seleccionadas. Esta capacidad incrementada de cobertura y revisión en las áreas más pobladas del mundo genera un archivo robusto y capacidades avanzadas de monitoreo en regiones cruciales. La frecuencia de revisión respalda una cartografía integral, detección de cambios sólida y análisis en profundidad sobre extensas áreas geográficas. Estas capacidades permiten que la WorldView Legion de 30 cm apoye una amplia gama de aplicaciones geoespaciales, incluidos proyectos que requieren análisis espectral y un nivel de detalle intenso.
Con seis satélites activos en órbita, la constelación WorldView Legion se destaca por:
- Imágenes pancromáticas de 30 cm y multiespectrales de 1.2 m en 8 bandas (costera, azul, verde, amarilla, roja, borde rojo 1, borde rojo 2, NIR).
- Cuatro satélites en órbita media (MIO) concentrados en las áreas más pobladas del planeta.
- Captura de más de 500,000 km² diarios por satélite.
- Accesos promedio de tres veces al día a ubicaciones entre 40° Norte y Sur.
- Captura de imágenes durante todo el día, no solo por las mañanas, gracias a los satélites MIO.
La constelación WorldView Legion de 30 cm permite a Apollo Mapping ofrecer una mayor capacidad de imágenes en alta resolución y tiempos de entrega más rápidos a clientes de diversos sectores, incluyendo defensa, minería, petróleo y gas, ingeniería, educación e investigación, y ayuda humanitaria.
Puedes explorar nuestro archivo completo de imágenes satelitales hoy en Cazador de Imágenes.
Para ver cómo las imágenes de 30 cm y 8 bandas de WorldView Legion pueden apoyar tu próximo proyecto, o para obtener recomendaciones personalizadas, contacta a nuestro equipo de ventas en sales@apollomapping.com ahora.
Producto Destacado–WorldDEM Neo de 5 metros DSM + DTM
Si tu próximo proyecto de mapeo requiere cobertura de gran área con un modelo digital de elevación (DEM) sin interrupciones, entonces es momento de revisar el producto actualizado WorldDEM de Airbus, que ahora cuenta con nuevos precios y mayor precisión. WorldDEM Neo tiene una resolución mejorada de 5 metros y se deriva de pares estereoscópicos de radar TerraSAR-X y TanDEM-X. Sin embargo, los pares de radar utilizados para crear este conjunto de datos de elevación de 5 m son más recientes que su predecesor, ya que fueron recolectados entre 2017 y 2021. WorldDEM Neo está disponible tanto como modelo digital de superficie (DSM) como modelo digital de terreno (DTM), con una impresionante precisión vertical absoluta de < 1.4 m de Error Lineal 90% (LE90).
 Muestra de datos DSM de WorldDEM Neo de 5 metros en Phu Hoi, Vietnam.
El WorldDEM Neo DTM de 5 metros está disponible como producto de Nivel 1 o Nivel 2. El producto de Nivel 1 es un DTM automatizado que elimina estructuras de superficie del WorldDEM Neo DSM. El producto de Nivel 2 incluye procesamiento manual, lo que resulta en un DTM de mayor calidad. Esto incluye la eliminación de estructuras de superficie como áreas urbanizadas y vegetación alta. También incorpora el refinamiento de bordes de cobertura terrestre antes de reducir la elevación al nivel del terreno y la preservación de líneas de cresta y cañones con el modelado preciso de estructuras de transporte como puentes, autopistas y terraplenes. Finalmente, detalla las extensiones de características hidrográficas como cuerpos de agua, embalses, ríos y la alineación respectiva de alturas de superficies de agua.
Puedes buscar WorldDEM Neo ahora en Cazador de Imágenes y luego descargar una muestra de DSM, así como datos de DTM de Nivel 1 y Nivel 2 del mismo lugar aquí.
Para obtener la lista de precios actualizada de DEM, que incluye datos DSM y DTM de 5 m de WorldDEM Neo, envía un correo a sales@apollomapping.com.
Mientras tanto, revisa estas especificaciones clave del WorldDEM Neo de 5 m:
- Resolución: espaciado de píxel de 5 metros
- Precisión vertical absoluta: < 1.4 m Error Lineal 90% (LE90)
- Precisión horizontal absoluta: < 6 metros (90% de error circular)
- Cobertura geográfica: casi de polo a polo, igual que WorldDEM de 12 m
Fernando Gutierrez
Topographic Translator
- Are all my nerds out there ready for this month’s batch of cool techie ideas?! Even if not, here we go!
New combined three-layer material advances green hydrogen production.
This artificial skin can be injected to heal burn scars and other severe wounds.
Some good news for chocolate lovers!
This crystal breathes oxygen.
Advanced, low-power AI microchips could be possible due to this research.
Low-cost iron catalyst could revolutionize hydrogen fuel cells.
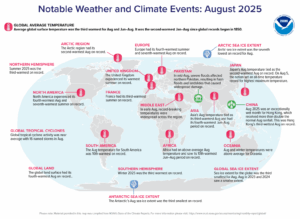 The Arctic region has its second warmest August on record while the Arctic Sea ice extent was the seventh lowest on record for August. North American experienced its fourth warmest August and seventh warmest summer on record. United Kingdom recorded its warmest summer on record. In mid-August, severe floods affected northern Pakistan, causing flash floods and landslides that lead to widespread damage. Japan’s August temperature tied as the second warmest August on record and on Aug. 5, it set an all-time maximum temperature record. August 2025 awas an exceptionally wet month for Hong Kong, which received more than double the normal August rainfall. Winter 2025 was the third warmest record on record for the southern hemisphere. The Antarctic’s August Sea ice extent was the third smallest on record. (Image Credit: NOAA Global Climate Report)
- The NOAA Global Climate Change Report for October 2025 has been released by the National Centers for Environmental Information and reveals further proof that global global climate change remains a concern. August 2025 was the third warmest August globally since records began in 1850. The monthly temperature anomaly was +1.07°C (+1.93°F), ranking just below the warmest Augusts of 2023 and 2024 (+1.27°C / +2.29°F). August 2025 marks the 47th consecutive August with global temperatures at least nominally above average. The 10 warmest Augusts have all occurred since 2015. The global ocean-only surface temperature for August 2025 was also the third highest on record for August, with a temperature 0.91°C (1.64°F) higher than the 20th Century average. Only Augusts of 2023 and 2024 were warmer. The global land-only surface temperature was 1.41°C (2.54°F) higher than the average and ranked as the fourth highest for August in the 176-year record. In August, temperatures were above average across much of the globe’s surface, particularly over most ocean areas and parts of every continent. The most significant warm temperature departures were observed in the Northern Hemisphere’s northern latitudes, as well as central Antarctica. Record-high August temperatures covered 6.3% of the world’s surface. A record cold August temperature was observed in a small area of the southern Pacific Ocean, encompassing less than 1.0% of the Earth’s surface. Looking at regional temperatures, the Arctic had a near-record warm August with a temperature 1.93°C (3.47°F) higher than average. Only August of 2023 was warmer. The Caribbean region and Asia experienced their third warmest August, while North America recorded its fourth warmest. Europe saw its seventh warmest August, while South America had its 10th warmest. Oceania and the Antarctic region were warmer-than-average, however, their temperatures did not rank in the top 10 warmest Augusts.
- Fall means crisp leaves, apple cider and apple pie, hayrack rides, bonfires, s’mores, and pumpkin flavored everything. It also means October is almost here and so is Halloween. GIS has played an important role with the Halloween holiday. GIS can analyze place names to find locations with “frightful” words like “dead” or “ghost” and map them globally or locally for trick-or-treating. GIS can determine the most efficient trick-or-treating routes in a neighborhood or town by analyzing factors like candy distributors per block, route efficiency, and housing density. GIS can be used to create interactive maps and digital experiences, such as online hunts for Halloween-themed decor or “treat maps” showing where candy is being given out. There’s already an online collection of spooky stories and monster maps and all the fan favorite Halloween horror classics since the dawn of time can be found on Esri’s Geography of Horror map, which guides you through the locations of the top-rated horror movies. From Tokyo to Los Angeles, your favorite kill-count kings (or queens) are mapped. Esri’s Halloween Cemetery Map allows people to tour cemeteries of some of the most famous actors, writers, musicians, and authors to exist. Unearth celebrity burial sites including John Wilkes Booth, Bonnie and Clyde, James Dean, John Lennon, William Shakespeare, and Frank Sinatra. Originally titled “You Can Run, You Can Hide: The Epidemiology and Statistical Mechanics of Zombies,” these scientific and mathematical principles were quickly developed into an interactive map by Matt Bierbaum where visitors simply select their hometown, or any point of origin, and watch the zombie virus spread across the United States in real time, just in time for Halloween.
Brock Adam McCarty
Map Wizard
(720) 470-7988
brock@apollomapping.com

We love maps.
We love imagery.
We love work breaks.
We hope you like them as well!
Grab a pint or a pumpkin spice latte and settle in for a tale this spooky season about Oktoberfest in Munich, an event that happens to be the world’s largest celebration of Bavarian culture. Each year, millions of visitors travel the world to celebrate Oktoberfest. The festival is held at Theresienwiese, where it has taken place since the fairgrounds opened in 1810. The 2024 festival featured a few new changes as well as many tried and true traditions.
In 2025, the 190th Oktoberfest will take place from September 20 to October 5. The beer price for Oktoberfest 2025 is between 14.50 Euros and 15.80 Euros, an average of 3.52% more than in the previous year. Last year, the price range was between 13.60 Euros and 15.30 Euros. For those who attend Oktoberfest in Munich, there are parades, live music, special foods, a wreath-laying ceremony and more.
For this month’s Imagery Work Break, we feature a color, 30-centimeter WorldView-3 image collected over Oktoberfest 2024 in Munich on September 25th. In this image, you can see the colorful tent from above, along with the people who love celebrating the event. And if you want to compare this colorful WorldView-3 data to imagery collected in the past, we have featured Oktoberfest in Munich many times as you can see in the link here!
Have a great rest of your workday! 😊
(Image Courtesy: Maxar. Processed by Apollo Mapping for improved color accuracy and clarity.)
In this monthly article, we travel the world to check out unique, fun and sometimes a bit weird 30-centimeter (cm) color imagery samples from the WorldView constellation. In September, we looked at skyscrapers in New York City. For this edition of the 30-cm Color WorldView Image of the Month, we feature images of Absheron National Park in Azerbaijan.
30-cm WorldView-3 (WV3) launched in late 2014, WorldView-4 (WV4) launched in late 2016 and then the first WorldView Legion satellites launched in 2024. Taken together, this is the most advanced satellite constellation the commercial marketplace has ever had access to. Here are a few of the features that really set these satellites apart from the competition:

 Absheron National Park was established in February 2005 on the base of Absheron State Nature Preserve, which was created in July 1969 in order to protect gazelles, Caspian seals and water birds that inhabit the territory. In dry areas, gazelles, jackals, foxes, rabbits and badgers roam, while in the waters of the Caspian you can find seals, various fish, and birds such as silver gull, wheezing swan, grey and red-headed black, white-eyed black ducks, big white bittern, sandpiper, bald-coot, marsh belibagli, sea bozcha and other migrant birds. More than 50 species of birds can be found here, making it a haven for birdwatchers. Visitors can spot gulls, terns, ducks, waders and various raptors, many of which migrate along the Caspian coastline. The short-eared owl, a nesting species, is a highlight during autumn. Absheron National Park is also home to several snake species, adding to the park’s reptilian diversity. The park also boasts 25 species of plants that contribute to the unique ecosystem found within its borders. Historically, Caspian Seals would visit the park’s shores between May and August, providing a rare opportunity to observe these small and endangered seals. In the images below, we can see the national park, the Caspian coastline and the complex spatial patterns of each. This 30-cm WorldView Legion image was collected June 2, 2025, and has custom processing and color balance applied by Apollo Mapping. (Satellite Imagery © 2025 Maxar Technologies)
- Improved Resolution
- Higher resolution means you can see more detail in WorldView imagery.
- Data collected at nadir will have 31-centimeter (cm) panchromatic, 1.24-meter (m) visible and near infrared, 3.7-m SWIR (WV3 only) and 30-m CAVIS (WV3 only) bands.
- Additional Spectral Bands
- If spectral analysis is part of your project, then no other satellite can match WorldView-3 and WorldView Legion with their 8 bands of visible and near-infrared data; and then 8 shortwave infrared bands (WV3 only) which are crucial for geological studies.
- Better Positional Accuracy
- With accuracies of 3.5-m CE90% or better (without ground control even!), the 30-cm WorldView constellation has no rivals for its enhanced positional accuracy.
- Daily Revisits
- With multiple WorldView-3 and WorldView Legion satellites orbiting our planet, daily revisits are available for most locations.
- WV4 is no longer collecting new imagery.
- Increased Collection Capacity
- WV3/4 feature 13.1-km swath widths (at nadir) with the ability to collect up to 680,000 square kilometers (sq km) of high-resolution data per day per satellite (though WV4 is dead now).
- When fully launched, WorldView Legion will feature six 30-cm satellites, significantly boosting the collection capacity of this leading high-resolution constellation.
If you are interested in WorldView-3, WorldView-4 and/or WorldView Legion imagery for your next project, please let us know by phone, 303-993-3863, or by email, sales@apollomapping.com.
You can also find more WV3 samples and technical information on our website here; WV4 samples and information can be found here; and then finally here is more information about WorldView Legion.
I can’t recall the first time I heard about how wasteful the public sector is, and those claims have only ramped up under the new administration as evinced by their campaign to eradicate public services, agencies, and personnel from the payroll and to the detriment of the public good. Though, I worked for several years in the public sector and can speak to a degree of wastefulness and taking advantage of “the system.” We would often pad our timesheets, take longer than was necessary to do jobs–and with more people than necessary on those jobs. But we always got the needed work done, and we also responded to tasks as they popped up. Yeah, we may have dragged our feet a little and taken too long of lunches, but we didn’t slack when it came to the quality of the work or our understanding of what needed to be done to get the job done right. Interestingly, we often collaborated with private enterprise as well, and I can tell you from firsthand experience there also that they’re no better than the public sector–especially when they’re getting paid by public money. So, it would seem everyone tries to fleece the people. That’s not a defense, just an acknowledgement of the reality. But I’d actually argue the private sector is worse.
A couple columns ago I mentioned my little vehicular mishap and the early stages of trying to determine whether I’d be able to salvage my car or have to get a new one. As I write this, four weeks to the day of the accident and my submission of the claim, having gotten no direct help from my insurance company (business 1; B1) as they’d passed me off to a third party to handle the process (business 2; B2) who eventually had to work with a fourth party (business 3; B3) to get the final estimate, I’m left flustered. The representative from B2 has been amazing and done everything within her power to communicate and move things along. With B1 having effectively wiped their hands of the problem–that is, until it’s time to pay the settlement–the ball is in B3’s court, as that’s who is supposed to make the final determination. Keep in mind I’d already gotten an estimate from a collision repair place effectively totaling the car (damages exceeding 75% of its value)–all B3 had to do was go onsite and put their eyes on it to confirm that was the case. They delayed, or more accurately, simply didn’t act for about 10 days until upper management at B2 intervened and contacted upper management at B3. Twenty-four days later, an adjuster finally went onsite, and four days later (28 total) they still haven’t submitted that report. B1 fumbled along the way numerous times also, assigning and then unassigning people who never bothered to reach out and then just turning it over to B2 who is contractually obligated to work with B3.
I’ve since bought a new car, as the limit on my rental reimbursement was going to run out at 30 days and you can’t just demand a car you want and have it be available. I lost one after putting down a (refundable) deposit because of the delay–the dealer wouldn’t hold it for more than a week, understandably. This caused me to have to buy another car out-of-state for logistics purposes and that cost me almost an extra two grand. As I write, I don’t have my settlement check. As I scroll through the emails and texts from B3, they’re totally unprofessional and lacking any sense of concern or responsibility on their end, with tons of shorthand and misspelled words (basically how a teenager might text), and the names of their “representatives” are comical–one is named Taj Mahal Ijiran, and the other is Ester Austria. I had to ask the only reliable person in this whole chain of events, from B2, if this was a scam; she said she’d heard that concern before but that it is not. She voiced that she was “angry” and “frustrated” by how long this has taken, and I responded that that makes two of us.
 Almost everyone involved in my insurance claim left me hanging and in limbo for far too long. They got their money and they’re not trying to give any out. (Image retrieved from here and comes courtesy of Pixabay)
Now, these are private companies not sucking off the teat of the public, but off of individuals who are reliant on good customer service when it counts and the compensation due us from the insurance policies we hold and pay for. I never once heard from my actual insurance agent (B1) besides two short emails saying his hands were tied and there was nothing he could do to move things along. The collision estimate company was timely and efficient. And as a representative of her company (B2), the third-party conduit has been great. But I don’t know why all these external companies need to be brought into the mix. The ball really got dropped when B3 showed up in the picture. I learned long ago that the more you farm out the less control you have over the final product. That has been the case here by far.
Of course, while I’m griping about all this, I have to go back to the root of the problem that jumpstarted all this frustration–the accident. While I was trying to avoid one, I’m not the first to point out, or the first to accept, had I been going a little slower, perhaps my response time would’ve been better, and I could’ve escaped with my old car and no headaches. But the milk has been spilled, and here we are…
Two of my worst qualities by far are my impatience and stubbornness, and I’m sure those are on full display during this whole ordeal. That the accident occurred on the very first day of my work/pleasure travels looms over me as an ominous sign. Other things have not gone as planned since then, most notably the whole lady-friend thing (see last month’s column), but certainly whether I need to be out here for as long as I’ll be and what I’ve committed to (i.e., already paid for). I’ve had problems in the past with biting off more than I can chew, and this may play out to be one of those cases–it certainly looks to be that way a month in. It’s also a case, perhaps, of not really knowing what I want or what I’m looking for, and I know that sounds ambiguous, but I either can’t or don’t want to articulate it in greater depth at the moment (maybe next month). For the time being, my ire is aimed at the failures of B1 and B3 to do their job efficiently. The ire directed at yours truly can wait–for now…
I am admittedly easily frustrated by businesses and companies that don’t do their jobs well or quickly. In my day-to-day interactions with people in places of commerce (e.g., restaurants, grocery stores, etc.), I often find my blood boiling a little more quickly than I’d like or is sometimes, frankly, appropriate. I need to slow down. I need to accept that the world doesn’t operate on my schedule, and rarely will anything ever go “my way.” This is one of those times. Perhaps this test of patience will be good for me. Perhaps I’ll learn to slow down. Perhaps I’ll learn to go with the flow. But if history is any indication, all of that is unlikely, and I’ll continue to be disappointed in private businesses and people broadly. So it goes…
Postscript: One month after the claim was filed, I accepted a settlement after some negotiation, though it was less than I thought was fair based on some upgrades I’d done to the car that weren’t covered under my insurance, even though I’d let my insurance agent know I was doing them–another failure by B1. I’d considered arbitration but didn’t want to drag out any longer and didn’t know if I’d be successful anyway, and it would cost me extra to pay a lawyer, so I just cut my losses–and kept my loss of faith in private industry…
Marco Esquandoles
Unserved Customer
Building and growth is exponential where I live. Our fast-growing small town is the gateway to a summer destination creating a heavy seasonal population influx. Many of our restaurants are located on the south side of downtown to lure vacationers. When we see another construction site emerge, we wonder, “What’s being built there?” A friend of mine contends that there should be informational flyers provided by each site so concerned and curious citizens can be informed. The latest addition under construction is a burger joint. I thought, “What?! Not another burger place!”
Within a 5.5-mile stretch on one road, there are 18 burger restaurants. I was hoping for a little more diversity in food restaurant options for our expanding community of 28,000 people. How many hamburgers does a city need? That thought calls into question several factors: population, average income, need for fast or familiar food options, and more. So, what does the research say and how did we get here… I wonder.
There’s some debate on where the hamburger originated with documented ties to Germany, Connecticut, and St. Louis. We know that it’s become a solidly American staple. George Motz, a burger expert, shared in a CNN article that German migrants’ frikadellen dish came with them in the mid-1800s. It became a sandwich which earned a place in history as classic American fare found in homes and restaurants across the globe. The favorite treat is so popular that according to All About Burger more than 50 billion burgers are consumed annually in the USA. Yes, BILLION! They say that equates to about 3 burgers per week per person. While I’m not holding up that static at our house, there’s certainly ample opportunity in my community.
 Image created in Canva by Barbaree Duke.
Being a data and planet minded group of folks, you’re asking some questions in your minds. How many cows does that require? What about the condiments? What about the effects on the planet? Let’s tackle those questions one at a time. A cow can yield around 500 pounds of de-boned, trimmed meat, which can be ground into approximately 2,000 quarter-pound (4 oz) burgers. If we can trust those statistics, that’s 25 million cows. Do we have enough cows? According to the U.S. Department of Agriculture (USDA) data in its National Agricultural Statistics Service (NASS) reports from July 2025, they reported 94.2 million head of cattle and calves on U.S. farms, with 28.7 million beef cows and 9.45 million milk cows plus those being raised for future production. Interesting! Add to those yummy burgers the 11 million bottles of ketchup and 8 million gallons of mustard, and we’re making our way to some staggering, yet tasty statistics.
Now, how does that affect the planet? Where do we start? Each cow needs 1-2 acres of land. In an interesting PBS video from 2012, there’s compelling research about the gaseous issues with all those cows…methane gas to be exact. (Fun fact: I read recently about imagery being collected that sees methane!) We haven’t touched on the acres of wheat, lettuce, cucumbers, onions, tomatoes, and more that we need to garnish our delectable treat. We’ve fallen down the rabbit hole and are still faced with many beautifully crafted beef sandwiches on menus everywhere that say, “Eat me!”
What can you do? Eating less of them is the simple answer. In a University of Michigan 2018 study on Beyond Burger, they found that producing plant-based burgers used 99% less water, 93% less land, and 90% fewer greenhouse gas emissions. It’s something to consider for sure!
If you need me, I’ll be contemplating my life choices, lamenting that they put the calorie counts on the restaurant menus, and perhaps considering a veggie burger.
Barbaree Duke
Geospatial Crusader
If your next mapping project requires large-area coverage of a seamless digital elevation model (DEM), then it is time to check out Airbus’ updated WorldDEM product, boasting new pricing and improved accuracy! WorldDEM Neo has improved 5-m resolution and is derived from TerraSAR-X and TanDEM-X radar stereo pairs. However, the radar pairs used to create this 5-m elevation dataset are more recent than its predecessor as they were collected from 2017 to 2021. WorldDEM Neo is available as both a digital surface model (DSM) and a digital terrain model (DTM) with an impressive absolute vertical accuracy of < 1.4 m Linear Error 90% (LE90)!
Check out a sample of WorldDEM Neo 5-meter DSM data from Phu Hoi, Vietnam.The 5-meter WorldDEM Neo DTM is available as a Level 1 or Level 2 product. The Level 1 product is an automated DTM and removes surface structures from the WorldDEM Neo DSM. The Level 2 product features manual processing resulting in a higher-quality DTM. This includes the removal of surface structures from the WorldDEM Neo DSM such as built-up areas and tall vegetation. It also incorporates the refinement of land cover borders before reducing the elevation to the terrain level and extending the preservation of ridge lines and canyons with the precise modelling of transport structure like bridges, motorways, embankments; and then detailing the extents of hydrographic features like water bodies, reservoirs, rivers, and respective alignment of water surface heights.
You can search for WorldDEM Neo now on Image Hunter; and then download a sample of DSM, Level 1 and Level 2 DTM data from the same location here.
To get updated DEM price list which includes 5-m WorldDEM Neo DSM and DTM data, send an email to sales@apollomapping.com.
In the meantime, check out these key specifications for 5-m WorldDEM Neo:
- Resolution: 5-meter pixel spacing
- Absolute Vertical Accuracy: < 1.4 m Linear Error 90% (LE90)
- Absolute Horizontal Accuracy: < 6-meter (90% circular error)
- Geographic Coverage: nearly pole to pole, same as 12-m WorldDEM