
Hello and welcome back to Map Mavin Methods, our ongoing tutorial and troublehooting series that details the many exciting features and capabilities of our newly released GIS cloud service. In this month’s episode we’re happy to reveal a new file format support–KMZ’s! While we already had given users the ability to upload and download Google Earth KML files, we realize that many users use the zipped versions of KMLs, called KMZs, and moved quickly to add this capacity to our system. The best part? Our latest release includes support for multi-part KMLs and KMZs, meaning many features can be uploaded at once and automatically organized into a project folder.
In this lesson I’ll take you through the uploading process using one of these multi-part files and show you how to best take advantage of this new KMZ support in our GIS service. So let’s get started! Note: if you’ve already read our August 2016 post, “Uploading Files to Map Mavin” then you’ve already encountered most of this information already.
First login to Map Mavin as an admin or sub-admin. For uploading files, select the “My Data Layers & Folders” tab.
Opening this tab will bring you to a screen with several options, including a list of data layers that have already been uploaded (“My Data Layers”) and general information about a given layer (“Details”). To upload a new layer, simply click on the “Upload Layer” button in the top left of the white window. KMLs and KMZs will work just the same as our other formats, with the notable exception that KMLs and KMZs cannot be stylized as uploaded shapefiles can.
Choose a name for the new spatial layer you wish to create and then select the file you would like to upload by clicking the “Browse” button.
After selecting the file, Map Mavin will automatically load its contents onto the platform. Once staged for upload, a brief summary of the components within the zipped file will appear below, with green check marks indicating that each part can be successfully imported. Now click the “Upload” button.
Once the desired file has been uploaded, return to the left side of the screen and select “My Data Layers”. You will now see the uploaded data displayed in the “My Data Layers and Folders” list. From here you can choose to use this layer in one of your web maps, or simply store the file for future use. And great news! With multipart KML/KMZs, Map Mavin automatically organizes them into folders. Click the folder to see the individual parts (points/lines/polygons) drop down. From here you can choose to use some or all of the layers by dragging and dropping them into your next web map project.
And there you have it! Just like with all of our supported formats, uploading KML/KMZs, whether it’s a single point or hundreds of building footprints, takes only minutes!
If you have more questions about uploading KML/KMZs, other formats that Map Mavin supports or general inquiries, please reach out to:
Fletcher Berryman
Cloud Tamer
(970) 710-0909
fletcher@apollomapping.com
Do you have an area of interest that requires regularly updated imagery but you do not have time to check daily for this data?
Or perhaps you have a remote location that needs updated imagery but you cannot afford a new collection?

If either of these questions ring true, then you need to check our new Data Alert service on Image Hunter!
Data Alert lets you define an area of interest anywhere around the globe, the resolution your project requires and the number of months we should keep the alert active. Once this is set up, we check for new data over your area of interest every single day, and send you an email alert when we find coverage that meets your specifications.
We have a short YouTube video with directions to set up a Data Alert, check out the second video. We also have written directions for Data Alert here.
It’s that easy to find the data you need for all of your key projects.
If you would like to check out Data Alert, send us an email at sales@apollomapping.com or visit Image Hunter and click on the bell icon in the header to get started using this great service!
“Thank you” and “Sorry” are overused and overvalued, and often meaningless or misconstrued. Think about a child who receives a gift and you tell them, as their parent, that they should say, “Thank you.” Do we really think the child means it? Or are they just doing as they’re told? When a child does something bad, and we tell them to say they’re sorry, do we really think they are? I’ve interacted with enough people, young and old, to know that when people say they’re sorry, they’re often not. They’re just saying that to get out of the situation. I mean, I’ve certainly done this countless times. I don’t want to deal with you and your nonsense, “I’m sorry.” Trespass forgiven. Give me a horrible gift, do something for me that I didn’t want done or could have done myself without all the grief, “Thank you.” These snippet phrases that are imbued with such meaning are largely meaningless. Societal customs need to be revamped and revisited. Especially in this day and age of “communication” via social media, these assertions are void of heartfelt expression, at least to me. It’s kind of like saying, “Bless you” or “Gesundheit” when someone sneezes–why do we do that? What does it even mean? Are we just so in need of having to hear ourselves, or feel as if we’re compassionate soles that we must respond to everything? Does every bodily noise elicit a response? What is appropriate for gas? Yawns? Hiccups?
“Sorry” to me is weird in other contexts, too. For instance, when someone dies, why is it our practice to say, “I’m sorry for your loss”? Yes, we should be empathetic humans and have concern for other’s wellbeing, but just why, tell me, are we sorry? Sorry implies fault. We’re not at fault (usually) when someone else dies. It’s just so odd. One time I heard a co-worker say in response to the passing of someone, “I hate hearing that.” That seems more accurate and appropriate. I don’t want to hear about bad things happening to good people, so of course I would hate hearing the news. But I wouldn’t be sorry. I’d be sorry if I clogged your toilet or burned down your house. But in those situations, that phrase might not be enough. But somehow it is for a death. Strange…
Thinking back on all the sweaters and socks I got as gifts as a child, and all the thank you’s I had to administer as a result of those gifts, why couldn’t I have said what I really wanted to say? “What? Socks for a 10-year old boy? Are you crazy? Why would socks be a good gift? If you took that $10 you spent on socks and just given it to me so I could buy exactly what I wanted, you wouldn’t look like an idiot, I would have truly appreciated the gift, and we could be on our way. But no, you thought socks would be a good choice for a child. I’m sorry you’re such an idiot, because had you not been, I’d have some baseball cards now.” Ah, wouldn’t that have been nice to tell Aunt Winona?
 Dogs do it with their eyes. We don’t know how to communicate it.
This reminds me of a comic strip I once saw. It went like this (Pearls Before Swine by Stephan Pastis): Mouse: “I’m gonna start apologizing to all the people I’ve insulted by telling them, ‘I’m sorry you were offended.’” Pig: “Is that a real apology?” Mouse: “No. That’s what’s so great. It allows me to retain the impact of the original insult while tacking on the implied bonus insult of, ‘You are an oversensitive ninny.’” Pig: “But that’s kinda rude cause it’s sorta saying the guy is too dumb to realize that.” Mouse: “I’m sorry that you were offended.” Pig: “Apology accepted.” For me, people are too sensitive, yet at the same time we’re a vapid species that buys into banal customs that are void of any real meaning. Maybe we should stop saying please, thank you and sorry, and get to what we really mean, which is of course different in every single situation. So how can one phrase be considered a catch-all?
When I really want to thank someone, I don’t feel it comes through adequately in that phrase. It comes through in my actions. When I have aggrieved someone, I don’t feel that a sorry will do. An action must follow. So really what these empty phrases serve as are vessels of ease. We want the easy way out, and the times when we most shouldn’t take them, we’ve crafted a culturally accepted and expected way to do so, and then we train our children to make things right by doing very little other than uttering a short and trite response. It is sad that a phrase exists at all that expresses sincere gratitude or deep concern for another’s wellbeing. In fact, that a phrase exists at all suggests we, as a society, do not know how to convey these feelings. Maybe we should work on that. But where do we go?
I’m not an overly emotionally expressive guy, so when you do touch my heartstrings, I usually will follow it up with a letter or note. The two words in “I’m sorry” or “thank you” pale in comparison to a missive directed to the other party; this is something we’ve lost in the age of social media and the web. It takes time to write a note. It allows you to think your way through the issue, put it all out there, making sure no stone is left unturned. It also lasts forever, if you want it to. When we say “thank you” or I’m sorry,” those phrases are ephemeral; they vanish into thin air. But a heartfelt note lingers on into the ages, and does a much better job expressing what we feel. It allows us to go out behind a publically presented and protected persona, and to let out a little of that gushy humanity that we all are often oblivious to. Sorry’s and thank you’s can then mean something because we’ve invested in the dissemination of something bigger than two words that equate to a hall pass or get out of jail free card.
Don’t tell me thank you or that you’re sorry, even if you think you are. I’ve heard it all before. I’ve said it too many times to count. Either don’t respond to my gift or your transgression and go on with your life, or do something that matters, that shows you actually considered what you did–or what I did, and invest in the relationship by putting what you really mean on to paper. Yes, words are great in their spoken form, but we take shortcuts all throughout our life (emoji’s anyone?), and unfortunately this is common practice in verbal dialog. Unless you can convey what you really mean–and really should say in person, then don’t just try to “get it over with.” Find another route, write it down. Just as we don’t understand how to express these supposedly heartfelt statements accurately, sometimes we don’t want to even hear them in the first place. A note or letter allows the receiving party the opportunity to take in your thoughts in their due time, and to hold on to them for as long as they’d like.
Marco Esquandoles
Apologist
- Oh technology, how do I love thee! It’s time again for my favorite snippet of the month, so without delay here we go with our technology review!
Biofuel: This new genetically-engineered algal strain produces up to twice the amount of biofuel as in the past; and this low-cost catalyst made from sand speeds up algal production of biofuels. Here is research to extract catalysts for biofuel production from used aluminum foil.Solar: A South Korean solar company is set to build the world’s largest floating (and rotating) solar farm; while an Australian company is planning on printing combined solar panels and solid-state storage batteries. This new solar panel design captures energy from nearly the entire light spectrum; and this design uses bismuth to create a non-toxic panel. And how about this 16-year old kid who convinced a city to require solar panels on all new homes–nice work Delaney!
Random: This self-contained filter works like a jungle to purify water. Heavy metals are hard to clean up when spilled into the environment but this genetically-engineered yeast can absorb up to 80% of these contaminants. This nanomaterial could be the solution to storing renewable energy at a low-cost. Removing carbon dioxide from the air could help mitigate the impacts of Climate Change and this enzyme could supercharge carbon sequestration by up to 500 times.
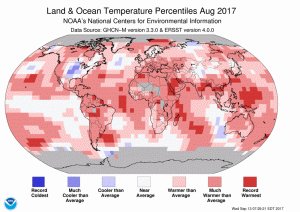 The August 2017 temperature departure map shows pockets of record warmth across all continents other than Australia with a marked pocket of cool weather over the central USA and northern Russia.
- The August 2017 NOAA global climate report is out it confirms that this past August was the 3rd warmest on record behind 2016 and 2015 only. It was also the 41st consecutive August above the 20th Century temperature average and the 392nd consecutive month above the same average. But you know, climate change is not real, and in Florida if you are a government official you are not even allowed to use the words, climate change; wonder how they will chat about Hurricane Irma then?
-
- October is here so that means Halloween is just around the corner, and in honor of this “important” holiday, my Google search of the month was, “GIS and witch.” If you look through the results, you might find this interactive paper/GIS created by Benjamin Ray of the University of Virginia of the 1692 Salem witch trials. And while it does not look like the work was ever finished, there is a good handling of common issues GIS, such as mis-registration and digitization.
- Last month we were in Dover, Delaware with a review of their online GIS resources and this month we move to Miami, Florida’s second largest city, with a review of their GIS resources. And while the Miami-Dade County GIS website is quite robust, the City of Miami’s GIS site leaves much to the imagination. On this simple, single-page website, there is no contact information but there is a link to robust webmap which is fast, features a variety of layers and lets users query easily. There is no apparent way to download the layers behind the webmap.
Brock Adam McCarty
Map Wizard
(720) 470-7988
brock@apollomapping.com

 1.5-meter SPOT 6 natural color images collected over EverBank Field and the surrounding town of Jacksonville, Florida, USA on February 9, 2017. If you would like to see this stadium in Pléiades 1 50-cm resolution as a comparison, please click here. © CNES 2017, Distribution Airbus Defense and Space / Spot Image S.A., France, all rights reserved
In this monthly article, we provide details on updates to Airbus Defense and Space GEO’s SPOTMaps product. SPOTMaps is an orthorectified 2.5-meter (m) and now 1.5-m natural color imagery layer with coverage over more than 110 countries–totaling an impressive (and growing) 160 million plus square kilometers (sq km). For projects requiring a value-priced basemap better than what 15-m Landsat can offer, there is no other choice than SPOTMaps.
SPOTMaps Product Updates–October 2017
To date, more than 50,452,000 sq km of SPOTMaps1.5 data have been released–however no new data has been released for the past three months.
- These countries (or parts of them) are currently in production and will be added to the SPOTMaps1.5 database soon, or will be updated versions of basemaps that are already available:
- Sweden
- Production of SPOTMaps2.5 is complete now that SPOTMaps1.5 are being released.
For those who have never worked with SPOTMaps, below is a summary of key product specifications of the 1.5-m and 2.5-m versions as well as product differentiators.
Key Product Specifications
Here is a summary of the key product specifications of SPOTMaps1.2 and SPOTMaps2.5:
- SPOTMaps1.5
- Resolution: 1.5-m
- Spectral Bands: true natural color (RGB)
- Horizontal Accuracy: 6 to 10-m CE90 (circular error 90%)
- Projection/Datum: UTM WGS84
- Source Data: SPOT6/7 satellite imagery
- File Format: GeoTIFF
 This map of SPOTMaps1.5 coverage shows the regions that have been released or updated recently as well as those currently in production. An Apollo Mapping representative can provide more details on the specific year ranges used in each mosaic.
- SPOTMaps2.5
- Resolution: 2.5-m
- Spectral Bands: simulated natural color (RGB)
- Horizontal Accuracy: 10 to 15-m RMSE (root mean square error)
- Projection/Datum: UTM WGS84
- Source Data: SPOT5 satellite imagery
- File Format: GeoTIFF
- More than 108 million sq km of SPOTMaps2.5 were produced!
Product Differentiators
 This map of SPOTMaps2.5 coverage has been color coded to show the collection year which makes up the majority of each mosaic as well as those markets that were added in the final month of production (i.e. August 2013). An Apollo Mapping representative can provide more details on the specific year ranges used in each mosaic.
These are the product specifications that set apart SPOTMaps from its competition:
- Recent and ready for immediate delivery and integration with your GIS
- Seamless, orthorectified coverage across countries and entire regions in 1.5-m and 2.5-m resolution
- Suitable for work up to 1:10,000 scale
- Custom product framing with minimum orders of ~100 sq km
- Product series is updated nearly every month
- Source data can be delivered with all SPOTMaps mosaics
- Volume and academic discounts are offered
- Multi-user licenses are available
If you would like pricing details and/or additional product details, such as date ranges and accuracy specifications, please let us know at sales@apollomapping.com or (303) 993-3863.
Are you in need of stereo satellite imagery but hate having to look through a plethora of hard-to-use search engines in the process? Do you wish you could also search for stereo coverage after already looking at mono imagery results for a given area, without having to leave the search engine you have open?
If these issues sound familiar or you just need a wider array of archived stereo data, then ZY-3 stereo imagery is the solution for you!
 A 3.5-m panchromatic ZY-3 image collected over Death Valley, California, USA on March 25, 2016. This image has been processed by Apollo Mapping for improved clarity and sharpness. (Image sample courtesy Space View, copyright 2017)
Apollo Mapping is excited to announce the addition of ZiYuan-3 stereo results to our already diverse collection of satellite imagery options in our online search engine, Image Hunter. ZY-3 stereo is an ideal solution for you as it has both large footprints and extensive archive dating back to 2012 with near global coverage. ZY-3 provides 3.5-meter (m) panchromatic optical stereo pairs–as well as 2.1-m panchromatic and 5.8-m multispectral mono imagery.
As an added bonus, we also offer reasonably priced 7-m digital elevation models (DEM) extracted from ZY-3 stereo pairs. Our ZY-3 DEMs are available as both digital surface models (DSM) where surface features such as vegetation and human structures remain visible; and as digital terrain models (DTM) where the surface features found in a DSM have been removed so that elevations represent the bare earth below.
If you would like to find out more about ZY-3 stereo, you can check out our website here; or if you have a specific request for a project you are working on, let us know at sales@apollomapping.com and we would be happy to locate coverage and price out the data.
Key ZY-3 Specifications At-a-Glance:
- Launch Date: January 9, 2012
- Mono Sensor Resolution:1-m panchromatic & 5.8-m multispectral (blue, green, red and near-infrared [NIR]), at-nadir
- Stereo Sensor Resolution:5-m panchromatic
- Stereo Footprint Size: 52 kilometers
In this monthly feature, we span the globe to examine Our Changing Landscape with time series of medium resolution RapidEye satellite imagery. The RapidEye archive dates back to late 2008 and already contains more than 13 billion square kilometers of data. In August, we checked out the reemergence of an Irish island, and September, after a few months out of the country, we head back to North Korea with a look at an industrial city, Hamhung.
 Click on the image above to see an animation of 5-meter natural color RapidEye imagery collected over Hamhung, North Korea on August 9, 2009 and August 26, 2017. In these two images spaced about 8 years apart, you will see that not much has changed. From what we could see, the easiest way to spot the new buildings are the colored roofs–many of them either red or blue. Do you see some significant changes we missed? (Images Courtesy: Planet @ 2017)
The RapidEye Constellation
RapidEye is a constellation of five 5-meter medium resolution satellites each offering five spectral bands of information. The RapidEye constellation offers daily revisits to every location on the planet with a huge footprint that is 77-km wide. The data is priced competitively with a starting cost of $1.28 per square kilometer for all five spectral bands–academics do receive discounts. RapidEye adds a fifth band, the red edge, to the ‘traditional’ multispectral set of blue, green, red and near-infrared (NIR). The additional spectral data in the red edge band allows users to extract more useful land ‘information’ than can be from traditional 4-band imagery sources. When RapidEye imagery is ordered as a Level 3A Orthorectified product, images from multiple dates are extremely well registered, making it the ideal data source for Our Changing Landscape.
Hamhung, North Korea
Hamhung is a large North Korean city situated in the central part of the nation along its eastern shore on the Sea of Japan. By most accounts, Hamhung has a population in the mid-600,000s to the mid-700,000s and is the second largest in the shrouded communist nation. Once a local administrative and commercial hub of the Korean Chosŏn dynasty, the city suffered significant damage during the Korean War and was rebuilt largely by Communist partners around the world (for a more detailed handling of the history of the city, check this resource). Today, Hamhung is the capital of the South Hamgyŏng do province and is one of North Korea’s industrial powerhouses with a focus on textiles and shipping.
As with most facts and news about North Korea, details about Hamhung are hard to find. It does appear that Hamhung has a storied past of human atrocities including a concentration camp, mass graves surrounding the cities from famine, and a chemical weapon factory. According to a report by the US Korea Institute, there has been no growth in Hamhung’s markets from 2008 to 2013; but the city is still an active industrial region for the nation according to this Christian Science Monitor report, albeit stuck in a time gone by. Apparently opened for tourism in 2010, Hamhung has been touted by the North Korean government as a beach resort, however these visitors from the Daily Mail would disagree. Tourists headed to Hamhung might be interested to hear that an unexploded bomb was found on the outskirts of the town in late July. Here is a YouTube video of the streets of Hamhung–the lack of cars says a lot about the economic conditions in North Korea. Now, it is time to turn to the 5-meter RapidEye archive to see how Hamhung has (or has not) changed since 2009.
If you would like to find out more about using RapidEye for your academic studies, engineering projects or any landscape analysis, let us know at sales@apollomapping.com or (303) 993-3863.
 (Image Courtesy: DigitalGlobe. Processed by Apollo Mapping for improved color accuracy and clarity.)
We love maps.
We love imagery.
We love work breaks.
We hope you like them as well!
Fall is in full affect and perhaps the leaves are mostly down by you–either way, take a few minutes out of your work day and get outside for a breath of fresh air. But before you head out, check out this 2017 image edition of a music festival we visited last year, the Isle of Wight. Held during mid-June in the perennially cloudy United Kingdom, we were lucky enough to get an image this year when the festival was in full swing–how cool! This about 67-centimeter high off-nadir image was collected by WorldView-2 over the Isle of Wight on June 10, 2017.
Have a great rest of your workday!