
-
- Our first technology review of the year, sweet! Let’s jump right in
Biofuel & Solar: This ruthenium-based catalyst might be the key to converting biomass to plastic. Researchers discovered that random holes in solar cells can increase their efficiency by studying black butterfly wings; while this fractal-based concentrator could increase solar efficiency by 20%.Random: Here is a new rice variety that can grow in diluted saltwater which opens up marginal lands for agriculture. Discarded plastic bottles make concrete stronger; while discarded cigarette butts could power our next-generation fuel cells. This living wallpaper has a gorgeous green stripe made of cyanobacteria that also produces power from the Sun. And finally, forget about nuclear fusion, that’s old school, now it’s all about quark fusion that can yield up to 10 times the energy!
- Our first technology review of the year, sweet! Let’s jump right in
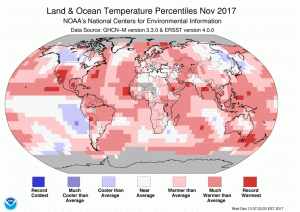 The November 2017 temperature departure map shows warm conditions across the world’s land masses with some cooler temperatures across western Canada and eastern Asia.
- The November NOAA Global Climate report confirms that warm temperatures dominate the globe with a large pocket of record warmth over the southwest of the USA. November 2017 was the fifth warmest November on record and the 395th consecutive month over the 20th Century temperature average. Eventually the world will do something to solve this global crisis even if the United States decides not to do its part at the federal level.
- The Emancipation Proclamation became law on January 1, 1863 and to commemorate this event, my Google search of the month was, “GIS and Emancipation Proclamation.” If you go through the various results, you might find this highly interactive and informative web map about the end of slavery put together by a team supervised by Scott Nesbit of University of Richmond. This map lets you understand the visual patterns of slavery as well as the collapse of the Confederate forces–excellent work on this project!
- Last month we hoped to find a GIS page for Hawaii’s second largest city, Pearl City, but we failed; and this month we try again with Idaho’s second largest city, Nampa. And while it is not a great website, at least they have one that can be found here. In general, the GIS website is little more than a collection of PDFs that can be accessed at the bottom of the page–with a few more on the assessor site here. Maybe we will have better luck with robust GIS websites when we head back into large states!
Brock Adam McCarty
Map Wizard
(720) 470-7988
brock@apollomapping.com
Launched in late 2016, Map Mavin is our pay-as-you go GIS cloud that lets users make unlimited public and password-protected web maps. Once you upload your vector and raster files to our secure Amazon cloud, you are ready to make and share your web maps in minutes–just like this demo web map we made with vectors and a base layer TIFF from Boulder, Colorado.

And with our Screen Share function, you can link up with users all around the world to collaborate on a map in real-time. Picture a live webex in your mind but just based around a map that moves and changes as the members of your team update information. Imagine the possibilities of working in real-time with a team of collaborators around the world without any GIS knowledge required!
Priced at just $20 per month with a free trial month, there is no other cloud-based GIS on the market that can compete with Map Mavin on price. For your $20 per month, you are able to store and/or download up to 5 gigabytes (5GB); and once you go over 5GB in a month, it costs you just 75-cents per GB from there! As an added bonus, you can cancel your monthly contract at any time.
January 2018 Product Updates
In the past few months, we released Map Mavin updates that included but were not limited to the following list of fixes, additions and enhancements:
- The file format KMZ is now supported for uploads.
- Added the ability to drag and drop (or reorder) layers in webmaps.
- Improved webmap loading times and fixed a bug that caused colored tiles to load before data did.
- Added a new OSM baselayer with more geographic detail.
- Improved billing stability and warning emails (still in progress now).
Stay tuned to this series where we will let you know about the Map Mavin changes that were released in the past month.
If you have an improvement or feature addition you would like to add the Map Mavin product road map, let us know by email at support@mapmavin.com.
Are you interested in trying out Map Mavin? If so, you can sign up here. Or maybe you would like a live demo of the product before you sign up? If so, send us an email at support@mapmavin.com and we will get one scheduled right away!
In this monthly feature, we span the globe to examine Our Changing Landscape with a time series of medium resolution RapidEye satellite imagery. The RapidEye archive dates back to late 2008 and already contains more than 13 billion square kilometers of data. In December, we checked out the construction of an impressive Chinese sports complex, and for this first Our Changing Landscape of the year, we stay in Asia to observe the changing falls colors in Bukhansan (or Bukhan Mountain) National Park, South Korea.
The RapidEye Constellation
 Click on the image above to see an animation of 5-meter natural color RapidEye imagery collected over Bukhansan National Park on September 14, October 15, October 19, October 25 and November 15, 2017. In this series of five images, you will see the steady progression of green summer colors to red-orange fall colors and then to brown senescence. Given the short time frame where fall colors are changing, we had to pick a few images that were less than ideal, please excuse the clouds! (Images Courtesy: Planet @ 2018)
RapidEye is a constellation of five 5-meter medium resolution satellites each offering five spectral bands of information. The RapidEye constellation offers daily revisits to every location on the planet with a huge footprint that is 77-km wide. The data is priced competitively with a starting cost of $1.28 per square kilometer for all five spectral bands–academics do receive discounts. RapidEye adds a fifth band, the red edge, to the ‘traditional’ multispectral set of blue, green, red and near-infrared (NIR). The additional spectral data in the red edge band allows users to extract more useful land ‘information’ than can be from traditional 4-band imagery sources. When RapidEye imagery is ordered as a Level 3A Orthorectified product, images from multiple dates are extremely well registered, making it the ideal data source for Our Changing Landscape.
Fall Colors in Bukhansan National Park
Located in the northwest of South Korea, Bukhansan National Park was designated in 1983 as Korea’s 15th national park. The park covers about 31 square miles (80 square kilometers) to the north and west of Seoul, Korea’s largest city–Bukhansan actually means, “mountain north of the Han River,” which is the northern border of Seoul. Bukhansan National Park is divided into two sections with Bukhansan Mountain to the south, Dobongsan Mountain to the north straddling Uiryeong Pass roughly in the middle. Surrounded by major cities, Bukhansan is the world’s most visited park by unit area according to the Guinness Book of World Records, with some 5 million visitors each year.
Bukhansan National Park is an ecological treasure as it is home to more than 1,300 species of flora and fauna. Many of the trees in the park are deciduous making it a prime destination for viewing fall leaf colors; in fact, it has been called one of the best locations in the world to view the vibrant oranges, reds and yellows of fall foliage. According to a Korean tourism site, peak colors in Bukhansan National Park during 2017 were predicted to occur from October 15th to October 29th, and lucky for us, there were a plethora of nice 5-meter RapidEye images to see just how the colors of summer changed in the fall, reached peak and then faded away.
If you would like to find out more about using RapidEye for your academic studies, engineering projects or any landscape analysis, let us know at sales@apollomapping.com or (303) 993-3863.
Recently, a neural network contributed to the discovery of the first star with eight known planets, like our own solar system. NASA teamed up with Google to troll through data collected by the Kepler Space Telescope since 2009. Google engineers created a neural network designed to analyze the historic data, looking for planetary transits.
Researchers used previous data showing confirmed exoplanet signals to train the system. As a planet crosses between its star and the sensor, the sensor records a dip in brightness. Most of the previous discoveries were done manually or with the help of algorithms. Armed with this information, the neural network looked for patterns in these datasets. Researchers gave the network 670 weaker signals from Kepler and found two likely candidates, Kepler-90i and Kepler-80g. Kepler-90i was found in the Kepler-90 system, making it the eighth known exoplanet in that system.
While Kepler-90 may have the same number of planets, there are many differences. The planet furthest from the star orbits at a similar distance as Earth does to the Sun. All the other planets orbit much closer and are relatively small.
There is a wealth of information kept in archives from past missions, more than can ever be deciphered manually. Machine learning opens new doors and windows into previously collected data, seeing patterns that were undetectable to the human eye. The researchers carrying out the study plan on expanding their study to include the full dataset of 150,000 stars.
In other transit news, Thomas Jacobs, a citizen scientist, was the first to discover a comet orbiting a distant star. Instead of just seeing the dip in brightness a comet tail was detectable, blocking slightly more light than usual. In this case, the human eye was more capable of detecting the faint differences than an algorithm
I have lived in all four of the time zones in the contiguous United States. I have opinions on which ones are good and bad (surprise, surprise), and what should be done about it. I believe the origin of time zones had something to do with train schedules way back when. I refuse to fact-check this because I am always right, so you should just take this as gospel. All the tiny Podunk towns couldn’t get on the same page so industry had to whip them in line. Of course, when it is 6pm on the East Coast, default dinner time for civilized folks, it would be afternoon snack time on the West Coast. To those who controlled the decisions, this simply wouldn’t do. So some genius came along and figured they’d make time zones off of Greenwich Mean Time at the Royal Observatory in the UK. That way everyone could eat dinner at the civilized hour of 6pm, when it would just be getting dark in the early fall and late spring, roughly. Everyone hoped to live in harmony, the end. But what we have is a whole bunch of headaches.
My first gripe on the subject came when I moved from CST to MST to PST and it had to do with television; sports, mostly. On the West Coast you have to be up and ready to go to watch a college football game on a Saturday at 9am, whereas on the East Coast it starts at a reasonable time, noon. But don’t place all of the sad faces on the left coast’s sidelines; the East Coast late games can start as late as 10pm. That’s ridiculous. That means you might not be getting to bed until 2am the next day! This means the west is wrapping up a day of sports much earlier, still leaving time to go out, drink beers and raise hell.
And what about if you live in L.A. and have a friend in NYC? You’ll never be on the same page when it comes time to talk on the phone and catch up. Time zones probably ruin some otherwise great friendships. Of the four, though, EST is the worst. We get dark first, our shows are the latest, and probably a bunch of other silly reasons I don’t care to mention because I forgot them right now anyhow. MST gets overlooked on TV advertising. It’s always, “9pm EST, 8pm CST, 6pm PST.” Why do they not mention MST? It might have the best state in the country (Colorado), and some close seconds (Western WY, Western MT, Northern ID and Northern UT; the other parts of those states, not so much…). Don’t get me wrong, the Pacific NW is awesome, and way better than anywhere in the CST time zone, and frankly the EST time zone, too. I think my point is: why do we need all these zones, really? What if it were 6pm at the same time across the nation? So what if you ate dinner in the broad daylight on the West Coast and it was dark when you got up? I’m sure they’d invent some new seasonal affective disorder, maybe call it “dark morning disorder” or something, but it’d be worth it to have us all on the same page.
And what about daylight savings time? When I was a young buck there were two contiguous states that didn’t cooperate: Indiana was on CST in the fall and EST in the spring (or vice versa, who cares). Now they’re always EST, though they’re not eastern. Arizona was PST in the spring and MST in the fall. I think they’re just PST now, but again, who cares. This topic is only partially related to my initial gripe: the lack of necessity for time zones. What if all around the world people were on the same time, regardless of place? If it were 6pm in L.A., NYC, London, Jerusalem, Baghdad, Beijing, Pyongyang, Auckland and Peoria, Illinois (the armpit), then it would make traveling a lot easier. Jetlag sucks, and while you’d still get it on international jaunts, at least you wouldn’t get double-whammied.
Now, I’m sure some of you nerds out there will explain this scientifically and rationally, about why these time zones are great and necessary. But frankly, I won’t change my opinion. I’m through with being bothered by inane ideas like this; I think we need to focus on bigger things. We can only do that if we’re all on the same page. Side note: I heard that Clemson University made some stupid PC law about punctuality in the classroom, something along the lines of time being “fluid” to certain people or some nonsense. Give me a break. Why does everybody make excuses all the time? Why does every little thing have to have shades of gray? Some things just are, and some things just aren’t. Time zones are just pointless. They further obfuscate and make communication more difficult, just like this dumb rule from Clemson. Seriously…
Now back to our regularly scheduled gripe: I’ve had several jobs in the past where I had to get up before the sun came up, and I hated it. Getting up at 5:30am to do what I needed to do in order to get to work on time at 7am was just no fun. True, I blamed some of the early morning hatred on it being dark out, a problem that would become an issue for many more people if we were all on the same time. But the solution is simple: don’t get a job that starts at 7am. Now that I don’t have to be up that early, I don’t have (get) to complain about the darkness. But the reality is that it never really had anything to do with darkness; I was never complaining about it being dark at 9pm, was I?
So it’s settled: we’ll all set our clocks to midnight tonight at midnight MST (because I have decided that represents the best area of the country), and we’ll struggle through the growing pains. Grin and bear it. And from now on in the late fall, winter and early spring, it will be dark early for a lot of us. It will also be light late for a lot of us. We’ll figure it out. Trust me. We’re not that smartest species, but we can adjust to anything. It is one of the strengths of being groomed by the television and consumer culture: we’ll eat what you feed us, wear what you tell us is cool, throw away what is still good, and repeat the cycle every 5-10 years or so.
Marco Esquandoles
Time Keeper.
 (Image Courtesy: DigitalGlobe. Processed by Apollo Mapping for improved color accuracy and clarity.)
We love maps.
We love imagery.
We love work breaks.
We hope you like them as well!
Christmas is right around the corner, are there any fun lights to check out by your office? If so, go check them out when it’s dark, if not, still go take a break sometime soon! Either way, before you take that break, check out this 30-centimeter WorldView-3 image collected on December 19, 2016 over the site of the National Christmas Tree planted in Washington. The current National Tree, a Colorado Spruce, was planted in 2012 to replace the 2011 version which died of transplant shock. Each year, the President of the United States lights the National Tree, with the 2016 event marking the 94th lighting. First started in 1923 by President Calvin Coolidge, this year’s event takes place on November 30, 2017 in President’s Park South, also referred to as the Ellipse.
Have a great rest of your workday!
DigitalGlobe’s Advanced Elevation Series (AES) is a suite of elevation products that are reasonably priced with global coverage. By utilizing existing archive coverage and their constellation of 50-cm WorldView satellites, DigitalGlobe is able to offer an industry first: global elevation data delivered in reasonable time frames at competitive market prices.
There are three basic product offerings within the AES: Mapping, Precision and Very High Precision elevation data. The three products are differentiated by their resolution and accuracy–this information is summarized in the table below. For each of the products, DigitalGlobe offers both a Digital Surface Model (DSM) which includes human-made and natural features (such as trees, bushes and buildings); and a Digital Terrain Model (DTM) with these features removed. Other important specifications include:
- Minimum Order Size
- 100 square kilometers
- Geographic Coverage
- Global
- Price lifts do exist for some Asian countries
- Cloud Cover
- 5% or less
- Cloudy pixels in final product are identified with an Esri polygon shapefile
A Summary Table of Key AES Product Specifications
| Resolution | Absolute Vertical Accuracy (LE90%) | Relative Vertical Accuracy (LE90%) | Absolute Horizontal Accuracy (CE90%) | Relative Horizontal Accuracy (CE90%) | Ground Control (GCPs) Required? | Formats Available | |
| Mapping | 8 m | 8 m | 5 m | 10 m | 8 m | No | DSM / DTM |
| Precision | 4 m | 4 m | 2 m | 5 m | 4 m | Yes* | DSM / DTM |
| Very High Precision | 2 m | 2 m | 1 m | 2 m | 3 m | Yes* | DSM / DTM |
* Horizontal and vertical accuracies stated here assume GCP accuracy of 50-cm CE90%/LE90% accuracy or better.
 An animated comparison of 2-meter Very High Precision DigitalGlobe elevation models created over Dunedin, New Zealand; the first image is a DSM and the second is a DTM. (Data Source: DigitalGlobe)
Below is a comparison of two Very High Precision products created over Dunedin, New Zealand: one is a DSM and the other a DTM. DSMs are commonly used in line of sight and watershed analysis as they include human and natural features; while DTMs are commonly used in orthorectification where a ‘true’ model of Earth’s surface is crucial for improved horizontal accuracy. In this animation, we start with the DSM and then transition to the DTM, using the same color ramp with low elevations in red and higher elevations in green.
With pricing to meet different budget requirements and global coverage, DigitalGlobe’s AES elevation suite is the ideal solution for:
- Regional studies which require an analysis of elevation.
- Academics in need of a reasonably-priced solution to replace dated and low resolution public sources.
- Engineers looking to replace costly field labor in distant lands.
- More accurate orthorectification, particularly in areas of high topographic change.
If you would like more information about the global AES offering by DigitalGlobe, you can send requests to sales@apollomappping.com or call us at (720) 720-7988.
You can also find out more about the technical specifications of AES products on our website here.
Do you have an area of interest that requires regularly updated imagery but you do not have time to check daily for this data?
Or perhaps you have a remote location that needs updated imagery but you cannot afford a new collection?

If either of these questions ring true, then you need to check our new Data Alert service on Image Hunter!
Data Alert lets you define an area of interest anywhere around the globe, the resolution your project requires and the number of months we should keep the alert active. Once this is set up, we check for new data over your area of interest every single day, and send you an email alert when we find coverage that meets your specifications.
We have a short YouTube video with directions to set up a Data Alert, check out the second video. We also have written directions for Data Alert here.
It’s that easy to find the data you need for all of your key projects.
If you would like to check out Data Alert, send us an email at sales@apollomapping.com or visit Image Hunter and click on the bell icon in the header to get started using this great service!