
In keeping with the Urban Air Mobility initiative, NASA has signed a space air agreement with Uber to further these goals and participate in the future of urban air travel. Big plans are in the works for Uber and their UberAir program, with plans to start demonstration flights of their flying taxis in 2020. Ambitious as it seems, Uber is investing in the technology needed to make this a reality. They just announced the opening of a new research and development facility in Paris, France called the Advanced Technologies Center (ATCP). ATCP will work on artificial intelligence and airspace management systems.
Uber is focusing on constructing an all-electric plane for their air taxis. One of the major hurtles is designing an electric aircraft that can perform a nearly vertical take-off and landing. Electric is beneficial for numerous reasons, the most obvious is the noise concern. Just one helicopter makes a considerable amount of noise. Imagine dozens of gas powered propellers flying overhead. Electric also makes distributed electric propulsion (DEP) technology possible.
Propeller planes are a thing of the past, right? Conjuring up images of World War I era Spitfires. Like all things, our past shapes our future and we have come around again to propeller driven aircraft. With DEP, instead of one or two large propellers, aircraft can have many small propellers lining the wing of the plane, distributing the load. Using math and models that are over my head, it is theoretically possible to reduce drag and wing size in electric planes, increasing efficiency while reducing weight and power consumption.
A handful of companies are jockeying to produce the first commercially viable, all-electric passenger plane. Most are small, holding two to four passengers including the pilot. Uber imagines a world where rooftops in urban centers act as mini airports, whisking commuters home to the suburbs over the plebs sitting in traffic below. Turning a two hour commute into 15 minutes. As you can imagine, all of this isn’t cheap. If and when this becomes a reality, you can bet your bottom dollar that it will take a significant amount of time for the price to drop to a reasonable level and make it viable for most long-distance commuters, many of whom live far outside the city due to the cost of living.
This may seem like a pipe dream, but as the only viable plan for the oft spoken of flying cars, it’s the most feasible, even if it takes a lifetime or two.
Every time we look at WorldView-3 and WorldView-4 (WV3/4) imagery, we are blown away. And we hope you are equally impressed with the data! Last month we checked out a coastal Moroccan town and for the June WorldView-3/4 Image of the Month, we head to the Far East with a look at the uber-modern Japanese city, Tokyo.


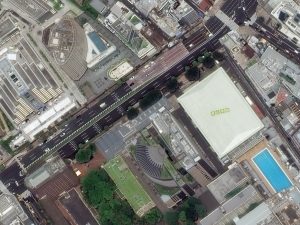
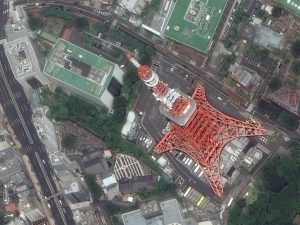
Tokyo is the only city I (Brock writes this unsigned article series) have ever seen that made New York City look small. If you are a fan of technology, big cities and a vibrant nightlife, Tokyo is the spot for you! In these four images, you see a famous historic site (can you name it?), a shrine to baseball, writing on rooves and a colorful tower–we are particularly fond of its red paint. This 30-cm WorldView-3 data was collected on June 10, 2017 and has been processed by Apollo Mapping for improved colors and clarity. (Images Courtesy: DigitalGlobe)
PLEASE NOTE: Effective May 2016, WorldView-3/4 prices dropped again! Are you interested in finding out more about these price drops? If so, send us an email at sales@apollomapping.com.
WorldView-3 launched in late 2014 and WorldView-4 launched in late 2016; taken together they are the most advanced satellite constellation the commercial marketplace has ever had access to. Here are a few of the features that really set these satellites apart from the competition:
- Improved Resolution
- Higher resolution means you can see more detail in WV3/4 imagery.
- Data collected at nadir will have 31-centimeter (cm) panchromatic, 1.24-meter (m) visible and near infrared, 3.7-m SWIR (WV3 only) and 30-m CAVIS (WV3 only) bands.
- At 20 degrees off-nadir, the resolution is 34-cm panchromatic, 1.38-m visible and near infrared and 4.1-m shortwave infrared.
- Per US government regulation, all WV3 SWIR orders are produced at a maximum resolution of 7.5-m. CAVIS bands are not available for purchase at this time.
- Additional Spectral Bands
- If spectral analysis is part of your project, then no other satellite can match WV3 with its: 8 bands of visible and near-infrared data; and 8 shortwave infrared bands which are crucial for geological studies.
- Better Positional Accuracy
- With accuracies of 3.5-m CE90% or better (without ground control even!), WV3/4 has no rivals for its enhanced positional accuracy.
- Daily Revisits
- At 40 degrees latitude, WV3/4 will each be able to image every location daily with 1-meter or better resolution and then every 4.5 days at 34-cm resolution or better.
- Increased Collection Capacity
- WV3/4 feature 13.1-km swath widths (at nadir) with the ability to collect up to 680,000 square kilometer (sq km) of high-resolution data per day per satellite.
- Improved control movement gyros translate into larger maximum contiguous collection areas per pass, with up to ~7,500 sq km of mono imagery and ~3,000 sq km of stereo possible.
If you are interested in WorldView-3 and/or WorldView-4 imagery for your next project, please let us know by phone, 303-993-3863, or by email, sales@apollomapping.com.
You can also find more WV3 samples and technical information on our website here and then WV4 samples and information can be found here.
Map Mavin is our GIS cloud, have you checked it out yet? If not, you can find out more information about it here.
If Map Mavin looks like a service you could use to create the web maps required for your next project, then you need to check out this monthly article where we give away up to five (5) free subscriptions!

So here is how this will work. Each month, we will give away up to five free one-month subscriptions to Map Mavin–that is a $20 value per subscription! Included in this free one-month subscription is 5 gigabytes (GB) of cloud-based storage and download bandwidth, plus you even get an additional free trial month. Once you exceed this 5 GB limit, you would be charged $0.75 per GB for the storage and/or bandwidth you use in the rest of the month. Then you would pay a base rate of $20 per month for Map Mavin from there if you decide to keep the service active. If you are already a Map Mavin client, we will credit your account $20 if you win the contest.
To win, you will need to submit the correct answer to the trivia question below. You have 24 hours from the time our newsletter sends to submit your answer. We will randomly draw the five winners from the group of readers who answered correctly; and then announce these winners in the next edition of The Geospatial Times.
Okay, ready, set, here we go:
Name a city in the United States that starts with the letter F–it’s that simple folks, we want winners every month until the new overhauled Map Mavin drops (the webmap upgrade is already live if you want to check that out)!
You have 24 hours to get us the correct answer to this question by email. Please submit your answers to sales@apollomapping.com.
May 2018 Free For All Answer & Winners!
We had another winner last month, Alex Elseser, who guessed Escondido, California which is definitely a city in the United States that starts with the letter E, nice work! Have you checked out Map Mavin recently? If not, you need to as we dropped a huge front-end performance update in May which is unreal!!
Good luck winning our monthly prize and let us know if you have any questions about Map Mavin!
In May, we checked out the site of an NCAA baseball game in Texas and we stick with the college theme but move to the Pacific Northwest with a look at the site of the 2018 Division 1 Outdoor Track and Field Championships, Hayward Field on the campus of the University of Oregon, for this The Pléiades 1–SPOT 6/7 Stadium of the Month.

 A 50-cm color image of Hayward Field in Eugene, Oregon, USA collected on December 6, 2017 by Pléiades 1B; and then a 1.5-m SPOT 7 image of the same stadium collected on October 28, 2017. These images have custom processing and color balancing applied by Apollo Mapping. PLEIADES © CNES 2018, Distribution Airbus DS. SPOT © Airbus DS 2018.
Name & Its Origin: Hayward Field is named after the 44 year coach of the University of Oregon track and field team, Bill Hayward, who coached from 1904 to 1947.
Location: Located on the southeast side of the University of Oregon’s campus in Eugene, Hayward Field is just a half mile (0.8 kilometers) from the banks of the Willamette River. The track and field stadium is some 445 feet above sea level and is about 53 miles (85 kilometers) from the Pacific Ocean.
Stadium Capacity/Size, Architect & Build Date: Originally opened as a football stadium in 1919, Hayward Field added a 6-lane 440-yard long track in 1921 for just $10,000, thereby ushering in the era of track and field events. In 1970, the football team moved into Autzen Stadium meaning that Hayward Field became an exclusive venue for track and field; then in 1980, the track was converted to a 400-meter oval. There is also a two-year major renovation planned that will start during the summer of 2018 and in the end will take the seating capacity to 12,900 (from 10,500 now) with room for up to 30,000 fans.
Type of Field Surface: Hayward Field features an Olympic caliber track surface installed by Beynon Sports, the BSS 2000, which is a combination of rubber and polyurethane.
Key Sports Teams: The University of Oregon men’s and women’s track and field teams call Hayward Field home.
Most Popular Yearly Event: After checking out multiple ticketing websites, it appears that Hayward Field is currently only used for track and field meets and championship events.
Fun Factoids: (1) In 1969, Hayward Field hosted the Eugene Pop Festival where the Doors played a short set of just 4 songs to approximately 5,000 fans. (2) If you have seen the movie, Animal House, then you have also seen Hayward Field as it had a cameo in the popular John Belushi movie. (3) The first Nike shoe every made for sale was created in 1974 with a waffle iron in the basement of Hayward Field by Coach Bill Bowerman and track athlete Phil Knight.
The Pléiades 1 High-Resolution Satellite Constellation
The Pléiades 1 constellation (or at least part of it!) has been in orbit since December 2011 and if you have not had a chance to check out any sample imagery, take a few moments and have a look at the gallery on our website. If you work with high-resolution imagery, you should consider Pléiades 1 for your next geospatial project.
A variety of Pléiades 1 products are available from both a growing archive and as a new collection, including 50-centimeter (cm) pansharpened imagery and 50-cm panchromatic–2-meter (m) 4-band multispectral bundles. We are happy to discuss the technical specifications, pricing and tasking options available with this satellite constellation.
The SPOT Medium-Resolution Satellite Constellation
The SPOT medium-resolution constellation consist of seven satellites launched from 1986 to 2014 with the most recent additions, SPOT 6 and SPOT 7, launching in 2012 and 2014 respectively. SPOT 6 and SPOT 7 are twin satellites offering 1.5-m panchromatic and 6-m 4-band multispectral data with a massive footprint at 60-kilometers (km) wide. For projects requiring recent archive coverage or rapid new collections of medium-resolution data, SPOT 6/7 should be one of your top imagery sources!
More sample images and technical information about Pléiades 1A and 1B can be found on our website here; while the same can be found here for the SPOT constellation and specifically about SPOT 6/7.
The Apollo Mapping sales team can answer any questions you might have about Pléiades 1 and/or any of the SPOT satellites. We can be reached at (303) 993-3863 or sales@apollomapping.com.
In this monthly piece, we give our readers a sense of the high-resolution imagery coverage collected over a geography during a specified window. To do this, we pick a high-resolution satellite constellation, a defined time period and area of interest, then report key statistics on the total amount of imagery collected in square kilometers (sq km). Without further delay, let’s jump into our analysis.
 This map shows the areas imaged by the Pléiades 1 constellation from June 1 to August 31, 2017 over China and Russia. Please note that in many instances, multiple images were collected over the same area which is difficult to portray on this static map.
Graphic Region of Interest: China and Russia plus off-shore islands
Land Mass Covered: 26,298,197.0 sq km
Time Period: June 1 to August 31, 2017
High-Resolution Satellite Constellation: Pléiades 1A/1B
Pléiades 1 Constellation Imaging Statistics–China and Russia
Total Area Collected: 6,393,497.0 sq km; 34,747.3 sq km per satellite/per day
Area Collected @ 20% or Less Clouds & 30 Degrees or Less Off-Nadir: 3,494,654.7 sq km; 18,992.7 sq km per satellite/per day; 54.7% of total
We love maps.
 (Images Courtesy: DigitalGlobe. Processed by Apollo Mapping for improved color accuracy and clarity.)
We love imagery.
We love work breaks.
We hope you like them as well!
Summer glorious summer, so happy you are here! Go out and enjoy some sunshine but before you do, check out this colorful image collected over the French Open on June 10, 2017 at 13:25 local time. Held each year in late May to early June at the historic Stade Roland Garros in Paris, the French Open is the second tennis Grand Slam of the season. The only Grand Slam played on clay courts, the recent editions of the tournament have been dominated by Rafael Nadal on the Men’s side–winning his 10th title in 2017; and then Jeļena Ostapenko won her first Gland Slam title in 2017 on the women’s side. According to 2017 TV schedules, Ostapenko would have been scheduled to play in the Women’s Final on June 10th.
Have a great rest of your workday!
I read somewhere that post-Millennials (aka Generation Z) are less interested in engaging in critical thinking than the generation before them. Of course, older generations are always overly-captious of younger ones: they have it easier, they don’t work as hard, less is expected of them, etc. And when I think back to when I was their age and how apathetic towards critical thinking I was, this assessment loses traction for me when it is aimed at one generation in specific. To be fair, we’re a hyper-critical society that is bereft of the “thinking” component far and wide. Every generation or cohort is, or has become, anemic in their intentional and introspective understanding of the civil sphere and its importance to societal cohesion and making progress. In part this is due to the capitalistic world order of which we’re all beholden to per our station in life, but it is also because we no longer learn proper, thoughtful engagement with the outside world and those who comprise it.
This is something that education was intended to provide, and I believe at one time did (to a degree), but as the decades have rolled on, the funding cut back, and the imposition of consumer culture taken over as the omnipresent Master, ephemeral indulgence has negated the perceived need of any form of thoughtful reflection or evaluation–or perhaps more appropriately, any desire to do so. Once everything in a society became thoroughly disposable, and in many instances expires in the blink of a screen refresh, there becomes less time–or expectation–to analyze anything. It becomes inefficient to do so. When this is representative of the material interactions of our lives, it soon follows that it becomes representative of the human relationships of our lives as well.
 Try it. It’s good for you.
One of my favorite bumper stickers reads, “Throw it away? There is no away.” For if there were an “away” then we would be free to continue to use and discard, to act without consequence, to speak without thinking. But true to form of this windowsill wisdom, all of our decisions do result in literal and figurative trash cluttering up our roadways, landscapes, forests, cyberwaves, relationships and minds. It is beyond time for us (as a society) to reinstitute the concept of critical thinking as an imperative component of the development of the human experience.
I was talking to a friend of mine recently who lives in a tiny mountain town of about 3,000 in the foothills of the Rockies. The town has started to grow in the decade since he moved there, with property values going up, tourists coming in, bigger city “problems” entering the scene. His oldest kid, about eight now, said of the tiny Hamlet, “[City] is going through puberty.” From the mouth of babes, indeed… It really is quite interesting when we consider the endless curiosity of children and how eventually we thwart them from discovery because we just want them to quit bothering us. This is a tad hyperbolic (as I’m known to be), but it’s also, at least in part, true. We compartmentalize the learning process with such precise direction and tidy boxes that we prevent any cross-pollination of thought or any encouragement to explore in an intellectual manner. This doesn’t mean we don’t produce some of the finest scientific, medical, legal and political minds, but we don’t see as much interdisciplinary thinking, and we surely lack the knack for bridging together otherwise seemingly disparate concepts and concentrations. Just how can one be a critical thinker if they have to stay in their lane–or their backyard–to do so?
To reiterate, a lot of this is structural, educationally and socially, and because of this we have deadened the potential of the young (in some regards) before they fully develop it. This means that as they wander through some of their most productive years they’re left fitting themselves into premade boxes and following societally imposed rules of order to become successful. Any critical thinking that does take place is often solely self-reflective and often related to materialist aspirations and unreasonable expectations that are either no longer attainable, and in many cases, never were in the first place. If all critique is turned inwards, we get what we have now: an over-medicated and troubled populace.
So what’s my solution, you might ask: Perhaps we loosen the reins on the primary education system, let instructors have more say over curriculum as a response to the needs of the students and their development, introduce them to real world problems and real world problem solvers much earlier, and encourage them to capitalize on that beautiful innocent curiosity that fades away once we have become too hyperaware of ourselves. In turn, this might lead to the sustenance of the developing mind and identity, and less problems with finding the self as children become adults. Critical thinking is not simply being critical; it is understanding the world as a dialectic engagement to find the best path forward. With our lack of thinking in this modern society, all we’re left with is the critical; and we have too much of that going around…
Marco Esquandoles
Free Thought
This month in our Mapping for Good series we’ll take a look at how one university is using existing infrastructure and resources to map a whole city. City Scanner, a project from the Massachusetts Institute of Technology (MIT) and the City of Cambridge, MA, seeks to capture the “spatiotemporal variation in environmental factors” around the city. So what exactly does that entail and how are they going about it? Let’s take a look!
City Scanner is just one of many ongoing projects across America’s urban locales seeking to play a role in the emerging “smart city domain”. A smart city is defined as a, “Municipality that uses information and communication technologies to increase operational efficiency, share information with the public and improve both the quality of government services and citizen welfare.” Rather than having to fund and deploy an entirely new fleet of vehicles to collect data, the MIT team decided to mount various environmental sensors on garbage trucks. After only several months, the entire city of Cambridge had been mapped!
 A screengrab of the web-based City Scanner application, with the Thermal Imaging field highlighted over Cambridge, MA.
The multiple sensors on each of the six trucks measured a variety of metrics, including air quality, the thermal flux of the built environment, particulate matter, temperature and humidity, and road quality. As more and more data was collected, the team was able to represent their collected data visually for both residents and researchers to experience.
So how were each of the mentioned metrics measured? Let’s dive deep into the nerdiness of the endeavor for a second and find out:
Temperature & Humidity: City Scanner includes low-cost temperature and humidity sensors that can be used to understand pedestrian activities as well as heat islands in urban areas.
Road Quality: Using accelerometers, City Scanner identifies road quality based on vehicle vibrations. City Scanner literally creates a roadmap for improving roads.
Thermal Imaging: Thermal imaging can be used to assess the energy efficiency of building envelopes, monitor infrastructure, and study the impact of anthropogenic heat in the cities (e.g. Urban Heat Island effect).
Particulate Matter: City Scanner counts particles in different diameter size bins (PM10, PM2.5 and PM1) using a small laser. The particle counts are an indicator to determine signatures of different pollution sources. This data can inform epidemiological research and urban health policies.
You may be wondering after reading all this, “What’s the real value?”
Great question! This project, among others, gives us a glimpse into an entirely new future of decision-making. By using high-tech sensor technology in conjunction with a low/no cost (no cost in the sense of nothing needing to be added to existing infrastructure and systems besides the sensors themselves), MIT has shown that little needs be built in order to gain a vastly more accurate understanding on one’s city. From the collected data, researchers are then able to identify gaps in service across the city.
The possibilities are, well, endless!
Fletcher Berryman
Cloud Tamer
(970) 710-0909
fletcher@apollomapping.com