
DigitalGlobe’s Advanced Elevation Series (AES) is a suite of elevation products that are reasonably priced with global coverage. By utilizing existing archive coverage and their constellation of 50-cm WorldView satellites, DigitalGlobe is able to offer an industry first: global elevation data delivered in reasonable time frames at competitive market prices.
There are three basic product offerings within the AES: Mapping, Precision and Very High Precision elevation data. The three products are differentiated by their resolution and accuracy–this information is summarized in the table below. For each of the products, DigitalGlobe offers both a Digital Surface Model (DSM) which includes human-made and natural features (such as trees, bushes and buildings); and a Digital Terrain Model (DTM) with these features removed. Other important specifications include:
- Minimum Order Size
- 100 square kilometers
- Geographic Coverage
- Global
- Price lifts do exist for some Asian countries
- Cloud Cover
- 5% or less
- Cloudy pixels in final product are identified with an Esri polygon shapefile
A Summary Table of Key AES Product Specifications
| Resolution | Absolute Vertical Accuracy (LE90%) | Relative Vertical Accuracy (LE90%) | Absolute Horizontal Accuracy (CE90%) | Relative Horizontal Accuracy (CE90%) | Ground Control (GCPs) Required? | Formats Available | |
| Mapping | 8 m | 8 m | 5 m | 10 m | 8 m | No | DSM / DTM |
| Precision | 4 m | 4 m | 2 m | 5 m | 4 m | Yes* | DSM / DTM |
| Very High Precision | 2 m | 2 m | 1 m | 2 m | 3 m | Yes* | DSM / DTM |
* Horizontal and vertical accuracies stated here assume GCP accuracy of 50-cm CE90%/LE90% accuracy or better.
Below is a comparison of two Very High Precision products created over Dunedin, New Zealand: one is a DSM and the other a DTM. DSMs are commonly used in line of sight and watershed analysis as they include human and natural features; while DTMs are commonly used in orthorectification where a ‘true’ model of Earth’s surface is crucial for improved horizontal accuracy. In this animation, we start with the DSM and then transition to the DTM, using the same color ramp with low elevations in red and higher elevations in green.
 An animated comparison of 2-meter Very High Precision DigitalGlobe elevation models created over Dunedin, New Zealand; the first image is a DSM and the second is a DTM. (Data Source: DigitalGlobe)
With pricing to meet different budget requirements and global coverage, DigitalGlobe’s AES elevation suite is the ideal solution for:
- Regional studies which require an analysis of elevation.
- Academics in need of a reasonably-priced solution to replace dated and low resolution public sources.
- Engineers looking to replace costly field labor in distant lands.
- More accurate orthorectification, particularly in areas of high topographic change.
If you would like more information about the global AES offering by DigitalGlobe, you can send requests to sales@apollomappping.com or call us at (720) 720-7988.
You can also find out more about the technical specifications of AES products on our website here.
Do you have an area of interest that requires regularly updated imagery but you do not have time to check daily for this data?
Or perhaps you have a remote location that needs updated imagery but you cannot afford a new collection?
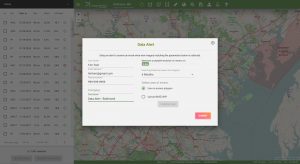
If either of these questions ring true, then you need to check our new Data Alert service on Image Hunter!
Data Alert lets you define an area of interest anywhere around the globe, the resolution your project requires and the number of months we should keep the alert active. Once this is set up, we check for new data over your area of interest every single day, and send you an email alert when we find coverage that meets your specifications.
We have a short YouTube video with directions to set up a Data Alert, check out the second video. We also have written directions for Data Alert here.
It’s that easy to find the data you need for all of your key projects.
If you would like to check out Data Alert, send us an email at sales@apollomapping.com or visit Image Hunter and click on the bell icon in the header to get started using this great service!
You may (or may not) be asking yourself how our new application, Map Mavin, differs from ArcGIS. At the heart of it, we function in much the same way. We both allow GIS users to share maps. Pretty cool, right? ArcGIS is the leader in the US market and they have tons of functions in their desktop application. But not everyone has the need or available cash to buy a license for ArcGIS.
That’s where ArcGIS Online comes in. For a more affordable price, you can use their online version. The catch here is that in order to view a private map your users also need to buy a subscription. Let’s say you have 50 people in the field, all recording data. Each field worker needs a subscription or they have to record the data elsewhere for the admin to enter it later. That means more work for you.

With Map Mavin, Map Viewers are free–always. As an online application, Map Viewers can access your private web maps on any computer without expensive software. Map Viewers can edit data or they can be restricted to view only. Map Mavin also has Screen Share and chat, so your users can collaborate in real time on any project.
At the crux of Map Mavin is usability. Your time is precious and you shouldn’t spend it on training. Map Mavin is easy to use. No long training sessions needed. Our support team is available at the drop of a hat to help you out.
We are a small company looking for ways to offer the best service to our clients. With that, comes flexibility. You want a feature we don’t have? Let us know and we’ll get working on it.
Map Mavin is not a replacement for ArcGIS. Map Mavin fits in the gaps that ArcGIS left behind. We are here for the everyday user, the hobbyist, and the professional that is just trying to share their data without strings attached.
Would you like to see how Map Mavin could prove useful for your needs? Why don’t you take a look and see for yourself! Check out this map of New York City’s Public Wi-Fi Hotspots. Making maps like this one takes only minutes and can be done without any background in cartography. So what are you waiting for? Try Map Mavin today!
And if you have any questions about Map Mavin, shoot us an email.
- It’s tech time, so here is your list to get your thinking about all of the new, cool innovations that could hit the markets soon.
Low power use system can selectively remove toxins from wastewater.
Combining solar farms and bee habitat.
Lithium batteries with doubled capacity by adding ceramic layer.
Step forward for bacteria-powered paper batteries.
World record power-generating tidal turbine off coast of Scotland.
Low cost copper-based catalyst to split water into H and O gas.
Record low-cost perovskite double-layer solar cell developed.
A change in silicon etching can increase solar cell power output by 10%.
From textile dye to a battery ingredient.
 The August 2018 NOAA temperature percentile departure map shows a large pocket of cooler than normal weather over northern Canada with pockets of record warmth in the northeast of the United States, northern Europe and central Africa.
- The August 2018 NOAA Global Climate report is out and well as per usual, the warming continues. With the fifth warmest temperatures on record for an August since 1880, this month was characterized by record warmth across much of the world’s ocean basins as well as record warmth on pockets of all continents other than Australia and South America. That’s 404 months above the 20th Century temperature average as the Trump administration continues to deny climate change, sad…
- October 12th is World Egg Day and in honor of these tasty morsels, my Google search of the month was, “GIS and eggs.” If you scan through the results, you might find this gem by Gillenwter et al. where they look at walleye spawning behavior. And okay while not chicken eggs, these are fish eggs they are looking at and the GIS analysis they complete is really top-notch work!
- Last month we checked out Maryland’s second largest city’s GIS resources and this month we move up the East Coast to check out the same for Worcester, Massachusetts. And on Worcester’s GIS homepage, you will find a plethora of links to themed city maps; to download GIS files as well as for custom data requests; and finally to a text-based property search.
Brock Adam McCarty
Map Wizard
(720) 470-7988
brock@apollomapping.com

Have you checked out Image Hunter recently?!?! If not, you should!
Listening to the feedback we received on improving imagery search engines over the years, the new version of Image Hunter features a major overhaul to the user interface as well as to the backend architecture. Image Hunter is now built on open-source technology so now it works on all computers, not just on Windows machines. We slimmed down the user interface to make it easier to find the imagery filters and other available tools. All things said, we really think you will enjoy your browsing experience–plus no other search engine even comes close to the breadth of satellites offered in Image Hunter!

Key October 2018 Improvement(s)
During the past month, we were happy to welcome our first digital elevation model (DEM) to Image Hunter! It is 5-meter AW3D Standard DEMs that have been extracted from the huge archive of stereo ALOS images. You can find out more about AW3D here and see the rest of our Image Hunter updates below:
- Updated the stereo-mono radial filter in the satellite selector to add in DEM.
- Fixed a small SPOT 6/7 bug in the image information modal and satellite selector.
Data Alert–An Automated Daily Imagery Search
We launched our highly anticipated Data Alert service in mid-2015 and it’s a hit! Data Alert lets you define an area of interest anywhere around the globe, the resolution your project requires and the number of months we should keep the alert active. Once an alert is set up, we check for new data over your area of interest every single day, and send you an email when we find coverage that meets your specifications. We have a short YouTube video with directions to set up a Data Alert, check out the second video; and we have written directions for Data Alert here.
The Satellites Available in Image Hunter
As you might have seen in past articles, we now feature hourly updates (seriously!) of GaoFen 1/2, GeoEye-1, KOMPSAT 2/3/3A, Pléiades 1, SPOT 6/7, SuperView-1, TripleSAT, WorldView-1/2/3/4 and ZiYuan-3!
Image Hunter can be accessed 24 hours a day, 7 days a week and is a one-stop shop for every major source of medium and high-resolution satellite imagery on the market today, including:
- Worldview-4
- WorldView-3
- WorldView-2
- WorldView-1
- QuickBird
- GeoEye-1
- IKONOS
- EROS B
- KOMPSAT-3A
- KOMPSAT-3
- KOMPSAT-2
- Pléiades 1 constellation
- Deimos-1
- Deimos-2
- TripleSat
- SPOT 1 to 7 constellation
- RapidEye
- GaoFen-2
- GaoFen-1
- ZiYuan-3 01/02 (mono and stereo!)
- Formosat-2
- ALOS PRISM (stereo)
- AW3D Standard (DEM)
- SkySat constellation
- SuperView-1 constellation
- Landsat 1-8
- TeLEOS-1
Key Features of Image Hunter
If any of our readers have struggled with other geospatial search engines that are clunky, only query one data source and/or do not provide image previews, then Image Hunter is the solution to your woes as it features:
- Online browsing of satellite imagery from 10 plus data providers and over 30 satellite systems.
- Near-instantaneous loading of low-resolution preview imagery with collection date, cloud cover and other key metadata.
- The ability to define your area of interest by address, coordinates, geometric shape or shapefile/KMZ.
- A responsive basemap with street names to provide spatial context when discovering data as well as crowd-sourced updates for the most accurate map possible.
- Exports of the area of interest you create as well as the scenes you select in shapefile or KMZ format.
- Support for all operating systems, and not just our friends with Windows machines!
Image Hunter can be accessed here all-day and all-night, we are excited to find out what you think about our imagery search engine! So if you have any ideas and/or feedback to improve Image Hunter, please let us know at sales@apollomapping.com or (303) 993-3863.
 (Images Courtesy: DigitalGlobe. Processed by Apollo Mapping for improved color accuracy and clarity.)
We love maps.
We love imagery.
We love work breaks.
We hope you like them as well!
Time flies when you are working too hard! So go out and take a nice work break but before you roll outside, check out this about 62-centimeter GeoEye-1 image collected over the Austin City Limits festival on October 7, 2017. We have covered the Austin City Limits before, also featuring a GeoEye-1 image from 2016. This time our image was collected at a high off-nadir (or tilt with regards to the land below) and it also has a bit of haze-cloud cover, sorry about that! Still a cool image of the festival which by the crowd sizes obviously does not kick-off until later in the day.
Have a great rest of your workday!
While I’ve loved writing all of the Mapping for Good articles we’ve done, I must admit that they are the most fun when I’ve got a particular connection to the place in question. To not admit an intense bias in this column would be criminal, yet I’d like to think that my cherry picking of topics and regions close to me leads to more passionate examinations of the many fun (and important) mapping projects out there doing good for the world. My time in Boulder (and our being based there) compelled me to highlight the Falling Fruit Project (started in town) years ago, my growing up in California led me to discuss the California Coastal Records Project and my love for the City of Chicago drew me to mention their health map at one point.
If there’s any trend here to be found beyond the personal asides, it’s an intense obsession with maps that are, well, cool! With that trend accidentally established at this point, I’m very excited to highlight a project dear to my heart and one that I hope will be replicated worldwide: oldNYC.org!
 A screenshot of OldNYC with the map’s extent hovered over the borough of Manhattan in New York City.
OldNYC.org is an extension of the New York Public Library’s massive archive of historical photos. The project is simple yet incredible: NYPL took thousands and thousands of photos from the 1870’s to the 1970’s and geocoded them to stitch together a map of New York’s past. On the vast majority of street corners in Manhattan you’ll find at least one historic photo represented as a red dot that can be clicked on to view in a pop-up. The project extends to the other boroughs as well, with areas such as Downtown Brooklyn, the South Bronx and Astoria, Queens having tons of photos.
While the range of photos is over a hundred years, the bulk of them are from around the Great Depression and into the WWII era:
“The images all come from the New York Public Library’s Milstein Collection. While many photographers contributed to the collection, the majority of its images are the work of Percy Loomis Sperr, who documented changes to the city from the late 1920s to the early 1940s.”
As briefly mentioned above, NYPL took each photo and assigned it coordinates, which the mapping software they used can then interpret and plot:
“The creators of this site associated latitudes and longitudes to the images in the Milstein collection. This process is known as geocoding. Doing this allows the images to be placed at points on a map, which enables new ways of exploring this collection.”
Pretty cool eh?
To learn more about OldNYC visit www.oldnyc.org or go the New York Public Library in person to learn more!
Fletcher Berryman
Cloud Tamer
(970) 710-0909
fletcher@apollomapping.com