
Every time we look at WorldView-3 and WorldView-4 (WV3/4) imagery, we are blown away. And we hope you are equally impressed with the data! Last month we were in China with a look at one of the world’s largest amusement parks, and for this 30-cm Color WorldView-3/4 Image of the Month we head to one of the Middle East’s most historic cities, Beirut, Lebanon.


 Beirut is considered one of the world’s most ancient cities with evidence of human inhabitants for at least the past 5,000 years. We selected the three images here for, one, the bright colors, especially the blue roof of the mosque, and two, for the small features that can be seen such as rocks, debris and old building walls. These images of Beirut were collected on September 30, 2014 by the 30-cm satellite, WorldView-3; and they have been processed by Apollo Mapping for improved colors and clarity. (Images Courtesy: DigitalGlobe)
PLEASE NOTE: Effective May 2016, WorldView-3/4 prices dropped again! Are you interested in finding out more about these price drops? If so, send us an email at sales@apollomapping.com.
WorldView-3 launched in late 2014 and WorldView-4 launched in late 2016; taken together they are the most advanced satellite constellation the commercial marketplace has ever had access to. Here are a few of the features that really set these satellites apart from the competition:
- Improved Resolution
- Higher resolution means you can see more detail in WV3/4 imagery.
- Data collected at nadir will have 31-centimeter (cm) panchromatic, 1.24-meter (m) visible and near infrared, 3.7-m SWIR (WV3 only) and 30-m CAVIS (WV3 only) bands.
- At 20 degrees off-nadir, the resolution is 34-cm panchromatic, 1.38-m visible and near infrared and 4.1-m shortwave infrared.
- Per US government regulation, all WV3 SWIR orders are produced at a maximum resolution of 7.5-m. CAVIS bands are not available for purchase at this time.
- Additional Spectral Bands
- If spectral analysis is part of your project, then no other satellite can match WV3 with its: 8 bands of visible and near-infrared data; and 8 shortwave infrared bands which are crucial for geological studies.
- Better Positional Accuracy
- With accuracies of 3.5-m CE90% or better (without ground control even!), WV3/4 has no rivals for its enhanced positional accuracy.
- Daily Revisits
- At 40 degrees latitude, WV3/4 will each be able to image every location daily with 1-meter or better resolution and then every 4.5 days at 34-cm resolution or better.
- Increased Collection Capacity
- WV3/4 feature 13.1-km swath widths (at nadir) with the ability to collect up to 680,000 square kilometer (sq km) of high-resolution data per day per satellite.
- Improved control movement gyros translate into larger maximum contiguous collection areas per pass, with up to ~7,500 sq km of mono imagery and ~3,000 sq km of stereo possible.
If you are interested in WorldView-3 and/or WorldView-4 imagery for your next project, please let us know by phone, 303-993-3863, or by email, sales@apollomapping.com.
You can also find more WV3 samples and technical information on our website here and then WV4 samples and information can be found here.
So, I joined the Bumble app a few weeks ago, you know, the one where the lady has to make the “first move.” As I’ve expressed elsewhere in this never-read-column, I hate social media and online dating, but the latter has become sort of the way people date these days so I have little choice. At least with Bumble I feel less creepy and commodifying of others since women have to make the final judgment. Well, I did a lot of swiping, yessir. If this were baseball my batting average would be abysmal based on the apparent lack of reciprocation, but that’s okay; it only takes one, right? Anyhow, after a few boring dates, a few interesting dates with extenuating circumstances (one gal looked nothing like her pictures, another had a gaggle of kids–and I’m not trying to be a step-daddy, and another had a stalker ex-husband–not trying to get killed), I was contacted by this gal who I have to assume I only grudgingly swiped right on. I don’t know why I did. None of her photos were particularly attractive; some were awkward, many were too far in the distance to get any detail. Her short blurb about herself was nothing significantly creative or powerful. So, I don’t know, but I did. I guess I figured the likelihood of it being a match was low anyhow, so what was there to lose? It takes just as much effort to swipe right as left, I guess…
Anyhow, she contacted me and we had sort of a drawn-out back and forth on the dating app. I felt like I was only half-engaged because I frankly thought she was not much more than average, and she, well, she was only responding randomly so the whole thing seemed kind of halfhearted on both ends. Either way we decided to meet up for a beer. We threw a few ideas out there and picked one that I had actually initially decided would be a bad idea (my local watering hole), but hey, it was close to my house, so why not? At 7pm on a Wednesday, what could go wrong? Besides, if/when it failed, I could hang out at the bar for a little longer if I still had the itch or I could get home quickly. If nothing else, meeting someone new is always good–I’m not trying to completely cut myself off from society. At least not yet…
 Don’t get your hopes up.
Well, I got to the bar a few minutes early and grabbed one of the few booths there and took the seat with me facing the door so I could see her. Now remember, I wasn’t expecting anything. It sounds vain, but I expected to find her quite boring in terms of attractiveness. Not ugly, just not a head-turner. Well, she walked in right on time and had a glow about her, a smile that radiated, there was this aura and the goose bumps started to sprout. Somehow she had managed to choose every picture that didn’t accurately capture her beauty and post them when just the opposite was true: she was stunning.
She grabbed a beer and we jumped into a great conversation, and then, unfortunately, and sort of what I expected could happen and why I didn’t want to come there, the owner of the bar stumbled over to the table. Now, I like him, we’re friendly for sure, but when he gets to drinking he can be obnoxious–and I’m here on a first date and enjoying it–and it turned out to be recipe for disaster. Had the date been a bust then he might’ve been a welcome sight, but it wasn’t, not yet. He drunkenly consumed about 60% of our time together, pushing her buttons at every opportunity he could. And she absorbed it. I was so amazed by her ability to roll with the punches, even though I could tell she was really annoyed, that I found her even more endearing. We had a couple more beers–on the owner’s tab–and then split once he really crossed a few social boundaries. I wasn’t mad at him, I knew what to expect, but I was worried I’d derailed this thing before it started. I walked her to her car and we hugged and made plans to meet up a few days later. Phew.
We texted sporadically over the next few days. I got the sense that she wasn’t really into being connected to the phone all the time–which was great, but yet still yearned for a little more engagement to see if I could figure out what might come of this thing, if anything. Well, a few days later, a Sunday, we met at her house and walked to a bar and had what I thought was a really good time. I guess I’m guilty of oversharing in some instances, especially after a few beers, but I don’t think I committed any grievous sins. She was going out of town later that week and I asked if we could get together before she left and she said “yes.” We hugged, then a little awkward moment occurred and I tried to plant a smooch, but she turned her head at that moment because her dog (who was with us) tugged away at the leash and diverted her attention–or at least that’s how I interpreted it. I missed the moment, she smiled and I departed. Then I never heard from her again.
I believe somewhere in here I’ve mentioned that I quite often get in my head when it comes to the women I like. It is almost impossible for me to not imagine some future point in time with a woman the first few times I hang out with them if I like her. It’s almost like the kiss of death: what I imagine, or even hope for, distinguishes any possibility that it might happen. Of course this isn’t always true, but when it does happen, it feels like it always happens. It’s deflating, defeating, demoralizing.
I’d sent her a text with no reply the following day. I gave it a full day off and then sent another about meeting up, again with no reply. I haven’t deleted the text tread yet, but that will be the final closure to the whole thing. That will happen in the next day or two after this writing, long before this essay goes to press. So I think about when it went off the rails, what all of the extenuating circumstances might have been that caused it to fizzle so quickly, what I did/didn’t do, said/didn’t say, etc. And now I’m just waiting for it all to sink in.
Postscript (written a few days after the initial essay):
(See this month’s Geography of My Mind for full context): It sunk in. Girl A (this essay) feels towards me about the same way I feel towards Girl B (GoMM). There are elements that we have in common, we get along, and maybe there’s a little attraction, but ultimately, neither was a “match.”
Marco Esquandoles
Table for One
Last month we found ourselves in the heartland of America with a look at a crucial Big 12 college football matchup, and for the December Pléiades 1–SPOT 6/7 Stadium of the Month we head to the East Coast to the site of the 119th Army-Navy football game in Philadelphia, Pennsylvania, i.e. Lincoln Financial Field.

 A 50-cm color image of Lincoln Financial Field in Philadelphia, Pennsylvania, USA collected on July 8, 2018 by Pléiades 1A; and then a 1.5-m SPOT 6 image of the same stadium collected on October 27, 2017. These images have custom processing and color balancing applied by Apollo Mapping. PLEIADES © CNES 2018, Distribution Airbus DS. SPOT © Airbus DS 2018.
About the Venue: Located on the southern side of Philadelphia, construction on Lincoln Financial Field started on April 3, 2001; and was completed in time for its opening National Football League (NFL) game between the home team Philadelphia Eagles and the Tampa Bay Buccaneers on September 3, 2003. Built at a cost of $512 million versus just $63 million for the stadium it replaced, Lincoln Financial Field can hold 67,594 plus fans and features a Bermuda grass field sourced from New Jersey or North Carolina.
Fun Factoids: (1) The first Army-Navy game dates back to 1890 where Navy beat Army 24 to nothing. The 119th edition of the matchup takes place at 11am Eastern on December 8th. Navy holds the edge in the matchup, with a 59-49-7 (wins-losses-ties) record. (2) While only occupying a space a half acre larger than the old Veterans Stadium, Lincoln Financial Field has 1 men’s bathroom for every 58 men; versus just 1 bathroom for every 319 men in the old stadium! (3) Naming rights for the Eagles’ stadium were sold to Lincoln Financial in June 2002 for $139.6 million over 21 years, which according to this list makes it one of the most expensive naming rights deals every signed for a stadium.
The Pléiades 1 High-Resolution Satellite Constellation
The Pléiades 1 constellation (or at least part of it!) has been in orbit since December 2011 and if you have not had a chance to check out any sample imagery, take a few moments and have a look at the gallery on our website. If you work with high-resolution imagery, you should consider Pléiades 1 for your next geospatial project.
A variety of Pléiades 1 products are available from both a growing archive and as a new collection, including 50-centimeter (cm) pansharpened imagery and 50-cm panchromatic–2-meter (m) 4-band multispectral bundles. We are happy to discuss the technical specifications, pricing and tasking options available with this satellite constellation.
The SPOT Medium-Resolution Satellite Constellation
The SPOT medium-resolution constellation consist of seven satellites launched from 1986 to 2014 with the most recent additions, SPOT 6 and SPOT 7, launching in 2012 and 2014 respectively. SPOT 6 and SPOT 7 are twin satellites offering 1.5-m panchromatic and 6-m 4-band multispectral data with a massive footprint at 60-kilometers (km) wide. For projects requiring recent archive coverage or rapid new collections of medium-resolution data, SPOT 6/7 should be one of your top imagery sources!
More sample images and technical information about Pléiades 1A and 1B can be found on our website here; while the same can be found here for the SPOT constellation and specifically about SPOT 6/7.
The Apollo Mapping sales team can answer any questions you might have about Pléiades 1 and/or any of the SPOT satellites. We can be reached at (303) 993-3863 or sales@apollomapping.com.
Launched in late 2016 (and relaunched in mid-2018), Map Mavin is our pay-as-you go GIS cloud that lets users make unlimited public and password-protected web maps. Once you upload your vector and raster files to our secure Amazon cloud, you are ready to make and share your web maps in minutes–just like this demo web map we made with vectors and a base layer TIFF from Boulder, Colorado.
 Have you tried our new (free) ArcGIS-to-Map Mavin plugin which will create web maps from your projects with the push of a button?
And with our Screen Share function, you can link up with users all around the world to collaborate on a map in real-time. Picture a live webex in your mind but just based around a map that moves and changes as the members of your team update information. Imagine the possibilities of working in real-time with a team of collaborators around the world without any GIS knowledge required!
Priced at just $35 per month with a free trial month, there is no other cloud-based GIS on the market that can compete with Map Mavin on price. For your $35 per month, you are able to store up to 5 gigabytes (5GB) as well as make and share unlimited web maps. As an added bonus, you can cancel your monthly contract at any time.
December 2018 Product Updates
In the past month, we released Map Mavin updates that included but were not limited to the following list of fixes, additions and/or enhancements:
- Added Map Galleries where you can feature a collection of public web maps.
- Added a detailed vector basemap with thousands of new points of interest.
- Improved choropleth mapping with color ramps and a rebalance button for making smooth, custom color steps.
- Ability to add an entire folder of layers to a web map.
- Download layers directly from web maps.
- Highlight features on a map when selected in the attribute table.
You can find a full list of our recent changes here. And please stay tuned to this series where we will let you know about the most exciting Map Mavin changes released in the past month.
If you have an improvement or feature addition you would like to add the Map Mavin product road map, let us know by email at support@mapmavin.com.
Are you interested in trying out Map Mavin? If so, you can sign up here. Or maybe you would like a live demo of the product before you sign up? If so, send us an email at support@mapmavin.com and we will get one scheduled right away!
We are excited to announce the release of our brand new ArcGIS plugin for Map Mavin. Now you can export your data layers directly from ArcGIS to Map Mavin with the click of a button. You’ve spent your precious time creating the perfect map, now you want to share it with the world. ArcGIS Online only allows you to export one layer at a time and doesn’t save the symbology. On top of that, your users need a pricey ArcGIS Online account. Not with MapMavin! We believe that sharing data should be easy.
Whether the users are far away or don’t have expensive GIS software, you can use our plugin to export your data directly to a platform that quickly and easily shares maps with people around the world. Your users don’t need hours of training or a costly software license. Once you share your map, they can sign up for a free account and get down to business.
Let’s get started. First, make sure you have your own Basic or Premium Map Mavin account set up and ready to go. Next, download our free plug-in from here. Make sure ArcGIS is closed before installing the application. Double-click on the plugin file and it will automatically install. When you open ArcGIS, you’ll see a new window pane on the right side of the screen. Click the Log in button at the top and enter the username and password for your Map Mavin account.
In ArcGIS, open the map you want to share on Map Mavin. Then, click on the Upload to Map Mavin button. All the layers in your map, along with their colors, will automatically upload to your layers tab in Map Mavin. The layers will also be added to a new map in your Maps tab. From here, you can share your map with anyone around the world.
It’s as easy as that! If you don’t believe me, try it for yourself. Sign up for a free 31-day trial and give it a whirl. What have you got to lose? Except maybe ArcGIS Online.
GIS is an acronym that is relatively unknown to the public at large, but it’s gaining traction and wider use every year. As geographic information systems (GIS) become more prevalent in all areas of commercial, government and non-profit work, the more colleges and universities need to step up their games and offer comprehensive GIS programs for their students.
GIS has two major components. The main goal is to create maps that display rich statistical information that is easy to consume and present in a geographical framework. Behind that is all the hard work and data processing that goes into creating these maps. It requires training, data and expensive software. For colleges looking to pique students’ interest in GIS and get them into a more extensive program, they don’t want to start at the very beginning. Instead, they want students to get a taste of how GIS works and the power of GIS to solve problems and convey information.
The barrier to entry in Esri’s ArcGIS makes it difficult to start using a GIS without extensive training–and deep pockets. To help facilitate search and discovery in introductory geography classes, we set up a system that allows schools to purchase two months of Map Mavin at a reduced price. Students are given a shared Map Mavin account and a simple task: make a map of the city using open source data. By utilizing free GIS data provided by local cities, students can gain insight into the breadth of information that is readily available.
The simplicity of Map Mavin allows students to quickly upload their datasets and test visualization tools. For this case study we used the city of Denver and their extensive open data catalog. A low income housing layer can be turned into a choropleth map showing areas with higher percentages of people earning lower incomes. They can then overlay that with a layer showing where low-income housing is offered with conditional styling. Now students can see why lower income households are on the outskirts of Denver, where housing is cheaper. They can also better understand the city’s plan to provide low-income housing in the downtown area, where many people work but can’t afford to live.
Students can then overlay parks, hospitals and schools to see which areas could use more amenities based on population and access to basic services. Using Map Mavin turns a multi-week project into a simple lab that takes a day or two. What started as an intimidating lesson into the complexities of GIS is simplified. Teachers don’t have to cover file formats, projections or base layers to give students a feel for how GIS works from a usability perspective. Even if a city doesn’t have GIS data available to the public, students can use our open data portal to download data directly into their account.
Map Mavin is an all in one solution for schools and colleges to get students in the door and signed up for GIS classes or certifications.
- That’s right folks, it’s technology time so let’s jump right in:Yep, you can even 3D print batteries!
A step towards commercially viable CO2 capture.
This solar panel collects energy from sunlight while converting water to hydrogen gas.
Passive cooling idea moves from the lab to production.
 The October 2018 temperature percentile departure map shows record warmth over pockets of Asia, Alaska and Australia, with a large swath of cooler than average temps over North America.
- The October 2018 NOAA Global Climate Report is out and (shocked face!) the warming trend of our planet continues. The average temperatures in the month were more than one and a half degrees (Fahrenheit) above their 20th Century averages–it was also the 406th month with temperatures over the 20th Century average and the second warmest October on record. Do you think the Trump admin will make any changes to their climate change policy with the resounding midterm defeat? We think not…
- In honor of the horrific day in 1941, December 7, 2018 is Pearl Harbor Remembrance Day, and in honor these fallen soldiers, our Google Search of the month was, “GIS and Pearl Harbor.” If you go through the results, you might find this map of Japanese Internment camps, one of the blackest marks against our country made by Melissa Gentry of Ball State University. While simple in its presentation, the statistics here drive home the dire message of this ill-informed decision during World War II.
- Last month we checked out the GIS resources of Grand Rapids, Michigan and this month we stay in the Midwest with a look at the second largest city in the state’s GIS resources, Saint Paul. And this month we introduce a new standardized format for this report as all GIS websites (at least in our opinion) should have the following links:
Saint Paul GIS website–https://www.stpaul.gov/departments/water-services/gis-map
Saint Paul GIS contacts–http://maps.saintpaulwater.com/contact.php
Saint Paul GIS web map–http://maps.saintpaulwater.com (must register first, strange…)
Saint Paul GIS map collections–none available
Saint Paul GIS direct downloads–none available
Brock Adam McCarty
Map Wizard
(720) 470-7988
brock@apollomapping.com
Do you have an area of interest that requires regularly updated imagery but you do not have time to check daily for this data?
Or perhaps you have a remote location that needs updated imagery but you cannot afford a new collection?
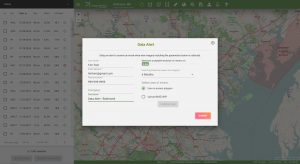
If either of these questions ring true, then you need to check our new Data Alert service on Image Hunter!
Data Alert lets you define an area of interest anywhere around the globe, the resolution your project requires and the number of months we should keep the alert active. Once this is set up, we check for new data over your area of interest every single day, and send you an email alert when we find coverage that meets your specifications.
We have a short YouTube video with directions to set up a Data Alert, check out the second video. We also have written directions for Data Alert here.
It’s that easy to find the data you need for all of your key projects.
If you would like to check out Data Alert, send us an email at sales@apollomapping.com or visit Image Hunter and click on the bell icon in the header to get started using this great service!