
 A new 92-cm nighttime Jilin-1 sample for our readers collected over Nantes, France on November 15, 2018! This image has been processed by Apollo Mapping for improved clarity and reduced stray light. (Image Credit: CG Satellite)
If our readers know anything about working with Apollo Mapping, it’s that we’re blunt and honest. And so yes, we 100% recognize the risk associated with nighttime tasking on Jilin-1, particularly in cloudy regions when you only get three attempts at a new collection with 20% or less cloud cover. So it makes us happy to announce new lower-priced nighttime-tasking for 92-cm color Jilin-1 satellite imagery!
The new cost is nearly 50% lower than just last year so that means significantly less financial risk for a new Jilin-1 nighttime imagery collection.
If you are interested in a price list with this new per square kilometer cost for nighttime satellite imagery tasking, send us an email to sales@apollomapping.com and we will get it right over to you!
In this monthly feature, we span the globe to examine Our Changing Landscape with a time series of medium-resolution PlanetScope satellite imagery. The PlanetScope constellation dates back to 2016 and is collecting hundreds of millions of square kilometers of 4-band 3-meter imagery daily! In last month’s edition of Our Changing Landscape we checked out flooding in a historic European city, and for February we travel across the Mediterranean with a look at the protests that rocked Algeria in 2019 with a focus on the capital, Algiers.
The PlanetScope Microsat Constellation
 Click on the image above to see an animation of 3-meter natural color PlanetScope imagery collected over Algiers, Algeria on February 24, 2018, February 24, 2019, March 1, 2019 and March 15, 2019. First a note about the images, without going into a plethora of detail, you will see two slightly different extents in the four dates here; that is due to the two processing techniques used on the raw images we received–apologies for the hassle. Upon close inspection, you can see protests in the main avenues of downtown Algiers if you look closely and know where to look ahead of time. And there are clearly a plethora of changes around the town, particularly in the ports. But what we are learning quickly is that PlanetScope imagery is an excellent resource when you know where to look and what you are looking for. Generally speaking, 3-meter imagery can determine the presence of a feature on the ground but it has a much harder time showing the condition of this feature on the ground. (Images Courtesy: © Planet 2020)
PlanetScope is a constellations of more than 150 microsats referred to individually as Doves. Each Dove is able to collect up to 20,000 square kilometers (sq km) per day of 3-meter (m) 4-band multispectral (i.e. blue, green, red and near-infrared [NIR]) imagery. Across the constellation, PlanetScope is archiving more than 200 million sq km of medium-resolution imagery a day, making it the go to source for daily imagery over most locations. This massive archive dates back to 2016, offering the most complete and continuous record of spatial data on the planet since the start of the constellation’s ongoing launch schedule. Collecting 3-meter multispectral imagery is the equivalent of ‘high-resolution’ multispectral data imaged by a 75-centimer (cm) satellite (as this satellite would feature 75-cm panchromatic and 3-m multispectral), making PlanetScope an extremely competitively priced option at just $1.80 per sq km. With well registered images and nearly daily collections of most locations, PlanetScope is the ideal imagery source for this current-events focused series, Our Changing Landscape.
2019 Political Protests in Algiers, Algeria
The massive North African nation of Algeria had been controlled by President Abdelaziz Bouteflika since 1999, however, coinciding roughly with the Arab Spring, protests over massive corruption and his regime in general sprang up in 2010, and slowly spread from Algiers. In 2019, these protests reached a crescendo when Bouteflika announced his candidacy for the next round of presidential elections on February 10th. A protest in Algiers on February 22nd drew an estimated crowd of 800,000 while more large-scale protests followed on the 24th (which is one of the dates we include in our PlanetScope animation here). March saw continued turmoil with a 3-million person protest on March 1st; only to be followed by another sprawling protest on Match 15th–both of these dates are also included in this month’s animation. While it is not the point of this article to recount the entirety of the 2019 Algerian protests, the months since March have seen Bouteflika resign from office, the Army’s general take power and then declare December elections which were won by former Prime Minister Abdelmadjid Tebboune with 58% of the vote. It appears that the protests in Algeria have quieted since Tebboune took office and declare a war against corruption, but the powder keg could easily be ignited again if he does not live up to his anti-corruption stance. Without further delay, let’s turn our attention to the 3-meter PlanetScope archive which captured many of Algeria’s largest protests of 2019.
If you would like to find out more about using 3-meter PlanetScope imagery for your academic studies, engineering projects or any landscape analysis, let us know at sales@apollomapping.com or (303) 993-3863.
 (Image Courtesy: DigitalGlobe. Processed by Apollo Mapping for improved color accuracy and clarity.)
We love maps.
We love imagery.
We love work breaks.
We hope you like them as well!
February is here so that means Spring is right around the corner, yay!! So it is definitely time for a celebration work break–but before you head outside or wherever you might head, check out this 50-centimeter WorldView-2 image of the Naadam Festival in Ulaanbaatar, Mongolia. Naadam can trace its roots back to public sporting events where Mongol warriors were chosen from the top competitors in archery, horse racing and wrestling. During the 1920s, the Naadam Festival became a national holiday which celebrated Mongolian independence from China. Today, the three-day event is held from July 11th to the 13th at the National Sports Stadium in Ulaanbaatar; and was formally recognized by UNESCO for its cultural significance. While this WorldView-2 image was collected on July 14, 2018 which is a day after the event ended, you can still see much of the infrastructure from the event on the stadium grounds. Anyone up for a mid-summer trip to Mongolia next year?!
Have a great rest of your workday!
When will taking a flight in space be as common place as is hopping on a plane for a long weekend vacation? What looks like pipe dreams now will someday be the norm. Kids will grow up and have a hard time imagining a world without daily spaceflights. Private companies are muscling their way into this ever growing field. Exodus Space Corp has just unveiled its plans for commercial space flights. The startup has kept its plans close to the chest until now.
The AstroClipper is designed to carry cargo and crew into space, if it can pass safety requirements for a crewed spacecraft. It harkens back to the Space Shuttle with its plane-like takeoff and landing. It uses a booster to get out of Earth’s atmosphere that it sheds to create more junk to burn up in the atmosphere or liter the ocean.
 The NGC 5353/4 galaxy group obscured by trails of reflected light from the Starlink satellites. (Photo Credit: Victoria Girgis/Lowell Observatory)
Exodus plans to show off the AstroClipper in 2022 in a technology demonstration that will keep it inside Earth’s atmosphere. Eventually, it will punch into space with the goal of carrying passengers and cargo by the 2030s. They’ve brought on industry leaders to join the team and will look for additional funding as they move through the phases of getting their spacecraft into space.
While we mull over the possibility of space flight as common place there is the question of how common light pollution will be in our future. More satellites are going up than ever before. SpaceX is launching 12,000 Starlink Internet satellites, each the size of a table. What no one anticipated is how bright the satellites would be. After their first launch of 60 satellites, in the early morning, a train of lights was visible overhead. It was so bright as to interfere with sensitive telescopes, like the Lowell Observatory in Arizona. They provide the disclaimer that they’ll be less obstructive as they reach their final altitude and spread apart, but this is the level of disturbance from 60 of the satellites, imagine 12,000 in orbit.
Starlink uses radio-based antennas, which could cause significant interference to radio telescopes, including the Vera Rubin Observatory set to map the universe in detail in 2022. Another controversy cropped up soon after launch when the European Space Agency (ESA) announced that their Aeolus satellite had to perform evasive maneuvers to avoid collision with a Starlink satellite.
It reeks of half-assed planning and little consideration for the astronomical community as a whole. In their grab for dominance in the new age of hyper-fast internet, SpaceX is willing to trample on whomever’s in their way. The US government seems willing to forego precautionary tests to avoid conflicts in the interest of making coin. While they spin their new constellation as “Internet for All,” its purpose is to provide banks with instant trade access and fund Elon Musk’s Mars colonization efforts.
How long until our night sky is shining back at us, trapping us inside a prison of our own making?
Do you have the need for regularly updated images of locations around the world?
Perhaps you need imagery to integrate with an OEM solution you are developing?
Or maybe your organization uses large amounts of high-resolution imagery each year, and you are seeking a low-cost option for this data?
If you answered yes to any or all of these questions, then the solution you are looking for is Maxar’s SecureWatch (formerly called Global Basemap or GBM).
With SecureWatch, you have access to millions of square kilometers of streamed imagery with low cloud-cover and off-nadir angles. This data is accessible in web-mapping services and in an online viewer. Perhaps the most important feature of SecureWatch are the regular streaming updates you can receive as out-dated imagery is often of little or no use to our valued clients.
And if the SecureWatch streaming database lacks the coverage you need, Premium users are now able to download any image from the entire Maxar archive in a wide variety of formats!
 The available Maxar SecureWatch imagery over China and Russia by location and with the most recent coverage date indicated with varying colors. In the vast majority of locations, there are multiple imagery dates available.
February 2020 Product Update
If you are a regular reader of this article series, you might notice a new name; but fear not, it is literally just a name change to align two similar Maxar product offerings. The only change you might notice are a few additional ancillary data layers and analytic techniques as well as some new product URLs. If you have any questions about this name change, feel free to email us at sales@apollomapping.com!
In November, SecureWatch pricing was revised so that it’s more flexible with data buckets sold in gigabyte (GB) increments. The minimum order has not changed but now you are able to purchase the exact number of GBs you might need in a year as opposed to fixed increments. Further, a Streaming only model was added with pricing based on the number of users. Send us an email at sales@apollomapping.com to find out more about these changes!
Last month we checked out the SecureWatch coverage in Central America, and for the February update we travel to the other side of the world with a focus on China and Russia. Sure you do see lots of color other than the blue (i.e. imagery less than a year old) but this is a massive region that tends to be cloudier than most so with this in mind the coverage is actually quite robust. And then when you look a bit closer at the map, particular in China, you will see that the fastest growing region along the east coast of the country is covered with data less than a year old. Here is a more detailed summary of the SecureWatch coverage over China and Russia:
- China and Russia SecureWatch Coverage By Year
- Less than 1 year (yr) old–16,839,844 sq km, 63.85% coverage of China and Russia
- 1 to 2 yr old–18,848,757 sq km, 71.47% coverage
- 2 to 3 yr old–18,660,014 sq km, 70.75% coverage
- 3 to 4 yr old–19,426,966 sq km, 73.66% coverage
- 4 yr old and greater–23,182,165 sq km, 87.90% coverage
- Total coverage–96,957,746 sq km
- Total (approximate) area considered–26,374,517.9 sq km
SecureWatch Product Specifications
- Accessible Geographic Regions: global (unless geo-fencing specifically requested by client)
- Maximum Imagery Resolution: 50-centimeters through WMS and WCS; 30-cm for other delivery mechanisms
- Data Sources: primary = WorldView-2/3/4 and GeoEye-1; secondary = QuickBird, IKONOS, WorldView-1 and aerial
- Imagery Holdback Period For Updates: 90 day holdback for SecureWatch Standard; 2 day holdback for SecureWatch Premium; updates are to limited portions of the database, not the entire database
- Data Accuracy: at least 8.5-meter CE90%
- Database Access: OGC streaming services (i.e. WMS, WMST, WCS and WFS), Google Earth streaming services (i.e. EarthService), ArcGIS plugin (i.e. ImageConnect), offline database/downloads and online portal
- Annual Downloads & Streaming Limits: Standard = 4 gigabytes (GB) and up, annual license for downloads; Premium = 2 GB and up, perpetual license for downloads
- Maximum Concurrent Users: unlimited!
- Data Layers: Standard = standard image strips, +Vivid country-wide mosaics, and OSM and Google Maps vectors; Premium = standard, +Daily and First Look image strips, +Metro, +Vivid and Landsat mosaics, and OSM and Google Maps vectors
- Pricing Model: Standard and Premium tiered annual pricing models with increasing download and streaming limits; also a Streaming only annual model based on seats
SecureWatch Direct Archive Download Specifications
Premium SecureWatch users are able to download high-resolution satellite imagery from the entire Maxar archive in a variety of formats. Here are some details on this exciting offering:
- Available Data Sources: entire commercial archives of GeoEye-1, IKONOS, QuickBird and WorldView-1/2/3/4 (SWIR included too!)
- Annual Downloads Limits: 2 GB and up; metering combined with streaming usage
- Product License: internal use and perpetual
- Product Resolution: maximum resolution for each satellite
- Product Formats: all standard types are offered including, orthoready, stereo, basic, 4-band bundle, 8-band bundle, ACOMP on, etc.
For more information on the pricing and coverage available in Maxar’s SecureWatch, you can reach our sales team anytime at sales@apollomapping.com or during typical American business hours at (303) 993-3863.
Over the many years, Apollo Mapping has helped a countless number of academics and professors source the proper imagery for their grant-funded research budgets. Whether it is 8-band multispectral and short-wave infrared (SWIR) WorldView-3 satellite imagery for land-use land-cover mapping; 50-cm digital elevation models (DEMs) for archeological research; or synthetic aperture radar (SAR) for monitoring weapons of mass destruction (WMDs) in remote regions, we have decades of expertise finding the correct geospatial data source for your next project.
 A screen-grab of the 2004 IKONOS imagery used in Kenny’s research as seen in Image Hunter.
In this (NEW!) regular series, In Focus, we scour the Internet to find former Apollo Mapping clients who used our satellite imagery and/or DEMs in their academic research publication. So without further ado, here is our first feature article.
Article Title, Author & Academic Institution: Estimation of south cascade glacier summer mass balance derived from high resolution satellite imagery in 2004 and 2008, Washington, Ray Kenny, Fort Lewis College
Scientific Discipline(s): geology, GIS, glaciology, remote sensing
Project Description: Field-collected mass balance measurements of South Cascade Glacier are compared to high-resolution satellite imagery to allow for rapid and accurate estimation of mass balance from subsequent years of similar imagery.
Commercial Satellite Imagery Datasets Used: IKONOS and panchromatic-only WorldView-1
Are you a former Apollo Mapping academic client who want us to feature your research in a future edition of In Focus? If so, send us an email at sales@apollomapping.com, we would be happy to hear from you again!

 From the Big Apple to Bend, Oregon, Vricon brings the data.
In November, we brought you a snapshot of Vricon’s 3D digital elevation model of Bangkok, a famous world city. This month we shift our focus to the Western Hemisphere, and specifically to urban areas within the United States.
Vricon has been working hard to produce data that hits closer to home. Indeed, their data may actually cover your home and office as they have produced over 2.8 million square kilometers (sq km) of the United States, including over 1,000 cities from the East Coast to the West Coast. These municipalities can be categorized as cities, towns and even boroughs. Indeed, over the past three months, Vricon has produced over 1.7 million sq km of new 3D data worldwide.
Vricon’s product suite includes 50-centimeter digital surface models (DSMs) and digital terrain models (DTMs), all of which are important for engineering, urban planning, design, environmental research, flood analysis and more. For example, let’s say that you work for an engineering firm that is managing various projects across America and flying LIDAR or collecting high-resolution airborne imagery to support these projects is beyond your budget. You can’t afford to fly or drive to each location on a moment’s notice. You can, however, use Vricon’s highly affordable and readily available 3D models and DEMs to perform a virtual site analysis, and thus save two precious resources at once–both time and money.
 Vricon’s CitySuite Coverage–can you find your city?
Given that everyone loves lists, we thought it might be fun to compare Vricon’s currently available 3D data to the largest cities in the US, courtesy the U.S. Census Bureau. Topping the list are New York, Los Angeles, Chicago, Houston and Phoenix, and Vricon has built them all. Check! We also looked at some of the fastest growing cities — Boise, Dallas, Greeley and The Villages — and we are pleased to report that Vricon has these covered, too. Check and check!
Because Vricon’s technology uses 1,000’s of pixels over a single point on the ground, they can offer the most accurate representation of your city, while keeping down costs. Check out Image Hunter to locate Vricon’s coverage of your city, or send us an email at sales@apollomapping.com for more information about this product suite.
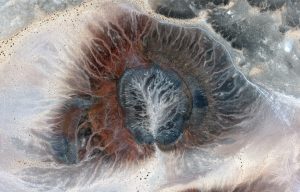
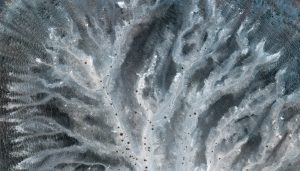
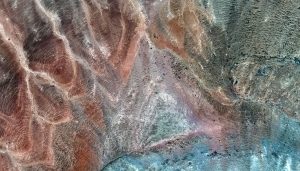

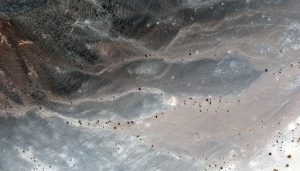 Al Wahbah crater is located in west-central Saudi Arabia about 200 kilometers (km, or ~124 miles) from the Red Sea. Once thought to be the result of a meteorite strike, it is now thought to be the result of an enormous eruption of molten magma heated steam. The images featured here are of a crater located about 25 km (15.5 miles) southwest of Al Wahbah. The first image is a resampled 2-m view of the entire crater, while the other four images are featured at full 30-cm resolution. The colors depicted in these WorldView-3 images are absolutely insane–particularly the blue tones. These 30-cm WorldView-3 images were collected on August 16, 2015 and have been enhanced by Apollo Mapping for improved colors and clarity. (Images Courtesy: Maxar)
Every time we look at WorldView-3 and WorldView-4 (WV3/4) imagery, we are blown away. And we hope you are equally impressed with the data! Last month’s edition of this regular piece found us deep in an Asian urban landscape, and for the February 30-cm Color WorldView-3/4 Image of the Month we travel into the countryside of Saudi Arabia with a look at literally the exact opposite landscape, a remote desert crater.
PLEASE NOTE: Effective May 2016, WorldView-3/4 prices dropped again! Are you interested in finding out more about these price drops? If so, send us an email at sales@apollomapping.com.
WorldView-3 launched in late 2014 and WorldView-4 launched in late 2016; taken together they are the most advanced satellite constellation the commercial marketplace has ever had access to. Here are a few of the features that really set these satellites apart from the competition:
- Improved Resolution
- Higher resolution means you can see more detail in WV3/4 imagery.
- Data collected at nadir will have 31-centimeter (cm) panchromatic, 1.24-meter (m) visible and near infrared, 3.7-m SWIR (WV3 only) and 30-m CAVIS (WV3 only) bands.
- At 20 degrees off-nadir, the resolution is 34-cm panchromatic, 1.38-m visible and near infrared and 4.1-m shortwave infrared.
- Additional Spectral Bands
- If spectral analysis is part of your project, then no other satellite can match WV3 with its: 8 bands of visible and near-infrared data; and 8 shortwave infrared bands which are crucial for geological studies.
- Better Positional Accuracy
- With accuracies of 3.5-m CE90% or better (without ground control even!), WV3/4 has no rivals for its enhanced positional accuracy.
- Daily Revisits
- At 40 degrees latitude, WV3 is able to image every location daily with 1-meter or better resolution and then every 4.5 days at 34-cm resolution or better.
- WV4 is no longer collecting new imagery.
- Increased Collection Capacity
- WV3/4 feature 13.1-km swath widths (at nadir) with the ability to collect up to 680,000 square kilometer (sq km) of high-resolution data per day per satellite (though WV4 is dead now).
- Improved control movement gyros translate into larger maximum contiguous collection areas per pass, with up to ~7,500 sq km of mono imagery and ~3,000 sq km of stereo possible.
If you are interested in WorldView-3 and/or WorldView-4 imagery for your next project, please let us know by phone, 303-993-3863, or by email, sales@apollomapping.com.
You can also find more WV3 samples and technical information on our website here and then WV4 samples and information can be found here.