
We’re living in strange times. Inside our homes, we’re sending emails in pajamas and asking ourselves if we really need to go to the store today, or can it wait. From our couch view, if we’re one of the lucky ones, we’re peering out the window, looking for visceral signs of the pandemic that might already lurk in our homes.
 When can we go outside again? There is a squirrel that needs chasing. (Credit: keithfoust from Pixabay)
At home, life is boring, but turn to social media or your local grocery store and find the ways Americans are rallying together or falling woefully short. It’s in times like these that I wonder at American patriotism. These colors don’t run, but they’ll fight an elderly woman for toilet paper. Freedom isn’t free, and neither is hoarded hand sanitizer sold for a premium to a desperate population. Is patriotism just a synonym for die hard individualism? Is America the emperor wearing a new coat of red, white and blue that exists only in our minds and how does that look to other countries that watch us strutting our stuff only to realize we look worse for the wear in our invisible attire?
I don’t have an answer to these questions. Instead, I want to showcase the ways people are helping in a crisis, not just because we live on the same scrap of land we took from someone else, but because of our shared humanity and empathy.
Small businesses are getting creative, offering delivery to your door or curbside pickup. My favorite mushroom farm in Missouri is now delivering across the country. It’s the first time in years I’ve been able to get them. Check out your local Craigslist, Facebook marketplace or Nextdoor, you’ll be surprised to find local stores you didn’t know existed offering food you can’t get in the grocery store. Local distilleries and brewers are offering delivery and coffee shops have curbside pickup.
We’ve all seen the shortage of N95 masks for hospital workers, but it’s not just hospital workers that need masks. First responders, from fire fighters to 5,000 New York National Guard soldiers, need masks. So do pediatric offices, retirement homes, end-of-life care facilities, internal medicine offices, homeless shelters for veterans, food pantries, regional and rural hospitals. Just check out this site to see who needs mask in your state alone. People are rallying to help essential service employees by making masks, because something is most definitely better than nothing. So, bust out that sewing machine and join the #MillionMaskChallenge. Not a sewer? Then support a sewer by donating to a local group that needs supplies.
Let’s be better humans. Don’t be that guy that takes bottled water from a wheelchair user in the store parking lot. Don’t purposefully cough on food or lick deodorant in stores. Don’t be that guy that’s willing to kill millions of Americans because the economy is more important than human lives. Let’s not be that asshole today.
Every time we look at WorldView-3 and WorldView-4 (WV3/4) imagery, we are blown away. And we hope you are equally impressed with the data! Last month we checked out one of the most visited locations in Europe, and for the April 30-cm Color WorldView-3/4 Image of the Month we head to the states with a look at an eerie graveyard for old wooden ships, Mallows Bay Park in Maryland.
PLEASE NOTE: Effective May 2016, WorldView-3/4 prices dropped again! Are you interested in finding out more about these price drops? If so, send us an email at sales@apollomapping.com.
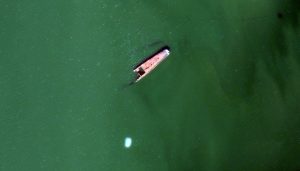
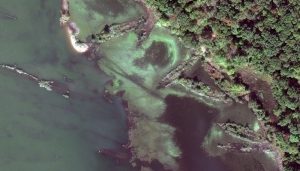 Declared a National Marine Sanctuary in 2019, Mallows Bay Park is located along the Potomac River in Maryland where over 100 World War I ships were burnt and then sank in the shallow waters. Many of these ship skeletons have sunk back into the river and the majority of those that remain exposed above the waterline are covered with bushes and trees. These 30-cm WorldView-3 images were collected on October 19, 2019 and have been enhanced by Apollo Mapping for improved colors and clarity. (Images Courtesy: Maxar)
WorldView-3 launched in late 2014 and WorldView-4 launched in late 2016; taken together they are the most advanced satellite constellation the commercial marketplace has ever had access to. Here are a few of the features that really set these satellites apart from the competition:
- Improved Resolution
- Higher resolution means you can see more detail in WV3/4 imagery.
- Data collected at nadir will have 31-centimeter (cm) panchromatic, 1.24-meter (m) visible and near infrared, 3.7-m SWIR (WV3 only) and 30-m CAVIS (WV3 only) bands.
- At 20 degrees off-nadir, the resolution is 34-cm panchromatic, 1.38-m visible and near infrared and 4.1-m shortwave infrared.
- Additional Spectral Bands
- If spectral analysis is part of your project, then no other satellite can match WV3 with its: 8 bands of visible and near-infrared data; and 8 shortwave infrared bands which are crucial for geological studies.
- Better Positional Accuracy
- With accuracies of 3.5-m CE90% or better (without ground control even!), WV3/4 has no rivals for its enhanced positional accuracy.
- Daily Revisits
- At 40 degrees latitude, WV3 is able to image every location daily with 1-meter or better resolution and then every 4.5 days at 34-cm resolution or better.
- WV4 is no longer collecting new imagery.
- Increased Collection Capacity
- WV3/4 feature 13.1-km swath widths (at nadir) with the ability to collect up to 680,000 square kilometer (sq km) of high-resolution data per day per satellite (though WV4 is dead now).
- Improved control movement gyros translate into larger maximum contiguous collection areas per pass, with up to ~7,500 sq km of mono imagery and ~3,000 sq km of stereo possible.
If you are interested in WorldView-3 and/or WorldView-4 imagery for your next project, please let us know by phone, 303-993-3863, or by email, sales@apollomapping.com.
You can also find more WV3 samples and technical information on our website here and then WV4 samples and information can be found here.
Do you have an area of interest that requires regularly updated imagery but you do not have time to check daily for this data?
Or perhaps you have a remote location that needs updated imagery but you cannot afford a new collection?

If either of these questions ring true, then you need to check our Data Alert service on Image Hunter!
Data Alert lets you define an area of interest anywhere around the globe, the resolution your project requires and the number of months we should keep the alert active. Once this is set up, we check for new data over your area of interest every single day, and send you an email alert when we find coverage that meets your specifications.
We have a short YouTube video with directions to set up a Data Alert, check out the last video. We also have written directions for Data Alert here.
It’s that easy to find the data you need for all of your key projects.
If you would like to check out Data Alert, send us an email at sales@apollomapping.com or visit Image Hunter and click on the bell icon in the header to get started using this great service!
Times of stress are also times of significant innovation. Economic and bureaucratic barriers are brought down in favor of rapid solutions. It’s too early to tell what breakthroughs will come of this, but technology is playing an enormous part in our search for solutions.
Artificial intelligence is beefing up its skills to find a drug to combat the coronavirus, COVID-19. Pulling from decades of protein structure research, Google’s DeepMind set to work on puzzling out the most likely proteins that could make up the virus, then made their findings available to the public. BenevolentAI is compiling data on viable drug treatments to combat the virus. They use neural networks and 3D models to better understand the molecular structure of proteins.
 Let’s pretend this is a protein structure instead of DNA. (Credit: PublicDomainPictures from Pixabay)
We all know there’s a woeful lack of testing and the turn-around time on a result can take weeks, unless you have money and a name in lights. Another AI, Infervision, is helping diagnose viral pneumonia cases with a single CT chest scan. Reducing the time to diagnose and prioritize patients is a life saver. AI is also used in tracking and forecasting by companies like BlueDot. Understanding where the virus is moving and how is essential to providing a fast and accurate response by governments and sending supplies to the places that need it the most.
Emphasis is also on relieving the burden in the healthcare system. They need supplies, and personnel to save lives, but there’s the logistical side as well. With busy hospitals, especially in the cluster that is our healthcare system, dealing with logistics is overwhelming and increases person-to-person contact. Blockchain platforms are working to streamline the intake system and keep healthcare workers safe.
On the equipment side, Sonovia is developing antimicrobial textiles for healthcare workers. This isn’t just any fabric, it uses a nano-coating that actively destroys bacteria instead of only providing a physical barrier. Robots are chipping in, cleaning and sterilizing equipment so humans don’t come in contact with compromised surfaces and it also frees up their time for other tasks. Dyson developed a new ventilator in ten days that is quick to manufacture at a high volume.
It’s amazing what we can do in a crisis, even as we see some aspects lag behind others are stepping up to fill the gap as best they can. Only time will tell how this phase in our history will play out and how it defines us.
 This map shows the areas imaged by the WorldView-2/3 constellation from June 1 to August 31, 2019 over Indonesia and the Philippines. Please note that in many instances, multiple images were collected over the same area which is difficult to portray on this static map.
In this monthly piece, we give our readers a sense of the high-resolution imagery coverage collected over a geography during a specified window. To do this, we pick a high-resolution satellite constellation, a defined time period and area of interest, then report key statistics on the total amount of imagery collected in square kilometers (sq km). Without further delay, let’s jump into our analysis.
Graphic Region of Interest: Indonesia and Philippines plus off-shore islands
Land Mass Covered: 2,180,911.0 sq km
Time Period: June 1 to August 31, 2019
High-Resolution Satellite Constellation: WorldView-2/3
WorldView-2/3 Constellation Imaging Statistics–Indonesia and Philippines
Total Area Collected: 3,015,574.5 sq km; 16,389.0 sq km per satellite/per day
Area Collected @ 20% or Less Clouds & 30 Degrees or Less Off-Nadir: 542,800.4 sq km; 2,950.0 sq km per satellite/per day; 18.0% of total

Cricket’s Chirp is created for Apollo Mapping by Ron Ruelle, a Boulder, Colorado based cartoonist, lllustrator and teacher. No animals are harmed in the creation of these comics, but Ron sometimes breaks a pencil in frustration. You can see more of his work at www.ronruelle.com
NASA’s Discovery Program aims to further our understanding of the solar system and its implications for our own planet. Through this program, NASA awarded four missions $3 million each to continue nine months of research and development. Next year, NASA will select up to two missions for further funding and development to get them off the ground.
 This composite image of Venus is 30 years old, the last time a probe ventured to Venus. (Credit: NASA/JPL-Caltech)
Venus is getting attention from two of the planned missions. Venus may not seem like an obvious choice, when Mars–a planet that looks like our own and with less brain-frying radiation–is within reach. However, Venus may have looked very similar to Earth in its distant past, with water and a strong magnetosphere, but the planet changed and descended into a killer greenhouse effect. Venus rotates once every 243 Earth-days and in the opposite direction of all other planets in the solar system. Some researchers postulate that a giant asteroid crashed into the fledgling planet and threw it off course while others point to tidal locking with the Sun. Was it a massive impact or the natural progression of a planet lacking the specific ingredients to maintain an atmosphere and harbor life?
These two missions aim to find out. The first, called DAVINCI+ (Deep Atmosphere Venus Investigation of Noble gases, Chemistry, and Imaging Plus)–that’s a mouthful–will send an instrument through the noxious gasses and toxic atmosphere, where it will gather information on the terrestrial planet’s composition and formation.
VERITAS (Venus Emissivity, Radio Science, InSAR, Topography, and Spectroscopy)–enough with the acronyms already–is the second Venus mission. This one is an orbiter with a synthetic aperture radar that can see through the deadly clouds to the planet’s surface, where it will map elevation looking for evidence of plate tectonics and active volcanism. Researchers know Venus saw intense volcanic activity in the past but are unclear if the domes continue to spew. There is some speculation that volcanoes, especially Venus’ tallest volcano, Maat Mons, are still active, but we lack strong evidence to back up this theory. VERITAS will answer these questions and glean information on the geological composition of Venus from infrared emissions.
The Io Volcano Observer (IVO) mission will fly by Jupiter’s volatile moon Io. Constantly under pressure from Jupiter’s gravity, it’s covered in active volcanoes and researchers want a closer look. The Trident mission is aiming for Triton, the remote moon of Neptune. Its atmosphere has potential for interesting characteristics, like organic snow and a subsurface ocean. All these missions have great potential to unveil mysteries of our solar system and planet formation. May the best mission win!

This month in Free for All we address one of the most talked-about subjects of the new decade–the coronavirus outbreak (COVID-19, formerly referred to as 2019-nCoV). The source of the outbreak has been tracked to the Huanan Seafood Wholesale Market in Wuhan, China where wildlife was sold and consumed. Although it appears that the virus originated in bats, it is unclear if it was transmitted directly from bats to humans or via another animal host. Currently (as of 2/19/2020), there are 75,727 confirmed cases globally, with 2,129 total deaths and 16,526 reported recoveries (according to this dashboard created by John Hopkins University with data compiled from WHO, CDC, NHC, ECDC and DXY). While the health risk in the US is relatively low, global concern is mounting as the virus has already met two of the factors in the criteria for a pandemic (i.e. illness resulting in death and person-to-person propagation, CDC).
The purpose of this article is to provide our readers with reliable and up-to-date sources for information about the outbreak. Rather than getting updates from media outlets, we recommend visiting government agency websites such as the World Health Organization, the Center for Disease Control and Prevention and the European Centre for Disease Prevention and Control. Not only can you find the most recent statistics here, but you can also learn how to protect yourself from coronavirus, how it spreads and common symptoms. In addition, you can check out current risk assessments and answer many of your questions on the various Q & A pages.


If you are more of a visual learner, we recommend that you check out the StoryMap created by Esri. The StoryMap contains maps, diagrams and figures that are updated as data is compiled in the dashboard made by researchers at John Hopkins University. It also contains a short history of the virus with details on how it has spread. It even includes data not directly related to the virus, such as quarantine figures and different flight paths leaving Wuhan. The StoryMap wraps up with a discussion of containment efforts as well as potential future outbreaks. For a quicker and purely visual exploration of coronavirus, we recommend going directly to any of these dashboards or visiting the Metabiota Epidemic Tracker for COVID-19.
In this article I am not intending to instill fear about coronavirus, rather quite the opposite. If we are smart about travel and hygiene and stay well informed, then there is little to worry about. Unfortunately in the decades to come we will see more deadly virus outbreaks, but the most important thing we can do is stay calm and aware. Thoughts and prayers go out to all those affected.
Jake Zatz
Social Media Guru