

Imagery from SPOT satellites 1 through 5 has been offline for a year or so, languishing on a server. Now the French Space Agency is making them available for free on the SPOT World Heritage website. The archive covers the full life span of the five satellites, from 1986 to 2015. SPOT 1-5 were some of the few satellites imaging at that time, and so they offer a wealth of information for studying our changing Earth. The resolution varies from 20-meters to 2.5-meters. Imagery is delivered in level L1A format with radiometric corrections applied but without geometric corrections. You can check out all the specifications here as well as the imagery license here.

We love maps.
We love imagery.
We love work breaks.
We hope you like them as well!
Summer is in full affect here in the United States and the Western Hemisphere so take advantage of these warm months by getting outside for a quick walk around the block! But before you head out on that work break, take a few seconds to gander this 30-centimeter WorldView-3 image collected over Grant Park in Chicago, Illinois on July 30, 2019. And why is this date important, well as you can see in the images, the preparations for the 2019 edition of Lollapalooza were nearing completion. This annual, 4-day music festival started touring the United States in 1991 (with a break from 1997 to 2003) and since 2005 it has called Chicago’s Grant Park home. The last in-person edition of Lollapalooza was held from August 1 to the 4, 2019 and was frequented by some 400,000 visitors. After moving to an online platform last year during the COVID-19 crisis, Lollapalooza is set to move back to an in-person event this year; and it will require either a negative COVID test 24 hours prior to the event or a valid vaccination card. Seems like a little jab or two is well worth it for the finer parts of life again–go get vaccinated folks!
Have a great rest of your workday!
(Image Courtesy: DigitalGlobe. Processed by Apollo Mapping for improved color accuracy and clarity.)
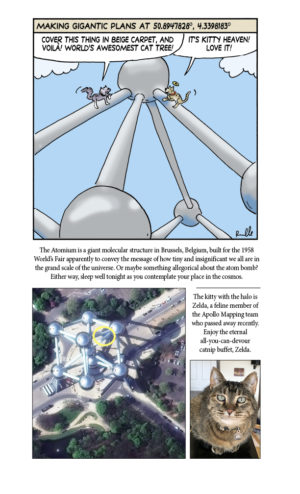
Cricket’s Chirp is created for Apollo Mapping by Ron Ruelle, a Boulder, Colorado based cartoonist, lllustrator and teacher. No animals are harmed in the creation of these comics, but Ron sometimes breaks a pencil in frustration. You can see more of his work at www.ronruelle.com
 This map shows the areas imaged by the Pléiades 1 constellation from January 1, 2021 to March 31, 2021 over South America. Please note that in many instances, multiple images were collected over the same area which is difficult to portray on this static map.
In this monthly piece, we give our readers a sense of the high-resolution imagery coverage collected over a geography during a specified window. To do this, we pick a high-resolution satellite constellation, a defined time period and area of interest, then report key statistics on the total amount of imagery collected in square kilometers (sq km). Without further delay, let’s jump into our analysis.
Graphic Region of Interest: South America plus off-shore islands
Land Mass Covered: 17,750,994.2 sq km
Time Period: January 1, 2021 to March 31, 2021
High-Resolution Satellite Constellation: Pléiades 1A + 1B
Pléiades 1 Constellation Imaging Statistics–South America
Total Area Collected: 6,464,736.2 sq km; 35,915.2 sq km per satellite/per day
Area Collected @ 20% or Less Clouds & 30 Degrees or Less Off-Nadir: 2,838,541.3 sq km; 15,769.7 sq km per satellite/per day; 43.91% of total
¡Bienvenidos a Julio! Nosotros en Apollo Mapping estamos gustosos de tenerlos otro mes aquí en los resúmenes españoles del mes de Julio.
 Haga clic en la imagen de arriba para ver vistas animadas que comparan DEM AW3D de 2.5-m y 5-m en Boston, Massachusetts (C)NTT DATA, RESTEC, Included JAXA
Producto destacado–2.5–metro / 5–metro DEM estándar AW3D
En conjunto con nuestro valorado compañero, NTT Data, estamos orgullosos de poder ofrecer productos de DEM estándares de 2.5 metros/5 metros AW3D, estos productos vienen de un archivo que cubre 80% del mundo. Como algo adicional, puedes buscar AW3D estándar en el Cazador de Imágenes. Esto hace que el DEM sea rápido para consultar, ordenar, y entregar.
Producido de un archivo de más de 3 millones de imágenes estéreo ALO, el estándar AW3D puede ser entregado como una imagen modelo de la superficie digital o como un modelo de terreno digital a 2.5-m y 5-m de resolución. Con un promedio de entrega de 2 semanas o menos para la imagen modelo de la superficie digital o 4 semanas para el modelo de terreno digital. Un AW3D es una excelente elección para los proyectos regionales que requieren cambios rápidos en alta resolución de datos DEM.
Aqui esta un resumen de la AW3D estándar especificaciones cuál debería ser actualizado cuando la prueba se completa en el 2.5-m ofreciendo DEM:
Resolución:2.5-m (por menos precio también se ofrece de 5-m)
Dia que se usó la imagen ALOS: del 2006 hasta el 2011
Precisión Horizontal y Vertical: 5-m LC90 y LE90, o mejor
Niveles de Producto:nivel 1 DSM (datos brutos); nivel 2 DSM (huecos llenos); nivel 2 DSM (estándar); nivel 3 DTM
Tiempo promedio de entrega: 2 a 4 semanas
Si tiene alguna solicitud de precios o preguntas adicionales sobre los DEM estándar de AW3D, mandenos un correo electrónico a sales@apollomapping.com.
Este mapa enseña el área mostrada por Pléiades 1 de la constelación de Enero 1, 2021 hasta Marzo 31, 2020 sobre Sudamérica. Por favor sepa que algunas imágenes fueron tomadas sobre la misma área , pero es difícil enseñar esto con el mapa estático.High-Resolution Imagery Collections–Pléiades 1–Sudamérica, Enero y Marzo 2021
En este artículo mensual, le damos a nuestros lectores una imagen de alta-resolución recogida de la geografía durante una ventana de tiempo muy específica. Para hacer esto, nosotros escogimos un satélite de constelación de alta resolución, un tiempo definido y área de interés, y luego reportamos estadísticas importantes de la cantidad de imágenes recogidas por kilómetros cuadrados. Sin más espera debemos ver nuestro análisis.
Región Graphica de Interés: Sudamérica más Islas fuera de la tierra
Masa de Tierra Cubierta: 17,750,994.2 sq km
Periodo de Tiempo: Enero 1, 2021 hasta Marzo 31, 2021
Alta Resolución de Constelación de Satélites: Pléiades 1A + 1B
Pléiades 1 Constelación de Imágenes Estáticas–Sudamérica
Área Total Recogida- 6,464,736.2 km2; 35,915.2 km2 por satélite/por dia
Area recogida @ 20% o menos nubes y 30 grados o menos-nadir: 2,838,541.3 km2; 15,769.7 km2 por satélite/por dia; 43.91% del total
Fernando Gutierrez

Do you have an area of interest that requires regularly updated imagery but you do not have time to check daily for this data?
Or perhaps you have a remote location that needs updated imagery but you cannot afford a new collection?
If either of these questions ring true, then you need to check our Data Alert service on Image Hunter!
Data Alert lets you define an area of interest anywhere around the globe, the resolution your project requires and the number of months we should keep the alert active. Once this is set up, we check for new data over your area of interest every single day, and send you an email alert when we find coverage that meets your specifications.
We have a short YouTube video with directions to set up a Data Alert, check out the last video. We also have written directions for Data Alert here.
It’s that easy to find the data you need for all of your key projects.
If you would like to check out Data Alert, visit Image Hunter and click on the bell icon in the header to get started using this great service!
 This map shows the areas imaged by the WorldView-2/3 constellation from January 1, 2021 to March 31, 2021 over South America. Please note that in many instances, multiple images were collected over the same area which is difficult to portray on this static map.
In this monthly piece, we give our readers a sense of the high-resolution imagery coverage collected over a geography during a specified window. To do this, we pick a high-resolution satellite constellation, a defined time period and area of interest, then report key statistics on the total amount of imagery collected in square kilometers (sq km). Without further delay, let’s jump into our analysis.
Graphic Region of Interest: South America plus off-shore islands
Land Mass Covered: 17,750,994.2 sq km
Time Period: January 1, 2021 to March 31, 2021
High-Resolution Satellite Constellation: WorldView-2/3
WorldView-2/3 Constellation Imaging Statistics–South America
Total Area Collected: 8,993,889.9 sq km; 49,966.1 sq km per satellite/per day
Area Collected @ 20% or Less Clouds & 30 Degrees or Less Off-Nadir: 2,145,425.2 sq km; 11,919.0 sq km per satellite/per day; 23.85% of total
Looking around at today’s aircraft technology can feel like we’ve reached a plateau of innovation. Planes have looked the same for decades and travel times are fixed. Aircraft destined for space have hitched rides on rockets since the Cold War. The future of space travel has taken the form of elevators, solar sails, and ion drives. Everything else seems to fall into the realm of science fiction, theoretical but far beyond our reach.
There is one form of propulsion that’s seeing new breakthroughs, and that’s hypersonic travel fueled by never-ending detonation. A detonation is a powerful explosion, like the blast that did immense damage to Beirut in Lebanon in August of 2020, killing at least 180 people. The energy released by that blast was enough to power over a hundred homes for a year. At that speed, a flight across the United States would only take half an hour and a spacecraft wouldn’t need a rocket to launch into space. Researchers want to harness that power and use it for air travel, but detonations are difficult to control and usually last for less than a microsecond.
A research group from the University of Central Florida created an experiment to test these factors and to see if detonations can be controlled. The experiment used an established theoretical propulsion system called an oblique detonation wave engine (ODWE), that creates a shockwave by funneling air and fuel at hypersonic speeds toward a ramp. The shockwave heats up the air and fuel, creating a detonation and propelling crafts forward at hypersonic speeds. Failure can occur when the detonation moves toward the spacecraft and its fuel source, causing catastrophic damage, or it’s too far away and the detonation is ineffective. This was the problem Kareem Ahmed, the lead author of the paper, and his team wanted to answer.
 Artist’s interpretation of a hypersonic plane. (Credit: NASA)
If a detonation is so brief, how can anyone be sure that it was controlled? To test their theory, they created a 2.5-foot-long series of chambers, acting as the spacecraft and its propulsion system, that mixed heated air and hydrogen gas then accelerated it at hypersonic speeds at a ramp. They were able to hold the detonation for three seconds, long enough to prove that it was controlled. This seemingly small experiment is a major step to making hypersonic travel a reality. It’s a proof of concept and Ahmed plans to run the experiment for longer durations. The initial test had to be short or they risked eroding the glass panels on the side of the test chamber that were necessary in the first experiment to see where the detonation was taking place. By switching out the glass for metal, they should be able to run more robust experiments for longer periods.
There are many more engineering questions to answer and a slew of obstacles to overcome, but the future of air and space travel could be hypersonic.