
Before you come for me and say I haven’t done my research, I’m well aware that the 2026 official Pantone Color of the Year is Cloud Dancer; however, if you ask researchers in Germany, it is azurite blue, a stunning, naturally occurring, bright blue. They have found evidence that Paleolithic civilization might have been using this particular blue. A recent Science Daily article says, “For many years, experts assumed that Ice Age artists relied almost entirely on red and black pigments, since nearly all surviving artwork from this time uses those colors. The limited palette was often attributed to a scarcity of blue minerals or to the belief that blue held little appeal.” It has the scientists rethinking color and ice age people’s perspective on the importance of color. “The presence of azurite shows that Paleolithic people had a deep knowledge of mineral pigments and could access a much broader color palette than we previously thought – and they may have been selective in the way they used certain colors,” Dr. Izzy Wisher, lead authority in the study, says. This makes me wonder…What importance does color have on our world?
As map makers, we know that color is vital. Professionals know to question “default” and consider what message we want to convey with the map. The Color Brewer by Cynthia Brewer and Mark Harrower at Penn State has long been a go-to. If you haven’t checked it out, you should. John Nelson regularly shares considerations and how-to’s on color and maps on his blog, Adventures in Mapping. Some of my favorite maps that feel more like professional graphics do a great job of sending the message without a traditional legend. In particular, I admire his map of happiness that uses color, shape and size to quickly convey happiness in countries on the map. Amidst the dark background, it is easy to understand the data factors contributing to happiness, like a complex multimedia piece of art that causes us to react.
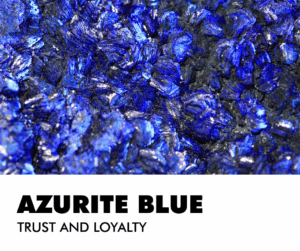 Image created in Canva by BD.
Humans respond to color. According to the Interaction Design Foundation, they respond in three ways: “biologically (e.g., red = fear), culturally (e.g., red = wellbeing in many Eastern societies) and personally from experience. Designers use color symbolism in (e.g.) logos to gain users’ trust and attention.” Many careers involve applying color theory across many fields, including Graphic Design, Interior Design, Fashion Design, and Branding, with roles like Color Consultant, Color Specialist, and roles in Packaging, UX/UI, and Web Design where you guide choices for mood, function, and appeal, often using digital tools and focusing on trends, psychology, and client needs. Think about it…Why do so many logos in the geospatial community have blue and green in them? If you’re working in the geospatial industry, we most often see earth colors and subconsciously trust those colors
Most people have a favorite color. Do you trust that color more? The folks at Verywell Mind speak about the effect of color psychology on mood feelings and behaviors. Have you been house hunting and find yourself jarred by the owner’s color choices? As you tour the house, you think, “That red kitchen has got to go!” or “What were they thinking by painting a whole room chartreuse?” For that reason, many real estate professionals will tell you to neutralize your home’s color palette before listing it. Do we trust beige? Not necessarily, but it does provide room for imagination. Interestingly, blue is considered the color of trust and loyalty. No surprise that it would become a popular choice for businesses. If there’s a color design dilemma at my house, blue generally wins. Everyone in the house likes blue.
If you like blue, then you might wear more blue. Are you wearing the right blue? Is blue in your wardrobe color collection? Some colors do make you look your best. These color collections are grouped by season and then light and dark various of those home seasons. You can hire an expert or find an app and let AI tell you. You probably already know. You feel best in some colors over others. Your hair color, eyes, and skin tone all play a role in looking your best…in color.
Color has been part of human life for ages. Early cave paintings featured red due to abundant clay pigments. Nature continually reveals new color combinations that influence our homes, fashion, and creativity. Which color inspires you most this year?
If you need me, I’m on a mission to find the perfect shade to repaint my bedroom. I’ve been living with samples for months, but it’s time to decide.
Barbaree Duke
Geospatial Crusader
Sometimes picking out the ideal color scheme for your map can be quite the challenge, especially when you have a large number of classes you need to show on the same map. Well, in these instances, you might want to check out Penn State University’s (PSU) Color Brewer 2.0 which is a website full of color advice! I found out about this website back in my graduate school days and have been using it ever since. Some of my favorite features of the site include:

- The ability to split your color scheme across a minimum of 3 categories and up to 12.
- There are color schemes for a variety of data types and then a variety of hues within these data types.
- There is an option for colorblind-safe schemes.
- And as an added bonus, you can export the color HEX/RGB/CMYK to a variety of formats in order to load them in your mapping application.
Nice work Cynthia Brewer and Mark Harrower of PSU–thanks for sharing this great site!
Until my next edition of the Free For All, happy hunting for free geospatial goodies!
Brock Adam McCarty
Map Wizard
(720) 470-7988
brock@apollomapping.com
 A sample from the last cloud-free image IKONOS collected over Ryans Crossing, Australia on December 20, 2014. This 80-cm color image has custom processing and color balancing applied by Apollo Mapping. (Image Credit: DigitalGlobe)
As many of our readers know, the longest life span high-resolution satellite ever launched, i.e. IKONOS, died in December 2014. And then over the past months, the archive has been offline while DigitalGlobe upgraded the production systems. We are happy to report that archive sales of IKONOS have started again!
Now that IKONOS’ production systems are back online, we were able to obtain a sample of the last cloud-free location it imaged. This 80-cm color IKONOS data was collected on December 20, 2014 over rural southeastern Australia in an area called Ryans Crossing (or Numbugga in other mapping applications). This image was collected about 8 miles northwest of Bega, Australia which is apparently home to the country’s number one cheese manufacturer!
Thank you for the fifteen plus years of amazing images IKONOS–you are already missed.
In this two-part Geospatial Frequently Asked Question (G-FAQ), I turn my attention to a topic that perhaps more cartographers should consider: making maps that are just as usable for the color blind as they are for people with normal vision. While you may not have considered this topic in the past, it is important when you consider that, (1) colors are often a very large part of the visual cues we associate with maps and that (2) nearly 5% of the population is color blind. In the first part of this G-FAQ series, we will explore the medical condition known as color blindness with a focus on this set of core questions:
How does the human eye see color? What causes color blindness? What are the types of color blindness and how prevalent are each?
How The Human Eye Sees Color
The human eye is much like a camera as it collects light (i.e. photons) and focuses them on sensors behind the lens. Specifically, photons enter the eye by passing through the cornea, into the pupil and then striking the back of the eye, or the retina (see Figure 1 for a more detailed diagram of the parts of the eye). The retina contains roads and cones which detect specific wavelengths of photons. When struck by a photon at the correct wavelength, the rods/cones are stimulated, producing an electrical pulse which travels to the brain along the optic nerve. It is the optical lobe that interprets these signals to produce a color image of the world around us.
The human eye has more than 100 million rods in the retina. Rods detect white, black and shades of grey. Rods are less sensitive to small changes in shades of grey as between white and black. In low light, there are not enough photons to excite cones, only the rods are excited in these conditions. So in low light, we only see in black and white.
 Figure 1. A diagram of the parts of the human eye. For a more detailed description of each of these parts, please refer to this National Eye Institute website. (Diagram Credit: National Eye Institute)
The human eye sees color when red, green and/or blue-sensitive cones are excited by photons. There are far fewer cones in the eye, with over 6 million color photoreceptors in the average eye. Cones have pigments that absorb photons over a small range of wavelengths (see Figure 2 and its caption for a short lesson on photons, wavelengths and energy). The wavelength range that each type detects overlap slightly so that certain colors cause two or even three cone types to fire at once. In fact, the secondary colors (i.e. yellow, cyan and magenta) which are formed by mixing the primary colors our cones see (i.e. red, green and blue) are brighter as two cones are excited at once by these photons. Sensitivity to photons varies by cone type as well. For instance, blue cones need about twice as much light to react at any given light intensity, so that blue-violet colors are darker than the other colors we see. There are also more red cones than green cones, and also more green than blue cones–this accentuates problems of color reproduction in the human eye.
 Figure 2. Let’s start with a quick lesson on the physics of light. Light is composed of wave-like particles of energy, called photons, that can be described by their wavelength (i.e. the distance from peak to peak or trough to trough of the wave shape) and their frequency (i.e. the number of wave cycles that pass a single point per unit of time). The frequency of a wave is inversely related to its wavelength so that photons with high frequency have short wavelengths and vice versa. And similarly the energy of a photon is proportionally related to is frequency so high frequency means high energy. In the chart that is above, you can see the specific wavelengths that human cones are sensitive to, from blue to green to red cones in each of the three, overlapping parabolic graphs. Also noted on the chart is the center wavelength of the colors blue, green and red. Below the three graphs are the colors your eye sees as photons of this energy strike your cones. By inspecting this figure, you will discover several of the reasons the human eye has far less than perfect color reproduction: (1) the peak response of our cones is not exactly matched with the center wavelength for the three primary colors; (2) the response of our cones overlaps so that more than one cone typically fires at the same time; and (3) blue cones are far less sensitive to photons than are red and green cones. (Chart Credit: Western Michigan University)
Now a final note on the eye and color that I could ignore, i.e. the spatial component to our visual perception. Even if light is evenly spread across the retina, we still perceive colors at the center of our vision differently than at the edges. This is an advantage as then we can determine information about the objects we are looking at even if it is evenly lit. So for example, we can see the edges of a brightly lit building so we do not run into it.
The Causes of Color Blindness
Someone that is color blind has an abnormality which prevents them from seeing colors as a typical person would. In some cases, those who are color blind cannot see specific colors; and in other cases they have reduced ability to distinguish between various shades. For most color blind people, the cause is congenital, meaning that the condition developed before they were born. By far, the most common congenital cause is inherited genetics, and specifically the X chromosome. Since males have only one X chromosome, if they have the recessive allele which causes color blindness, then they will exhibit the condition. Women have two X chromosomes so it would be rare for them to have two X chromosomes with the mutated allele. For this reason, women are more often carriers of the genes that cause color blindness but can still see color normally. Color blindness can also be caused by recessive alleles on non-sex chromosomes as well as by prenatal brain damage.
The other broad category for the causes of color blindness are those which afflict a person after they are born. These causes are most often linked to pharmaceutical drug use and specifically to Plaquenil which is used to treat rheumatoid arthritis. Severe trauma to the head and/or body has been linked to color blindness as have degenerative diseases and Vitamin A deficiencies. Disruptions to the optic nerve and/or parts of the brain that interpret optical signals from this nerve can also cause color blindness.
The Types of Color Blindness
When trying to categorize any topic, you invariably end up with outliers from the classification scheme you develop. With this in mind, here is the most encompassing categories I could develop after looking over various online resources. The most widely accepted classification appears to be based on the number of functioning eye sensors, the three categories are: monochromatism, dichromatism and trichromatism.
Monochromatism
This is a type of color blindness where those afflicted only have one rod and/or cone that functions properly. The sub-categories are as follows:
- Rod Monochromatism–the condition of only having rods in the eye so that the world is seen in shades of grey.
- Cone Monochromatism Type I–the condition of having only one type of cone and rods that function. With this condition, you can see colors but not distinguish between various shades.
- Cone Monochromatism Type II–the condition of having only one type of functioning cone. Unlike those with Type I, you cannot see at night with this condition.
These types of color blindness are very rare, impacting about 0.001% of people.
Dichromatism
Those afflicted with this type of color blindness have two functioning cones as well as functioning rods. The sub-categories are as follows:
- Deuteranopia–the condition of missing green cone pigment. This impacts 1% of males and 0.01% of females.
- Protonopia–the condition of missing red cone pigment. This impacts 1% of males and 0.02% of females.
- Tritanopia–the condition of missing blue cone pigment. This impacts 0.002% of males and 0.001% of females.
To get a better sense of how a person with dichromatism sees the world, please refer to this month’s Free for All.
Trichromatism
This is the most common type of color blindness and those afflicted with it have three cones but one of the color pigments is altered and thus they see colors differently than would an unafflicted person. The sub-categories are as follows:
- Deuteranomaly–the condition of being less sensitive to green light than a ‘normal’ person. This impacts 5% of males and 0.04% of females.
- Protanomaly–the condition of being less sensitive to red light than a ‘normal’ person. This impacts 1% of males and 0.01% of females.
- Tritanomaly–the condition of being less sensitive to blue light than a ‘normal’ person. This is not sex-linked so it impacts 0.0001% of all people.
Overall, about 8% of males and then 0.5% of females exhibit some form of color blindness, be it the total lack of color perception or altered color reproduction. Given that color blindness impacts nearly 1 in 20 people, creating maps that can be viewed as effectively as possible by all people is an important consideration for any cartographer. As such, in our final part of this G-FAQ, we will look at tips for creating maps that everyone can use effectively.
Do you have an idea for a future G-FAQ? If so, let me know by email at brock@apollomapping.com.
Find Out More About This Topic Here
- Abelard–The Theory of Color
- David Hubel–Eye, Brain and Vision
- Macalester College–Two Type of Color Blindness, Part I / Part II
- National Eye Institute–Diagram of the Eye
- University of Utah–Cognitive Psychology
- University of Washington–Contemporary Optics
- Western Michigan University–Color Reproduction
Brock Adam McCarty
Map Wizard
(720) 470-7988
brock@apollomapping.com