
The one thing we know about kids in general is that they have a lot of energy. Sometimes it’s hard for parents and teachers to keep up with them. The idea of recess is to let kids burn off some of that energy by having fun with their friends before heading back to class. But what if we could harvest energy from those kids and use it for the betterment of their community? Researchers at Brigham Young University have been working on a project to do just that.
Working in tandem with Empower Playgrounds, five engineering students from BYU embarked on Essam, Ghana to build generators into playground equipment to help light classrooms in an area where they have no electricity. The initial playground fixture was a merry-go-round built with a small generator typically used in wind turbines. When the kids turn the merry-go-round, the energy is stored for later use in the classroom. An initial problem with the fixture was the amount of revolutions needed to generate energy, as the generator would have required 300 revolutions per minute to do this. Obviously this would have proved very difficult and dangerous for the children, so gear boxes were installed to bring the requirement down to 12 revolutions per minute. The power is then directed to car batteries which are connected to chargers for LED lamps that can run for up to 50 hours.

Another goal of this project is to enable the local community to make this equipment on their own with resources that are readily available, such as recycled steel and Land Rover parts. Empower Playgrounds and BYU hope to expand to other power generating playground equipment like swing sets and zip lines in the future. Empower Playgrounds is also actively involved in classroom education, creating science kits to get kids interested in technology through fun interactive lessons and experiments.
Ghana’s Ministry of Education would like to see this technology expanded throughout the country to power their 10,000 schools. Unfortunately, Ghana is a very poor country with few resources so they are largely dependent on donations from wealthy western countries like the United States and the United Kingdom. Their GDP is similar to that of the state of Utah, yet they have 20 million more people in their country. At $7,000 per unit, the goal of 10,000 merry-go-rounds will take some time to be realized.
But researchers are hopeful that people will realize how popular and beneficial these are to the country and will make private donations to speed up the proliferation of the power-generating technology. The engineers had initially designed these units with the idea that 20 kids could use them at the same time for approximately 6 hours a day. The reality is that 40 kids at a time pile on, and use it for up to 12 hours a day. In a country where toys are almost non-existent and old tires are the most popular of those available, these playgrounds give kids a chance to have a childhood the way we in the Western world do, all the while benefitting their future by providing kid-powered energy
Justin Harmon
Staff Writer
Welcome to the first editions of our regular feature, Free For All! In these short pieces, Katie and I will point our Geospatial Times readers to the favorite free item we found that month for those in GIS and remote sensing.
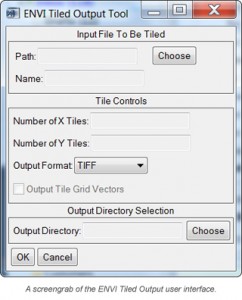
Not too long ago I ran into a problem trying to export a large image file as a GeoTIFF given that the image exceeded the maximum file size of 4GB. I considered subsetting the image using regions of interest in ENVI, but this seemed like a lot of unnecessary effort. I thought to myself, ‘There has to be an easier way to do this!’ Lo and behold there is a much easier way to subset an image with ENVI. Thanks to Exelis’ code library and the mighty programming of Dave Hulsander, there is a free GUI that you can download by following this link.
The GUI creates a new button in the ‘Basic Tools’ drop-down menu and with it you can specify the number of tiles in the X and Y directions and the output file format. It also appends the row and column number to the image title so they are easy to spatially identify. You can even save the vector grid file. This month’s Free For All lesson: you’re not always stuck with what you got!
Each month I will explore a geospatial topic of interest in this regular feature, the Geospatial Frequently Asked Question (G-FAQ). G-FAQ will be written in a down to earth fashion with an emphasis on illustrations, tables and imagery as is required to explain the topic. I will also provide links to each of the references used to write this piece so that you can dig deeper on your own. I hope you enjoy G-FAQ and please do send along any feedback/questions you might have about my monthly topics.
For the first G-FAQ, I will focus on a topic that made me scratch my head for the first few months of working with satellite imagery:
Why does a mathematical expression of ‘scale’ (e.g., 1:12,000) have two meanings to geospatial professionals? Some use scale to describe my zoom level in ArcGIS; others use it to describe the accuracy of orthorectified imagery; and still others use it to mean both at the same time–what gives?!
Before I jump into the answer to this question, let me explain the concept in a bit more detail. For this G-FAQ, we will focus on this expression of scale–1:12,000. In some cases, 1:12,000 is used to describe the zoom I set in ArcGIS to define what level of detail is apparent in my imagery (i.e. map scale). In other cases, 1:12,000 is a definition of a map’s horizontal accuracy as 10-meter Circular Error 90% (or CE90%). And to a smaller minority, 1:12,000 implies both map scale and horizontal accuracy.
According to the NMAS, for a paper map with a map scale (I define this term in some detail below) of 1:20,000 or larger, the accuracy of 90% of the depicted features must be within 1/30 inch of the scale. And for maps with a smaller scale, 90% of the features must be within 1/50 inch of the scale. Now to put that into terms that are easier to understand, if you have a paper map at 1:12,000 scale, the features depicted on this map must be within 400 inches (or 12,000 / 30) of their actual positions on the planet; while a map at 1:50,000 scale must have an accuracy of 1,000 inches (or 50,000 / 50) to meet the NMAS standards. As a side note, Circular Error 90% also has its roots in the NMAS as CE90% is defined as the distance within which 90% of the points in an image fall from their actual positions. While the standards established in the NMAS have been revised multiple times since 1941, perhaps most notable in 1998 by the Federal Geographic Data Committee, the concept of tying horizontal accuracy to map scale was established during the early days of mapping technology.
Now to move on to the second part of this month’s topic we focus on map scale, starting with a simple definition: it is a fraction or ratio that expresses the distance on a map as its distance in the real world. So put into words, a map scale of 1:12,000 would mean that 1 inch on a paper map or computer screen represents 12,000 inches (or 1,000 feet) in the real word. In an era of static, tangible paper maps, the concept of map scale was more intuitive as you could bring one into the field to get a reminder on scale and its tie to a real world distance. But in the world of the computer monitor, with its ability to zoom in and out on a true ‘photo’ of the planet, this relationship has lost some of its tangibility. To many, map scale is now the number you enter in ArcGIS to zoom in and out on your imagery: when you use a larger number (such as 1:12,000), you zoom out; when you use a smaller number (such as 1:2,400), you zoom in. If you use too small of a number (such as 1:120), you zoom in too close and get a fuzzy, pixilated looking image.


In this series of previews, you see a visual representation of map scale with the same location shown at varying scales: 1:12,000, then 1:2,400 and finally 1:1,200. We have used a sample of 50-cm Natural Color WorldView-2 imagery collected on September 3, 2011 over Greene County, Pennsylvania. This data has been processed with our color balancing technique, Photo Enhancement. (Image Courtesy: DigitalGlobe)
To wrap up this month’s G-FAQ, let’s bring all of these concepts together. Scale is a geospatial term with two different but related definitions. When used to explain the accuracy of a map, image or other geospatial dataset, scale is tied to the CE90% horizontal accuracy standards established by the NMAS in 1941. CE90% is inherently tied to map scale as you saw in the discussion above; and this link is the reason geospatial professionals tend to use scale interchangeably when chatting about imagery and vector data. When used to explain the zoom level of a map, scale is defined as map scale which has a distinct visual impact as can be seen in the series of WorldView-2 previews above [NOTE: MAKE SURE PREVIEWS ARE ABOVE, CHANGE IF NOT]. As we learned in our elementary school writing classes, context matters when you decide how scale is defined in your conversation.
Do you have an idea for a future G-FAQ? If so, let me know by email at brock@apollomapping.com.
Find Out More About This Topic Here:
- Federal Geographic Data Committee National Standard for Spatial Data Accuracy (NSSDA)
- Rice University’s Mathematics of Cartography–Scale
- United States National Map Accuracy Standards (NMAS)
Brock Adam McCarty
Map Wizard
Sister Cities International is the national headquarters for the sister city program in the United States. The program began in 1956 when President Eisenhower proposed a people-to-people diplomacy initiative, and it became a non-profit corporation in 1967 due to its popularity. A sister city is an officially recognized, broad-based, long-term partnership between two communities that begins with an official ceremony involving the top-elected officials of the two jurisdictions. Sister cities can come about in a number of ways: whether it is a top-down approach where two mayors meet and become friends; or in a bottom-up scenario where an individual or group in the community takes the initiative to reach out to another community.
Being that Apollo Mapping finds it home in Boulder, Colorado; we thought it would be appropriate to start here with our look at sister cities throughout the world. Boulder is a very progressive city that is known as being on the ‘cutting edge’ culturally, socially, academically and even in the business world. Boulder is also on the cutting edge of the sister city program as we are proud to say that we have seven sister cities! They are: Dushanbe, Tajikistan; Jalapa, Nicaragua; Kisumu, Kenya; Lhasa, Tibet; Mante, Mexico; Yamagata, Japan; and Yateras, Cuba.
On May 8, 1997, Boulder engaged in a Sister City program relationship with Dushanbe, Tajikistan. Dushanbe is in the western portion of Tajikistan, a country that is bordered by Uzbekistan, Afghanistan, Kyrgyzstan, China and Pakistan. It is the capital of the country which is the smallest in Central Asia by area. The city of Dushanbe has close to 700,000 residents, 85% of which are Tajiks. Dushanbe’s economy focuses a great deal on mining, as coal, lead and arsenic are its top exports. For energy production, 95% of Tajikistan’s electricity is generated by the Nurek Dam; the world’s highest as of 2008. The city is situated at the union of two rivers, the Varzob and the Kofarnihon. It developed from a small village based on its identity as a marketplace that was held on Mondays, as Dushanbe literally means “Monday” in Persian.
In 1987, Dushanbe presented its unique Dushanbe Tea House to the city of Boulder. It was completed in Tajikistan in 1990, and then shipped to Boulder where it was reassembled and opened to the public in 1998. It was constructed by 40 Tajik artisans over a two year period, and then disassembled and shipped to Boulder in 200 crates! The Tea House abuts the Boulder Creek, keeping with the Tajik tradition of placing tea houses along waterways. The Boulder Valley Rose Society planted a rose garden on the premises as well, which is another traditional aspect of Tajik culture. The Dushanbe Tea House is a landmark in the city, and is something that tourists have on their long list of “must-sees” when visiting the People’s Republic of Boulder.

Justin Harmon
Staff Writer
After months of intensively testing both WorldView-1 and WorldView-2, DigitalGlobe has updated the horizontal accuracy specification on its Standard product series to 5-meters CE90% (Circular Error 90%). As was the case in the past, this specification is not a guaranteed accuracy as Standard imagery products are only georeferenced. Rather, this is a global average from tests of Standard imagery versus a database of points with a known latitude, longitude and elevation (typically referred to as ground control points, or GCPs). WorldView imagery collected at off-nadir angles greater than 30 degrees and/or over surfaces with significant terrain displacement is likely not to achieve this average horizontal accuracy specification.
If you have any questions about the updated accuracy specification of Standard WorldView-1/2 imagery products, please let us know at (720) 470-7988 or brock@apollomapping.com.

Astrium and the Agence Française de Développement (AFD) are launching the first satellite imagery portal aimed at protecting the forests of Africa
- More than 600 satellite images are now available to help monitor changes in forest cover in Central Africa
- By developing space technologies to monitor the effectiveness of strategies for reducing greenhouse gas emissions, Astrium is helping to fight climate change
Paris, 26 October 2011–Astrium Services, via its GEO-Information business, and the Agence Française de Développement (AFD) have launched a portal to provide satellite imagery of the forests in the Congo Basin to organizations working to conserve the region’s forests. Over 600 SPOT satellite images will now be directly accessible via this portal.
By comparing archive imagery against new images, it will now be possible to track changes in the Congo Basin’s forest cover. Administrations, public institutions and NGOs working on sustainable forest governance in the region will use the images and the accompanying value-added services to more effectively monitor land use–a key to sustainable management of the forests in Central Africa. The data is also crucial for measuring the effectiveness of national strategies and defining plans of action as part of the REDD+ program (Reducing Emissions from Deforestation and forest Degradation).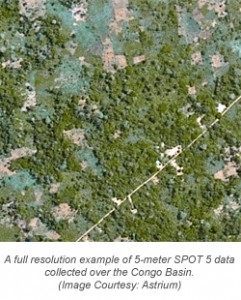
SPOT satellite images of the Congo Basin will be made available to all organizations working on forest preservation projects that specifically focus on reducing emissions resulting from deforestation or forest degradation, preserving or increasing forest carbon storage, or promoting sustainable forest governance.
Financing for the free portal is being provided by Astrium and by the AFD as part of a broad initiative to protect the forests of the Congo Basin using space technologies. The project is being overseen by a consortium of partners including IGN France International (IGN-FI), the Centre National d’Etudes Spatiales (CNES), the Institut Géographique National (IGN), the Institut de Recherche pour le Développement (IRD) and the international branch of the Office National des Forêts (ONFi).
The space imaging portal for the Congo Basin forests was today officially opened in Paris at the REDD+ workshop, which brings together economists, scientists, forest management organizations, specialists and technology providers working to preserve tropical forests. The event is organized by Planet Action, Astrium’s corporate social responsibility (CSR) initiative that is helping to fight climate change through the donation of geo-information technologies.
The satellite imagery portal for the forests of the Congo Basin is available at http://bassinducongo.reddspot.org/. Additional information is also available on the GEO-Information website of Astrium Services: www.astrium-geo.com.
For more information about the Astrium constellation of satellites, contact an Apollo representative by phone at (720) 470-7988 or by email at brock@apollomapping.com.