This month’s free geospatial add-on is the versatile and life-saving ET GeoWizards. We all know what a powerful tool ArcGIS is for spatial analysis, ET GeoWizards is a toolbar that adds a plethora of new and some repeat functions to the application. The repeat functions certainly come in handy when ArcGIS’ toolbox functions won’t execute.
For instance, on many occasions the ‘Import from Google Earth’ function has converted my KMLs to shapefiles when ArcGIS’ ‘KML to Layer’ function has failed. ET GeoWizards user interface has more than 110 free functions from Exploding Multi-part Features to Erase Layer. The toolbar is meant to be used with the ArcView license which has limitations that the ArcEditor and ArcInfo licenses do not.
The company that programmed and distributes the software, ET Spatial Techniques, offers an unregistered version of its software that has no time limitation and many of the same functions as the full version. Its main limitations are related to the number of features, data points and vertices that can be processed. Additionally, several Toolboxes and Scripting are not available for smaller datasets.
For the corporate world, there is a version available for purchase that has no restrictions and allows for processing large datasets. ET Spatial Techniques offers a number of toolbars, all of which can be found here. This month’s Free For All takeaway message is: If at first you don’t succeed, try something free!
For those of us that are deeply embedded in the geospatial world, spending several thousand dollars on mapping software is a ‘no-brainer’. But that is not the case for many of the readers of The Geospatial Times. For those of you looking for a robust, free mapping solution that can read a wide variety of file formats as well as offers a toolkit that actually lets you perform your own spatial analysis, then Quantum GIS (QGIS) is the choice for you! What really separates QGIS from the other free mapping applications out there is its ability to query data for a defined set of search criteria; without this ability, a GIS application is really just a means to make a static map.
Here is a complete list of the functions and features we feel should make QGIS your choice for a free GIS application:
- Works on both PCs and Macs
- Open a variety of vector, raster and streaming formats
- Create and edit vector files
- Display multiple layers at once
- Change symbology with the ability to categorize data for useful map legends
- Measure distances
- Export on screen displays to a picture file (such as a JPEG)
- Query/filter the attributes of vector layers to perform spatial analysis
The only function missing from QGIS is the ability to open personal and file geodatabases. That said, with Esri’s recent launch of the public API for file geodatabase development, this may well change.
If you would like to test out QGIS for yourself, here is a link to download the version that works for your computer.
If you find QGIS to be too complex for your needs, a nice second choice is the free mapping application, uDIG, but this application lacks the ability to query the attributes of vector layers.
Brock Adam McCarty
Map Wizard
(720) 470-7988
Last month, I started a series called Small World that looks at sister cities throughout the world. We began in Boulder, Colorado (our hometown!) and chose Dushanbe, Tajikistan, one of Boulder’s seven sister cities, for our focus. Dushanbe has many sister cities as well, fifteen to be exact. In order to build a bridge across our “small world,” we travel from Dushanbe to Lusaka, Zambia in this edition of Small World.
Lusaka is the capital city of Zambia and is located in the south-central portion of the country. It covers nearly 70 square kilometers and is comprised of approximately 1.7 million people. It is one of the fastest developing cities in Southern Africa due to its fairly central location and proximity to two major roads and the rail system. In 1935, it was chosen to be the capital of the British colony of Northern Rhodesia; and in 1964 it was declared the capital of a newly-independent Zambia.
Zambia is a landlocked country with a tropical climate and is slightly larger in area than the state of Texas. It is a highly urbanized country with 44% of the population concentrated in its few urban areas such as Lusaka. It is considered one of the poorest nations in the world with a per capita annual income of roughly $395, which is approximately one-half of its level when they gained independence in 1964. Life expectancy for Zambians is just over 40 years, and maternal mortality rates for women are 830 per 100,000 pregnancies. Zambia is heavily reliant on the mining and agricultural industries as the country’s main commodities are copper, cobalt and tobacco.
Zambia has many protected areas inside its borders, and perhaps the most well-known is the South Luangwa National Park located northeast of Lusaka. It is the southern-most of three national parks located in the valley of the Luangwa River. It was founded as a game reserve in 1938 and became a national park in 1972. It covers over 9,000 sq km spanning two eco-regions: both of them wooded savannah and each having a dominating tree species. On the higher slopes of the valley, the Southern Miombo is predominant; while the bottom of the valley is dominated by the Mopane tree. The park is home to a variety of animal species such as elephants, wildebeest and zebra to name just a few.
While Lusaka is a very poor city (over 60% of its inhabitants are unemployed), it continues to grow as its population has tripled in the years since independence. Always looking for ways to stimulate their economy, the city and the country focus a lot of their efforts on tourism, offering wildlife safaris that include activities such as walking, birding, canoeing, horseback and mobile expeditions. Another boost to their economy has come from British and South African expatriates moving to Lusaka–roughly 70,000 of them. There are a considerable number of Chinese people living in Zambia as well, some estimates say near 80,000 live in the more populated regions.
If the number of people from abroad taking up residence continues to grow, combined with increases in tourism, this African country may make serious strides upward from the bottom echelon of the world’s poorest nations. Combined with the country’s upswing in literacy rates and focus on education, Zambia may become a leader for the rest of the African continent to follow in the foreseeable future.
Justin Harmon
Staff Writer
The United States is home to some 2.5 million abandoned oil and gas wells. Once great providers of energy, these wells have been dormant for years and, in some cases, for decades. Researchers from the Chinese Academy of Sciences believe these wells could be retrofitted to tap into the geothermal energy contained beneath the surface of our planet. Rock temperatures increase by 25-50 degrees Celsius for every kilometer of depth due to the extreme heat emanating from the Earth’s core; and experts believe that the trapped heat in each well could provide approximately 50 kilowatts of electricity. Alone this number is small compared to what is produced at a coal burning power plant, but multiplied by the millions of inactive wells across the country, we could have a serious new resource for energy. In 2008, the Department of Energy designed the first low-temperature geothermal unit in an oil field in a testing center in Wyoming. The well has been producing energy since steadily, and has an approximate overall capacity of 217 kilowatts.
Universal GeoPower used $1.5 million in stimulus funds in 2010 to assess 4,000 abandoned oil and gas wells across the state, as well as 37,500 wells in the Gulf Coast region. These wells are expected to be used to produce low-pressured geothermal brine water. The hot wastewater that is an ordinary byproduct of oil and gas wells would be circulated through a specially designed binary power plant to generate electricity. This used in conjunction with active wells will help to offset the costs typically associated with oilfield production.
ExxonMobil recently released a report that says 15% of the world’s power will be renewable by 2040. Bloomberg New Energy Finance echoed this sentiment as well. According to their findings, in 2010 there was $187 billion spent on renewable energy projects as compared to $157 billion for natural gas, oil and coal.
Demand is expected to be 30% higher in 2040 than in 2010, and natural gas from shale and other unconventional rock resources will account for 30% of global gas production by that date. This means that there will still be a continued heavy reliance on traditional forms of energy, but alternative energy such as wind, ocean, biomass and solar, as well as the potential of shale and geothermal wells could set the trend in the years beyond.
So while the world trudges onward looking for clean energy sources, we are still dependent on our tried and true traditional energy assets. With this research that is examining the use of dormant and abandoned wells to produce geothermal power, as well as to maximize the efficiency of currently active wells, the future is bright for this new form of energy production.
Justin Harmon
Staff Writer
In the late-1970s, the Department of Energy began studies on Yucca Mountain to determine if it was a suitable location for a nuclear waste repository. The original plans were for permanent storage of 70,000 metric tons of nuclear fuel and radioactive waste that was currently stored in 121 sites around the nation. Yucca Mountain sits just 80 miles northwest of the Las Vegas metropolis. Because of its proximity to a large population base (amongst other reasons), there was great uproar against the plan.
Over two-thirds of Nevadans opposed the repository, many arguing that the state does not have a single nuclear power plant so why should it have a nuclear waste site? As of March 2009, consideration of Yucca Mountain as a nuclear storage site was ended, largely due to nation-wide opposition.
This is an example of environmental justice that made headlines across the nations for years. And while it is a very important issue to decide where to properly store our nuclear waste, there are many other examples of more localized environmental justice and the impacts it has on smaller communities. For instance, Juliana Maantay of Lehman College–CUNY wrote an article titled, Mapping Environmental Injustices: Pitfalls and Potential of Geographic Information Systems in Assessing Environmental Health and Equity. Maantay defines environmental injustice as the disproportionate exposure of communities of color and the poor to pollution, and its concomitant effects on health and the environment.

As part of her study, she looked at 13 GIS-based environmental equity studies in the Bronx, New York to evaluate differences in the methods of determining exposure and demographic characteristics of the adjacent populations. In many communities, the most glaring offenders of hazardous contamination are drycleaners, waste transfer stations and auto-body shops. These businesses are considered permitted waste-related facilities. In Maantay’s study she mapped the waste facility locations using a color grid to show minority population dispersion in the Bronx where 70% of the inhabitants are either African American or of Hispanic origin. The results show that these facilities are predominately in areas with the highest minority populations.
Much of the decision for placement of potentially hazardous facilities comes down to zoning regulations. In New York City, noxious facilities are only allowed to be located in areas zoned for manufacturing. These locations also happen to be where the poorest residents live, the majority being minorities.
While this study offers an important geographic analysis of the disparity in the distribution of hazardous facilities, it also lays the groundwork for future research studying the link between waste facility placement and environmental health. The rallying cry has always been “Not in My Backyard,” but it has now become, “Not in anybody’s backyard.” As more information comes to light about the dangers of hazardous wastes, there is sure to be further opposition to exposure from communities across the nation.
Justin Harmon
Staff Writer

50-cm resolution orthorectified products for applications requiring a high level of detail
- A phased orbit and a daily revisit, combined with extreme agility, for information in record time
- The first component of a four-satellite constellation, for an ideal match of detail, coverage and revisit
Following the recent success of the first Soyuz launch from the French Spaceport in Guiana, Astrium Services’ GEO-Information division, a leading global provider of geo-information products and services, is pleased to inform its customers and partners that Arianespace successfully launched Pléiades 1 on December 16th, 2011.
Pléiades 1 is the first component of a two high-resolution satellite system operated by Astrium Services. The Pléiades constellation will provide 50-cm optical products in record time, offering daily revisits to any point on the globe and acquisition capabilities tailored to meet the full spectrum of civil and military requirements. With a 20-km footprint, the Pléiades satellites have the widest imaging swath in their class. The satellite’s extreme agility coupled with multiple acquisition modes makes the system very responsive to specific user requirements. In addition, automated production flowlines help fast delivery of orthorectified products.
Astrium Services expects Pléiades imagery and services to be commercially available next  arch 2012, approximately 3 months after the launch.
4 Satellites in the Next Two Years
The launch of Pléiades realizes the first step of a four-satellite true constellation combining a twice daily revisit capability with an ingenious range of resolutions. This upcoming constellation, operated by Astrium Services, is based on four satellites: Pléiades 1 and Pléiades 2, two high-resolution satellites delivering 50-cm ortho color products as a standard; and SPOT 6 and 7, designed to extend SPOT 5’s success to the 1.5-m product family. Phased on the same orbit, the constellation will enjoy unprecedented reactivity, with intra-day revisit capacity in both resolutions anywhere on the Earth. Multiple tasking plans per day result in an unrivaled optimization of data collection: unforeseen weather changes, as well as last-minute requests, which can be taken into account for a first-class level of service.
With four optical and radar satellites in orbit and four new imaging satellites to launch over the next two years, Astrium Services, through its extensive geo-information range of products and services, is gearing up to bring its customers the best that space technology has to offer, ensuring continuity of service up to 2023.
For more information about the launch of Pléiades 1, contact an Apollo representative by phone at (720) 470-7988 or by email at brock@apollomapping.com.
As approved resellers of DigitalGlobe, Apollo Mapping is proud to offer imagery products from the first-ever 30-centimeter (cm) natural color orthoimagery layer covering the lower 48 states of the United States of America as well as significant portions of Western Europe. Scheduled to be completed by mid-2012, this impressive dataset will cover more than 10 million square kilometers (sq km) with an additional 6 million sq km of updated imagery to be collected over the next 30 months. Microsoft and DigitalGlobe have partnered on this long-term project, utilizing an exclusive aerial sensor–the UltraCamG–to collect the most accurate and visually appealing imagery available on the market.
The data included in the Precision Aerial imagery program can be grouped into three categories according to its collection and production specifications:
- High Value Areas (HVAs)
- These are dense urban centers and tourist destinations
- No clouds, cloud shadows, haze, smoke or pollution
- A horizontal accuracy of 2.7-meters (m) Circular Error 90% (CE90%)
- Leaf-off is required
- Free from standing water with only permanent snow and ice
- Data is processed and color balanced across the entire market
- Standard Blocks
- These are often suburban areas and smaller cities
- No clouds, smoke or pollution; and less than 2% cloud shadows and haze
- A horizontal accuracy of 4.0-m CE90%
- Leaf-off is desired
- Data is processed and color balanced by one-degree cells (~10,000 sq km)
- Remote Blocks
- These are rural areas
- Minimal amounts of clouds, cloud shadows, haze, smoke, pollution, standing water, snow and ice
- A horizontal accuracy of 5.3- m CE90%
- Leaf-off is not available
- Data is processed and color balanced by one-degree cells (~10,000 sq km)
The following specifications are universal across the Precision Aerial imagery dataset:
- Both 30-cm natural color and 60-cm color infrared (CIR) products are available
- Color balanced, seamless orthomosaics
- A projection/datum of UTM WGS84
In this regular monthly piece, we will provide our readers with an update on the progress of DigitalGlobe’s Precision Aerial imagery program, current coverage maps and full resolution previews of the data. If you would like more details on the coverage available in your area and/or on the pricing of the various delivery options, an Apollo Mapping representative would be happy to assist and can be reached by phone at (303) 993-3863 or email at sales@apollomapping.com.
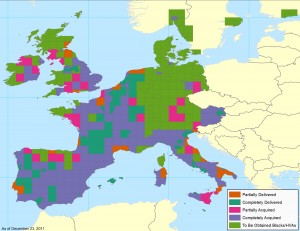
December 2011–Coverage Statistics & Maps
- 9,800,000+ sq km of 30-cm natural color and 60-cm CIR data acquired
- 5,711,000+ sq km–loaded on DigitalGlobe’s cloud and streaming web services
- Key Areas Completed Acquisition in December
- Athens, Georgia, USA
- Greenville, South Carolina, USA
In the coverage maps below of DigitalGlobe’s Precision Aerial imagery over the United States and Europe, we have indicated the outlines of the HVAs and blocks that are a part of this program. Each of these outlines is color coded to indicate its current acquisition and/or delivery status.