

Have you ever needed a full view of the earth in a photo-realistic format–for example, to use in a movie trailer or perhaps as a backdrop in an online web mapping application? If so, my Free For All! this month is the ideal solution: a 1-arc minute view of the entire earth created by our friends at NOAA. This image is a shaded relief map derived from the ETOPO1 dataset which contains a wide variety of bathymetric and land elevation products. By coloring lakes, oceans and seas blue; land areas green and brown; and then ice sheets and glaciers shades of white, NOAA has created a photo-realistic view of our planet at 1-arc minute resolution.
At the equator, an arc-minute is approximately 1.8 kilometers (North-South) by 1.8 kilometers (East-West). As you move away from the equator, our planet narrows as would any spheroid. Therefore, an arc-minute also changes in shape whereby at 50 degrees latitude the resolution is still 1.8 km North to South but is now ~1.2 km East to West. When brought into ArcGIS, the ETOPO1 relief map supports zooms up to ~1:7,000,000. As such, this imagery layer is appropriate for views of regions (e.g., the Midwest and the South) as opposed to more limited views of cities, counties and even a state.
There are two formats of the ETOPO1 shaded relief available for download. One features ice sheets and glaciers that are larger than 100 sq km–you can download the ice sheet version here. In the bedrock version, ice sheets have been removed–you can download the bedrock version here. NOAA also offers an online application that lets you clip out the coverage you need as well as up-sample the resolution if need be–it can be accessed here.

Brock Adam McCarty
Map Wizard
(720) 470-7988
In this new monthly feature, we span the globe to examine Our Changing Landscape with time series of medium resolution RapidEye satellite imagery. The RapidEye archive dates back to late 2008 and already contains more than 3 billion square kilometers of data. This month, we travel to the Middle East and explore changes in the water depth of the Dead Sea.
The RapidEye Constellation
RapidEye is a constellation of five 5-meter medium resolution satellites each offering five spectral bands of information. The RapidEye constellation offers a daily revisit time to every location on the planet with a huge footprint that is 77-km wide. The data is priced competitively with a base price of $1.28 per square kilometer for all five spectral bands–academics receive a discount on this price. RapidEye adds a fifth band, the red edge, to the ‘traditional’ multispectral set of blue, green, red and near-infrared (NIR). The additional spectral data available in the red edge band allows users to extract more useful land ‘information’ than can be from traditional 4-band imagery sources. When RapidEye imagery is ordered as a Level 3A Orthorectified product, images from multiple dates are extremely well registered, making it the ideal data source for Our Changing Landscape.
The Dead Sea
Surrounded by Israel to the west and Jordan to the east, the Dead Sea is a land locked body of water with no natural outflow to the ocean. At ~400 feet below sea level, the Dead Sea is the lowest land on Earth. Without a natural outflow to the ocean, salt concentrates in the Dead Sea as fresh water flows into the basin and evaporates. In fact, the Dead Sea’s salinity concentration is over 33% compared to just 3% in the Mediterranean Sea.
In the long history of the Dead Sea, it is not unusual for it to dry up almost completely, as it apparently did ~100,000 years ago. However, recent population and economic growth in the Middle East–and subsequent use of the fresh waters in the Jordan River–have put significant strain on this delicate ecosystem. The Jordan River is the most important source of fresh water feeding the Dead Sea, once emptying some 1.3 billion cubic meters of water per year into the sea in the 1930s. Today, the inflow from the Jordan River is just 20 to 30 million cubic meters. With this dramatic decrease in total inflow, the water levels in the Dead Sea are falling by more than a meter per year. The animation below comprised of 5-meter natural color RapidEye images from 2010, 2011 and 2012 provides visual evidence of a rapidly changing Dead Sea.

If you would like to find out more about using RapidEye for your academic studies, engineering projects or any landscape analysis, let us know at sales@apollomapping.com or (303) 993-3863.
In the past five years, geospatial professionals and academics alike have increasingly focused efforts on extracting useful spectral information from panchromatic satellite and aerial imagery. Since the start of the 20th Century, panchromatic imagery has been used to extract building footprints, road centerlines and parcel boundaries. Traditionally, this extraction is a manual process completed by rooms full of dedicated GIS professionals. With the growing commercial archives of 50-centimeter (cm) panchromatic data collected by WorldView-1 (WV1), attention has turned to automated processing techniques which can extract information from large geographies quicker than can be done by humans. These techniques typically rely upon spectral (and at times spatial) characteristics that are easier to detect in multispectral (i.e. color + near infrared bands) signatures. One distinct advantage of panchromatic data are the reduced file sizes which makes processing this imagery quicker. As such, if reliable techniques can be found for extracting useful information from pan-only imagery, it could streamline many remote sensing workflows.
Unsupervised Classifications
When extracting information from satellite and aerial imagery, one can employ supervised and unsupervised classification techniques. In supervised classifications, users identify a cluster of known pixels that include the features they are hunting for; and then statistics are employed to ‘match’ these spectral signatures to other pixels in the imagery. In theory, if the training dataset of known pixels is robust, you are able to find all/most of your features of interest throughout the entire scene in an automated fashion.
In unsupervised classifications, pixels are clustered together into classes by the similarity of their spectral signatures without the use of a training set. Similarity is measured with a variety of mathematical and statistical techniques that admittedly are more technical in nature than the scope of this article. For the analysis presented here, I focus on an unsupervised classification technique offered in ENVI called ISODATA.
ISODATA is an unsupervised classification technique that can be run on a single band as it clusters data based on the distance each pixel’s spectra is from the mean value of the class it creates. These classes are arbitrarily created to start and then are added to and subtracted from through an iterative process. Once the iterations are completed, you are left with a user-specified number of classes, which are clustered so that all the pixels fall within the user-specified distance from the classes’ mean spectral values.
ISODATA and WorldView-1 Satellite Imagery
For this analysis, I ran multiple ISODATA classifications on 50-cm panchromatic WV1 imagery collected March 22, 2010 over Austin, Texas. Varying both the number of classes as well as the number of iterations, I found that it was most important to increase the number of iterations as too few resulted in many unclassified pixels. In the end, I used 15 iterations with a maximum number of classes set to 15–all the other default ISODATA settings remained unchanged. The results of the classification were a bit dizzying at first as the animation below attests to.

Upon closer inspection of the ISODATA results, it was apparent that the unsupervised classification technique did a ‘good’* job at identifying bodies of water. As such, I extracted the water class as a shapefile and brought it into ArcGIS. Inside of ArcGIS, it was apparent that many pixels were mis-identified as water. Many of these erroneous identifications were small clusters of pixels. To clean up these small clusters, I filtered out all polygons that covered more than 500 pixels. What I was left with was surprisingly accurate as the series of images below show.


Conclusions
As should be apparent from the full resolution animation above, the ISODATA classification did a ‘good’ job at extracting water from the panchromatic WV1 imagery. The classification was certainly not without fail as river rapids and shallow areas in ponds and rivers were commonly misidentified. This suggests that the ISODATA classification works well on deep, flat bodies of water that have little reflectance (i.e. the blackest pixels in the imagery). While any shallow area or water with foam on top (e.g. river rapids, waves, turbulent zones) would be misidentified. The ISODATA classification also did a ‘good’ job at detecting contiguous surfaces covering larger areas such as roof tops and parking lots; though extracting these classes to polygons in an automated fashion would likely involve more elaborate GIS filtering.
In sum, the results of this analysis suggest that panchromatic data has value beyond the traditional visual uses. With additional tweaking to the ISODATA classifications and elaborate GIS filtering, land-use classes other than water could likely be extracted in an automated fashion from WV1 panchromatic imagery.
Brock Adam McCarty
Map Wizard
(720) 470-7988
* I use the term ‘good’ in quotations here as I have done nothing to quantify these results short of a visual analysis.
Toulouse, April 1, 2012–Not long after arriving on orbit, Pléiades 1A set its sights on sister satellite, SPOT 5.
Unique Rendezvous
Pléiades’ superior agility has enabled it to accomplish the unusual feat of imaging another satellite in flight. Both satellites are operated by Astrium.
The rendezvous took place from Pléiades’ 700-km vantage point when it pointed its sensors at SPOT 5 orbiting 100 km below. An impressive achievement, since Pléiades 1A and SPOT 5 complete an orbital revolution of Earth in just one and a half hours, at a speed of 6.7 km/s for Pléiades 1A and 6.58 km/s for SPOT 5.

In the image, SPOT 5’s solar array is clearly visible to the right and the bright spacecraft bus and optical sensors to the left.
First of a New Family
SPOT 5, launched on May 5, 2002, has been acquiring medium-resolution (2.5 m) wide-swath (60 km) imagery for 10 years. Pléiades 1A, launched on December 16, 2011, is the first in a new generation of agile, quick-reaction satellites that will deliver high-resolution imagery (50 cm).
Pléiades 1A will be followed into orbit by SPOT 6 before the end of this summer, its twin Pléiades 1B later in the year and SPOT 7, currently scheduled to launch in early 2014. Designed around a very similar architecture and phased in the same orbit, this constellation of four satellites will ensure increased responsiveness and availability of data products at resolutions of 50 cm to 1.5 m through to 2024.
For more information about the SPOT and Pléiades constellations, please contact the Apollo Mapping sales team at (303) 993-3863 or sales@apollomappoing.com.
The Apollo Mapping team is excited to announce that starting on June 4, 2012, we will be accepting orders for high resolution imagery products from Astrium’s new satellite, Pléiades 1A. Launched on December 16, 2011, Pléiades 1A is Astrium GEO-Information Services’ first high resolution satellite. Featuring 50-centimeter (cm) panchromatic and 2-meter (m) 4-band multispectral resolution imagery products, Pléiades 1A has the largest footprint of any high-res satellite at 20 kilometers (km) wide. Pléiades 1A is an agile satellite that will be able to collect mono, stereo and tri-stereo imagery for any mapping project–large or small. With the industry’s largest footprint and enhanced agility, the Pléiades 1A high-resolution imagery archive is sure to grow with leaps and bounds. Pléiades 1A will be joined by its twin satellite, Pléiades 1B, later this year.
Below are Pléiades 1A images collected on April 6, 2012 over Riverside, California. We processed these samples to assure the most accurate colors and crispest features possible, and are happy to share the results with you. We feel the full-resolution previews are impressive and speak for themselves!


Key Specifications of Pléiades 1A
- Spectral Bands: panchromatic & 4-band multispectral (RGB + NIR)
- Product Resolution: 50-cm panchromatic & 2-m multispectral
- Average Revisit Time: 2 days (1 day once Pléiades 2 is operational)
- Footprint Width: 20-km (at nadir)
For more questions on Pléiades 1A pricing, archive coverage or tasking orders, please contact the Apollo Mapping sales team at sales@apollomapping.com or (303) 993-3863.
Up to this point, users of high and medium resolution imagery products have had to use multiple search engines to discover and order that data that meets their project needs. Today, that changes with the launch of Apollo Mapping’s Image Hunter. Our imagery search engine is available 24 hours, 7 days a week and is a one-stop shop for every major source of medium and high resolution satellite imagery on the market today, including: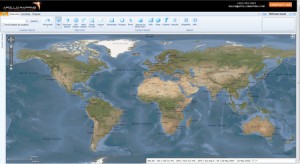
- WorldView-2
- QuickBird
- WorldView-1
- GeoEye-1
- IKONOS
- Pléiades 1A (coming soon)
- The SPOT constellation (coming soon)
If any of our readers have struggled with other geospatial search engines, Image Hunter features:
- Near-instantaneous loading of low resolution preview imagery with associated collection date and key metadata
- Ability to define your area of interest by address and with coordinates, geometric shape or shapefile/KMZ
- Responsive base layer with street names and imagery to provide a spatial context when discovering data
- Online ordering of satellite imagery from 3 data providers and 7 constellations
- Global coverage with tools to measure distance and create annotated maps
Image Hunter can be accessed here. If you would like a Quick Start Guide to get up and running, it can be downloaded here. We are excited to find out what you think about Image Hunter and any ideas you might have to improve the user experience–we can be reached anytime at (303) 993-3863 or at sales@apollomapping.com with these suggestions.
Six-hundred miles separate Kingston, Jamaica and Miami, Florida, our next stop on this tour of our Small World. Separated by the island-nation of Cuba, Miami’s proximity to other countries makes it a true American melting pot. Miami has the highest percentage of people born outside of the country, at fifty-nine percent. While a large percentage of this population is Cuban, Nicaraguans, Haitians, Hondurans, Dominicans and Colombians also make up a significant portion of residents.
The area now known as Miami was first claimed in the 16th century by Spain, and incorporated as a city on July 28, 1896 with an initial population of just 300 people. Today it is the 42nd largest city in the U.S., with a population of 400,000 within the city limits, and 2.5 million residing in Miami-Dade County. The city is divided into neighborhoods, roughly North, South, West and Downtown (east). Nearly 200,000 residents live in the immediate Downtown area, making it the one of the most populous downtowns in the U.S. behind Chicago and New York.
Miami is home to numerous famous people: Dave Barry, Steve Spurrier and Ricky Martin to name just a few. But one of the more popular residents might be Gloria Estefan, known as the Queen of Latin Pop. She is one of the top 100 bestselling music artists of all time, selling more than 100 million records worldwide. She and her band, the Miami Sound Machine, have scorched up the billboard charts for decades with numerous top ten hits and earning 3 Grammys along the way. The Miami music scene is very diverse due to its varied population; and numerous genres such as reggae, conga, rumba, and samba can be heard across the city’s rich nightlife.
The area of Miami is only 36 square miles, making it the smallest land area of any major U.S. city with a metro area of at least 2.5 million people. Miami is located between the Florida Everglades to the west and the Biscayne Bay to the east. The Everglades National Park covers 1.5-million acres and resides in the counties of Miami-Dade, Monroe and Collier. The park is home to 36 species that are designated as threatened, including the Florida panther, the American crocodile and the West Indian manatee. There are more than 350 species of birds and 300 species of fresh and saltwater fish that call Everglades National Park home as well.
Biscayne Bay is a lagoon that is 35 miles long and up to 8 miles wide at its broadest point. It is typically divided into three areas by the locals: North Bay, Central Bay and South Bay. North Bay lies between the Miami Beach Barrier Island and Miami on the mainland. One of the most well-known areas of Miami Beach is South Beach (aka SoBe). Until the 1980s it was considered a rundown portion of the city, but in that decade of excess, the wealthy and influential moved to the area, spurring a local boom in building and renovation. Today it is a place to see and be seen–and definitely a good port for people watching.
Originally named for the Native American tribe the Mayaimis, Miami is a leading vacation destination. It is the only city in the U.S. to be founded by a woman, Julia Tuttle, who is considered the “Mother of Miami.” Quite appropriately, sunscreen was invented in Miami Beach by a pharmacist in 1944 to help fight off those powerful rays. Affectionately called “America’s Riviera,” Miami is beloved by many. Strolling through the streets brings you back to a time reminiscent of the 1930s and 40s due to its Art Deco structures that line the streets of South Beach. So come on down to Miami, maybe you’ll find that just like Gloria Estefan said, “The rhythm is gonna get you…”

Justin Harmon
Staff Writer