
In this monthly series, I turn my attention to one of the most powerful software packages for raster processing available–the Geospatial Data Abstraction Library (GDAL)–and as an added bonus, it’s free! Each month, I focus on a different utility offered in GDAL, walking the reader through its applications and offering up a series of tips and illustrations so that you can emulate this process in your office and/or home. In this edition of WIG, I show our readers how to use GDAL to create a color relief from a raster digital elevation model (DEM).
About GDAL
GDAL is an open source software application that was launched in 1998 and has been updated multiple times since. While the current version of GDAL (i.e. version 1.9) can be downloaded from multiple locations, I find this site to be the most up-to-date and easy to navigate. I suggest downloading the stable version of the MSVC2010 build for either 32-bit or 64-bit PCs depending on which you have access to. You can also download GDAL as part of an easier to install program, FW Tools, but the version of GDAL included with this installer is usually not the most recent.
GDAL contains a wide array of utilities to help you process raster files. I find that GDAL is more stable and runs quicker than ArcGIS, ENVI and PCI for data production–although the toolkit is more limited than in these applications. GDAL does not rate high for user-friendly functionality as it is command line driven (i.e. words and text, not graphics and mouse clicks); and this is the inspiration for creating the WIG series.
What Is a Color Relief?
When a DEM is created, it is by definition a single layer raster, i.e. a layer with pixels that define the elevation at a given point; and as a single layer, by definition the data is black and white only (or panchromatic). When you load a DEM into many geospatial applications, you can apply color ramps to this single panchromatic layer to get a colorized elevation layer. However, many of these preset ramps have a limited number of color choices and you are not able to control how the colors blend into each other. Further, these color ramps are temporary so they must be applied each time you load the DEM.
The GDAL command, color relief, is a freeware solution to creating a truly colorized DEM–meaning one that you could even open in Photoshop and it would appear in color. The color relief command offers a high degree of control over the colors used to represent each height and how they blend into one another.
A color relief is created by defining various elevation values and assigning a color to these values. GDAL then blends the assigned colors on a smooth linear basis between these elevation values. So for example, if you were to define an elevation of 100 meters as yellow and then 150 meters as blue, GDAL would blend all the values between 100 and 150 meters so that there is a smooth transition from yellow to blue. In other words, at an elevation of 125 meters, the pixel would be green–which is a 50/50 mix of yellow and blue. Users are able to define as many of these elevation value–color pairings as they need so that a complex or simple color relief can be created. The output from GDAL when using the color relief command is an 8-bit color balanced raster file with red, green and blue bands ; or red, green, blue and alpha if your application requires the 4-th alpha band to create color images–most programs do not.
Creating a Color Relief
In order to create a hillshade layer, I employed the GDALDEM functions–you can find out more about them here. Here are the steps I took to calculate a hillshade:
- This is the same data used in last month’s edition of WIG
- I moved my DEM file, a digital terrain model (DTM) produced by DigitalGlobe with 2-meter resolution over Gadara, India, to a folder called, ‘Test,’ located the root of my C: Drive
- I chose a simple folder name and file location (i.e. C:test) for the data to make things easier when working with the command line interface of GDAL
- I also changed the name of the DTM file to ‘DTM.tif’ to make things easier when working with GDAL
- After starting up GDAL, I used the command: cdtest
- This command points GDAL to the folder I created with the DTM
- If you would like to get a list of the files in the folder you are working in, use this command: dir
- To calculate color relief, I used the following command: gdaldem color-relief DTM.tif color_text.txt color_relief.tif
- In this command, the words ‘gdaldem color-relief’ define the utility that GDAL uses to process the data
- ‘DTM.tif’ is the full name of the input (original) DEM file
- ‘color_text.tif’ is the name of the text-based file that will define my output color schema; creating this file is by far the most challenging part of the color relief command, and as such, is the focus of the remainder of the piece below
- ‘color_relief.tif’ is the name I chose for the output color relief TIFF file; you could chose different file extensions if you want to create a JPEG2000, for instance
- I could also add several strings to the end of the command in Step 5 to employ additional GDAL functionality:
- –alpha -> this adds an alpha band to the output raster
- –s scale=value : replace the word value with the proper scaling factor if the horizontal and vertib. –zero_for_flat -> replace 0 for default value of -9999 for flat areas, or areas with no aspect
- –exact_color_entry -> this forces GDAL to color all pixels black if their elevation is not an exact match to a value in the text-based color configuration file; as such, there is no color blending here, only color matches to the values in the configuration file or to black
- –nearest_color_entry -> this forces GDAL to assign each pixel the color of the nearest corresponding elevation in the text-based configuration file; as such, there is no color blending here, only color matches to the values in the configuration file
Tips for Creating a Text-Based Color Figuration File
The most challenging part of using the color relief GDAL command is the creation of a text-based color configuration file. As such, for the remainder of this WIG, I offer as many tips as I can to create effective configuration files. The first step to take is determining the maximum and minimum elevation values in your DEM. Many of you do have access to ArcGIS, so I will walk you through this process in ArcMap. First, you will need to increase the ‘Maximum number of unique values to render’ under the menu chain, Customize -> ArcMap Options -> Raster, to a very large value (I used 100,000,000) in order to render all of the pixel values in your DEM. Now go to the DEM layer, right click, and follow this menu chain, Properties -> Symbology -> Classified. Press the Classify button and let the histograms build if need be. You can get the maximum elevation value for your DEM in the top right under the Classification Statistics. To get the minimum value, zoom in on the values to left-side of the graph (the positive ones if you are working with terrestrial elevation models); keep on zooming in until you can accurately estimate the minimum value. For my DEM, I found a maximum value of 156.91 meters and a minimum of 96.91.
The next step is determining if your DEM has any black fill at the edges. This happens when the polygon used to clip your elevation model is not a rectangle. In the areas where there is not elevation information, false values (often large negative values) will be entered so that they can be ignored in future production. Many applications are ‘intelligent’ enough to recognize these background values on their own, however that is not the case with a color configuration file. In ArcMap, the areas with black fill on my DEM were easy to find using either the Identify button and clicking at the margins; or by using the method described in the paragraph above. In my DEM, the black fill value is -32,767.
Now it is time to create your color configuration text file. I suggest using Wordpad for this as it comes with every Windows-based PC, and then saving the file in .TXT format. Now you need to create this file with a line by line definition of the cut off values for elevation and then the corresponding colors in Red, Green, Blue format. So for example, if I wanted to set the elevation value of 100 meters to white, I would use this code:
100,255,255,255
i.e. [Elevation value],[Red value],[Green value],[Blue value]
In order to create the color relief you see below, I used the following configuration file; and at the end of each line I put the color this creates in parentheses, you would not add these descriptions to your own configuration file:
-32767,16,161,8 (light green)
96.91,16,161,8 (light green)
111.91,50,135,28 (dark green)
126.91,84,60,14 (dark brown)
141.91,163,133,78 (light brown)
156.91,255,255,255 (white)
Here are some considerations to take when picking the colors for your defined elevation values:
- I added in the background value as the same color as the minimum elevation value. This creates a continuous color at the edge of the color relief. Without this, there would be odd colors at the edge of the color relief.
- I divided the interval of elevation values evenly when deciding where to define colors. While this worked out well in this example, it might not always be effective. In cases where you have lots of elevation values that are clustered closely together, you will need to alter this spacing to create a smooth color transition (if that is your desired outcome).
- I found that defining multiple intermediate colors and elevations resulted in a more pleasing color relief than when I used more basic colors such as yellow and blue. When you use yellow and blue, you end up with multiple colors in between these two points with green as the intermediate color. For some applications, you may well want to emphasize the intermediate elevation values by picking more basic colors.
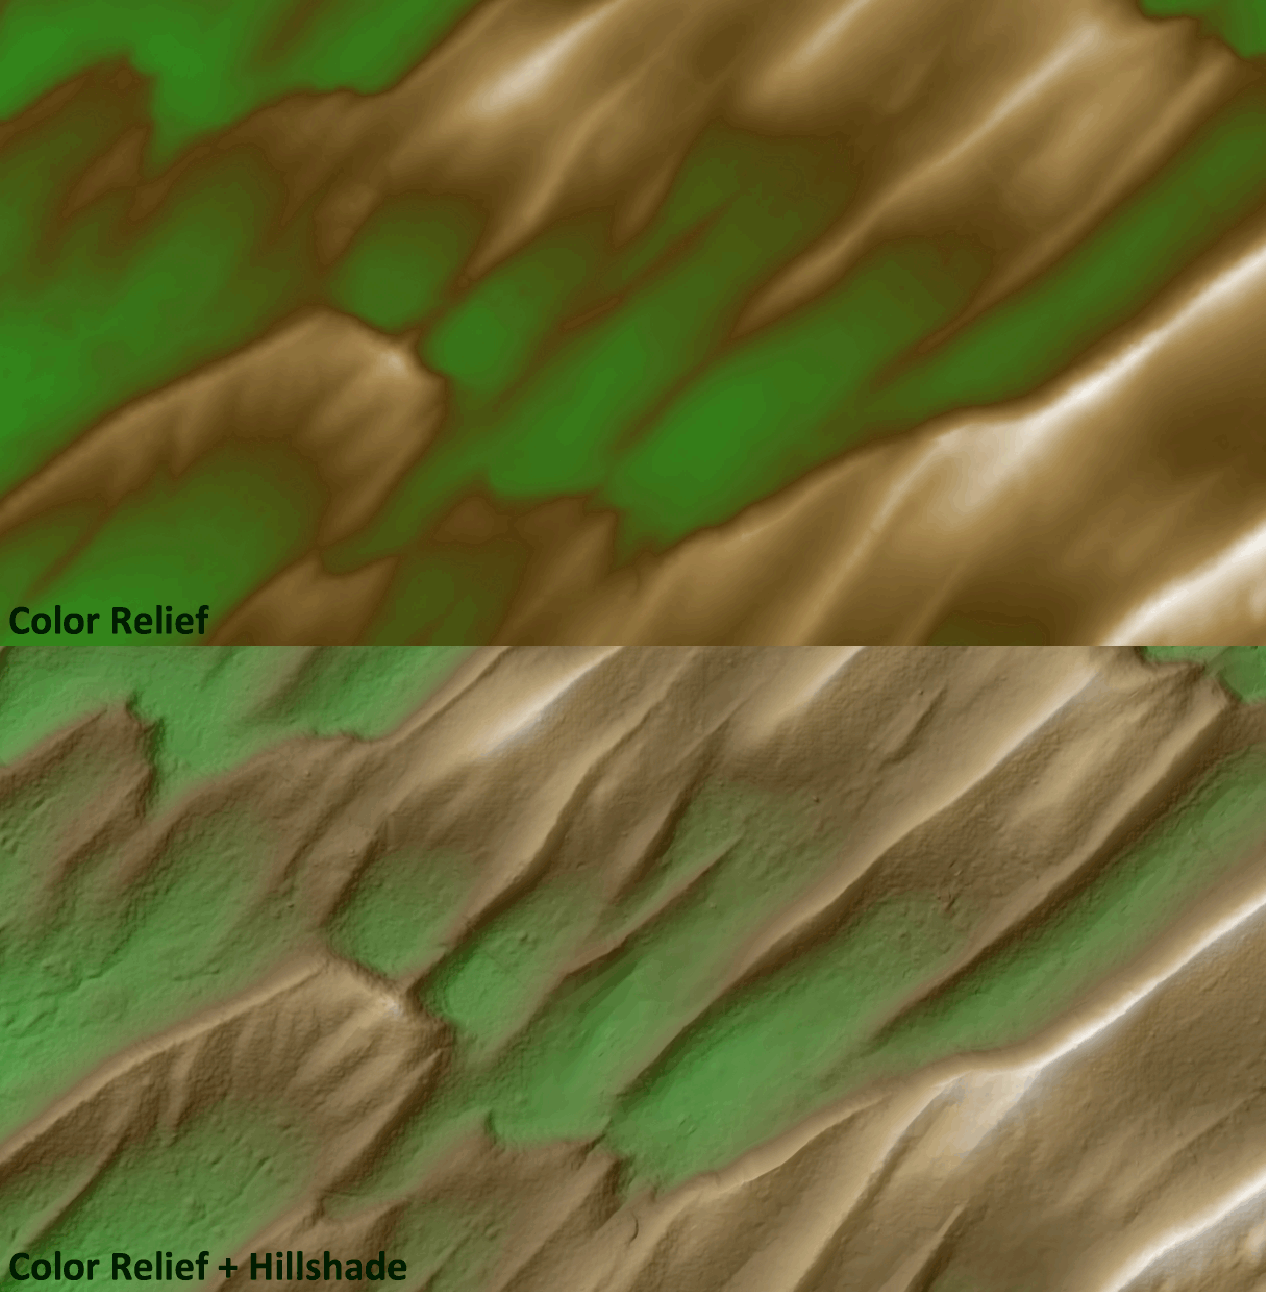
One word to the wise on a topic that stumped me for quite some time the first time I encountered it. In ArcGIS 10.1, it appears a change was made to the raster management module so that many TIFF images are opened with an auto-stretch that includes a Percent Clip Stretch and in some cases a Gamma Stretch. While this is a great feature if your data is not already balanced, it can have drastic negative effects for those that are already balanced–as is a GDAL color relief! You can check out if this happened to your raster layer by going to, Properties -> Symbology -> Stretched.
As with any map you create, you need to carefully consider the audience and your intended message when you make choices on color and symbology, so please be sure to take all the tips offered in this WIG in light of that fact.
Brock Adam McCarty
Map Wizard
(720) 470-7988
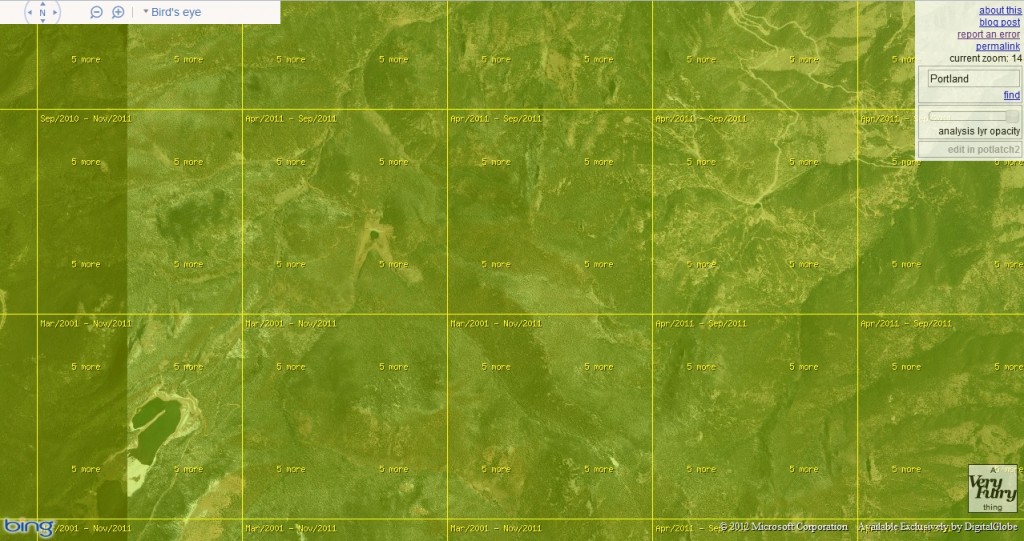
Have you ever been on Bing Maps and wondered, “What is the date of the imagery in this location?” Well I know I definitely have and according to the maker of the Bing Aerial Imagery Analyzer, Martijn van Exel, there is now a way to find these dates out. The Bing Aerial Imagery Analyzer is a slick API that lets you zoom in and out and then shows the ‘known’ date of the imagery–by tiles–that is currently loaded in Bing Maps.
While we all use applications like Bing Maps and Google Earth in the daily course of our jobs and/or studies, we should recognize them for what they are, i.e. ways to advertise to us and GIS-lites. We should also recognize them for what they are not, i.e. an imagery gathering application with 100% correct metadata. The reason I bring this up is that there will certainly be errors with the imagery dates in this application; and this is even addressed in this blog by the maker. That said, if you know the limitations up front, this is still a pretty slick application!
Until my next edition of Free For All!, happy hunting for free GIS data!
Brock Adam McCarty
Map Wizard
(720) 470-7988

Starting September 2012, DigitalGlobe will institute a new policy whereby any satellite imagery from QuickBird, WorldView-1 and/or WorldView-2 that is 90 days or less old will be priced at the current product tasking cost.
Here is a summary of what this means to your purchases of archived DigitalGlobe satellite imagery with Apollo Mapping moving forward:
- The minimum order for archived satellite imagery is still 25 square kilometers (sq km).
- For imagery that is 90 days or less old, you will be charged the current tasking price for the product you order.
- Once imagery is 91 days old, archive pricing applies once again.
- For mixed archive orders of imagery that is both ≤ 90 days and > 90 days old, the order will be priced according to the percentage of coverage for each.
- We will be able to honor quotes that were sent to you prior to this pricing change.
If you have any additional questions about these changes, please do not hesitate to email us at sales@apollomapping.com.

Have you had a chance to test out our new online imagery search engine, Image Hunter?
If not, give it a test drive now as all orders placed with Image Hunter will receive a 5% discount during the month of September 2012!
Image Hunter can be accessed 24 hours a day, 7 days a week and is a one-stop shop for every major source of medium and high resolution satellite imagery on the market today, including:
- WorldView-2
- QuickBird
- WorldView-1
- GeoEye-1
- IKONOS
- Pléiades 1A (coming soon)
- The SPOT constellation (coming soon)
If any of our readers have struggled with other geospatial search engines that are clunky; only query one data source; and/or do not provide preview images, then Image Hunter is the solution to your woes, as it features:
- Near-instantaneous loading of low resolution preview imagery with associated collection date and key metadata
- Ability to define your area of interest by address and with coordinates, geometric shape or shapefile/KMZ
- Responsive base layer with street names and imagery to provide a spatial context when discovering data
- Online ordering of satellite imagery from 3 data providers and 7 constellations
- Global coverage with tools to measure distance and create annotated maps
During the month of August, we made several upgrades:
- You can now search Image Hunter using a file that is in Well Known Text (or .WKT) format.
- If you prefer to search according to the Public Land Survey System (PLSS), we added this functionality.
- And for those users working in the defense world, you can now search by the Military Grid Reference System (MGRS).
Image Hunter can be accessed here. If you would like a Quick Start Guide to get up and running, it can be downloaded here. We are excited to find out what you think about Image Hunter and any ideas you might have to improve the user experience–we can be reached anytime at (303) 993-3863 or at sales@apollomapping.com with these suggestions.

By now, the majority of our readers have heard about the pending combination of DigitalGlobe and GeoEye–and very likely you have seen news that covers the spectrum from positive to neutral to negative. Some of you may have formed your own opinions on the combination of the two leading high-resolution satellite imagery providers; and as you can imagine, the Apollo Mapping team has its own strong, positive opinion of this admittedly expected news story–and we say this story was expected given GeoEye’s recent loss of a portion of its US military contracts.
To frame the discussion that follows, as we are not financial experts, none of our opinion focuses on what this combination means to shareholders and the like. Rather, we focus on the positive impacts for those in the geospatial, remote sensing and broader mapping communities. In our opinion, the combination of DigtialGlobe and GeoEye will bring:
-
- Better coordination of their high-resolution satellite resources. This will impact both tasking and the quality of the archive that they will be able to provide. Currently, DigitalGlobe and GeoEye are embroiled in a rather passive battle for increased market share of both new collections (i.e. tasking) and archive orders. In this passive battle, the two companies have to balance the need to fulfill ‘risky’ tasking orders with unknown cloud cover conditions vis-a-vis obtaining imagery strictly for the archive (and thus unpredictable future revenue) in areas that are expected to be cloud free. This daily struggle between a quality archive and fulfilling tasking orders quickly happens unseen and unconsidered by many in our community; but still with very real impacts on our ability to obtain the high-resolution imagery we all need. With a combined constellation of 5 high resolution satellites, these companies will be able to streamline operations and better coordinate their efforts to both build the archive and simultaneously fulfill tasking order. For example, instead of two companies with a goal to have imagery over the Houston area that is less than 6 months old, as a combination, you only need to collect this area once to have the desired coverage.
-
- New products and innovations. Both DigitalGlobe and GeoEye feature extremely experienced and creative sales, marketing, production and development teams. By combining this experience and creativity, the marketplace will benefit as innovative and new products are made available. Further, a combined company again means less duplication of efforts–so instead of two companies pursing the same goal for quick streaming services (i.e. WMS, WCS), they can combine their experience, come up with solutions quicker and spend previously duplicated time and development funds on other projects.
-
- Better customer service and easier to use products. Many of you likely order from both DigitalGlobe and GeoEye either directly or through your Apollo Mapping sales team. By consolidating companies, a more standardized process for ordering imagery will be created as will a standard metadata system for all five of their combined high resolution satellites. This standardization will only make things easier for all us that work with a variety of data products and sources on a daily basis.
-
- New online search tools for both archives. Many of you likely visit both the DigitalGlobe and GeoEye websites on a regular basis to search for the high resolution coverage you need. When these two companies combine, you can cut your work in half as you will be able to visit one website to search their combined archives. Or, in the meantime, you can always check out Apollo Mapping’s Image Hunter which already lets you search, preview and order from a combined imagery archive of DigitalGlobe, GeoEye and more!
- A healthy and competitive marketplace. Many of the recent, negative stories I have seen and comments I have heard about the DigitalGlobe-GeoEye combination focus (at least in part) on the lack of competition this move will create. To them we say that there is still plenty of viable competition left, aka Astrium, who just launched their first high resolution satellite, Pléiades 1A, and plan to launch its twin, Pléiades 1B, by the end of 2013. Further, there are startup companies, such as Skybox Imaging and their planned constellation of micro-satellites, which should offer competition in the near future. And finally, there is a healthy and more established competitor, i.e. aerial photography, which will certainly keep any new pricing model in check if these combined companies want to continue to compete in this marketplace.
In the end, as our industry grows and more companies turn public, we should expect corporate mergers, takeovers and the rest; but there is no reason to assume the combination of DigitalGlobe and GeoEye will mean anything but positive changes for our mapping community.
The Apollo Mapping Sales Team
& Brock Adam McCarty
Have you had a chance to test out our new online imagery search engine, Image Hunter?
If not, give it a test drive now as all orders placed with Image Hunter will receive a 5% discount during the month of September 2012!
Image Hunter can be accessed 24 hours a day, 7 days a week and is a one-stop shop for every major source of medium and high resolution satellite imagery on the market today, including:
- WorldView-2
- QuickBird
- WorldView-1
- GeoEye-1
- IKONOS
- Pléiades 1A (coming soon)
- The SPOT constellation (coming soon)
If any of our readers have struggled with other geospatial search engines that are clunky; only query one data source; and/or do not provide preview images, then Image Hunter is the solution to your woes, as it features:
- Near-instantaneous loading of low resolution preview imagery with associated collection date and key metadata
- Ability to define your area of interest by address and with coordinates, geometric shape or shapefile/KMZ
- Responsive base layer with street names and imagery to provide a spatial context when discovering data
- Online ordering of satellite imagery from 3 data providers and 7 constellations
- Global coverage with tools to measure distance and create annotated maps
During the month of August, we made several upgrades:
- You can now search Image Hunter using a file that is in Well Known Text (or .WKT) format.
- If you prefer to search according to the Public Land Survey System (PLSS), we added this functionality.
- And for those users working in the defense world, you can now search by the Military Grid Reference System (MGRS).
Image Hunter can be accessed here. If you would like a Quick Start Guide to get up and running, it can be downloaded here. We are excited to find out what you think about Image Hunter and any ideas you might have to improve the user experience–we can be reached anytime at (303) 993-3863 or at sales@apollomapping.com with these suggestions.
DigitalGlobe’s Advanced Elevation Series (AES) is a suite of elevation data products that are reasonably priced with global coverage. By utilizing existing archive coverage and their constellation of 50-cm WorldView satellites, DigitalGlobe is able to offer an industry first: global elevation data delivered in reasonable time frames at competitive market prices.
There are three basic product offerings within the AES: Mapping, Precision and Very High Precision elevation data. The three products are differentiated by their resolution and accuracy–this information is summarized in the table below. For each of the products, DigitalGlobe offers both a Digital Surface Model (DSM) which include human-made and natural features (such as trees, bushes and buildings); and a Digital Terrain Model (DTM) with these features removed. Other important specifications include:
- Minimum Order Size
- 100 square kilometers
- Geographic Coverage
- Global
- Price lifts do exist for some Asian countries
- Cloud Cover
- 5% or less
- Cloudy pixels in final product are identified with an Esri polygon shapefile
- Data Sharing
- Data can be shared with up to 5 end users for no additional charge
- Uplifts can be applied to accommodate more end users
A Summary Table of Key AES Product Specifications
With pricing to meet different budget requirements and global coverage, DigitalGlobe’s AES elevation suite is the ideal solution for:
- Regional studies which require an analysis of elevation.
- Academics in need of a reasonably-priced solution to replace dated and low resolution public sources.
- More accurate orthorectification, particularly in areas of high topographic change.
If you would like more information about the global AES offering by DigitalGlobe, you can send requests to sales@apollomappping.com or call us at (720) 720-7988.
With their national team having just won the 2012 UEFA European Football Championship, you can imagine that the residents of the capital city are having quite the summer celebrating. The Spanish national team has how won two straight Euro Cups and also has a World Cup title in between. Some believe this to be one of the best football (soccer) teams of all time–and perhaps even a dynasty. But there is more to know about the beautiful city of Madrid than just its love of football.
The largest city in Spain and the third largest in the European Union, Madrid dates back to the 9th Century after the Visigoths had already made their mark in the western portions of present-day Europe. Muslim factions led by Muhammad I of Cordoba had ordered a palace built near the Manzanares River, or as the Muslims called it, al-Majerit. This was shortened to Majerit and eventually changed to its present name, Madrid. Synonymous with this period was the martyrdom of 48 Christians known as the Martyrs of Cordoba. These Christian idealists spoke out in blasphemy against Islam and specifically the prophet Muhammad. Islam reigned as the premier religion for several centuries, but by the 15th Century, the Spanish Inquisition had driven out those not true to the Catholic Church. Catholicism is now the most practiced religion in Spain.
Madrid is known for its vast and beautiful culture. Many of us are aware of Spaniards’ passion for bullfighting (whether we agree with it or not), known as corrida de toros, but the city also features beautiful architecture, a vibrant nightlife and many well-known art galleries and museums. Referred to as the Golden Triangle of Art, Madrid is home to three world-famous art institutions: the Prado Museum, the Museo Nacional Centro de Arte Reina Sofia and the Thyssen-Bornemisza Museum–all of which reside on the Paseo del Prado, one of the oldest urban drags in the city. Its churches are often considered works of art, and the oldest in the city was built in the 13th Century, the San Nicolas de los Servitas. It is speculated that it was originally built as a mosque and then was converted to a church when the city moved toward Catholicism.
The city is divided into 21 districts which are further subdivided into 128 wards (or barrios). Each barrio has its own feel, and thus attracts different residents and tourists. Lavapies is one of the poorest districts near the city center, and is primarily made up of immigrants (Chinese, Arabs and Africans), but because of the international flare, it also attracts artists and bohemians as well as those looking for authentic and affordable ethnic dining. At the opposite end of the spectrum is the Cuatro Torres Business Area (CTBA), which is the hub of the financial district. The area is defined and distinguished by its four tallest skyscrapers. But perhaps the most popular barrio in town (at least for nightlife) is La Latina. Lined with beautiful churches but catering to social butterflies, its tapas bars and clubs are an attraction for residents and tourists alike. On Sundays it is home to El Rastro flea market, the largest open-air market in Madrid that houses up to 3,500 vendors–a great place for people watching and a few good deals.
Madrid is the European city with the highest number of trees and acres of green space per inhabitant. Coupled with its rich culture, food and nightlife, it makes for an attractive and exciting place to visit. So if you’re going to stopover some time, take in as many aspects of their vibrancy as you can, and don’t forget to cheer for their national team, La Furia Roja (the Red Fury).


Justin Harmon
Staff Writer