
The Pléiades 1 constellation (or at least part of it!) has been in orbit since December 2011 and if you have not had a chance to check out any sample imagery, take a few moments and have a look at the gallery on our website. If you work with high resolution imagery, you should consider Pléiades 1 for your next geospatial project.
A variety of Pléiades 1 products are available from both a growing archive and as a new collection, including 50-centimeter (cm) pansharpened imagery and 50-cm panchromatic–2-meter (m) 4-band multispectral bundles. We are happy to discuss the technical specifications, pricing and tasking options available with this new satellite constellation as Pléiades 1A has been joined in space by its twin, Pléiades 1B, which is now fully operational.

 © CNES 2012, Distribution Astrium Services / Spot Image S.A., France, all rights reserved.
Working with Pléiades 1 for the past year plus, we have noticed that:
- Astrium is able to deliver on their tasking feasibilities.
- The data is crisp with excellent color saturation so that it is on par with competitors’ 50-cm satellites.
Recent Tasking Successes with Pléiades 1
Now that the Pléiades 1 constellation is active in space, we can only imagine how quickly tasking requests will be filled on this high resolution satellite constellation. The vast majority of our new collections have been filled in well under a month with only Pléiades 1A, and in fact many of them have been filled with 15% or less cloud cover data even in historically cloudy areas such as the forests of Central American and the coastline of Oregon.
Now that Pléiades 1B is operational, the constellation features daily revisits to every location on the planet with 2 million square kilometers of daily collection capacity. In the past month, we were able to collect cloud free imagery over Indonesia during the Monsoon season and then nearly cloud-free imagery in central India–both collections took less than two weeks from order confirmation to data delivery!
Pléiades 1 Sample Imagery
This month we feature stunning sample imagery collected by Pléiades 1B over Augusta, Georgia on March 10, 2013 just several weeks ahead of the 77th Masters Tournament at August National Golf Club. We Photo Enhanced this 50-cm natural color imagery to improve its colors and sharpness and the results speak for themselves.
Our Contact Details For More Information About Pléiades 1
The Apollo Mapping sales team can answer any questions you might have about the high resolution satellite constellation, Pléiades 1. We can be reached anytime at (303) 993-3863 or sales@apollomapping.com.
More sample images and technical information about Pléiades 1A and 1B can be found on our website here.
 This map shows the areas imaged by Pléiades 1A/1B from December 31, 2012 to February 28, 2013 over southern Africa (in black). Please note that in many instances, multiple images were collected over the same area. This is difficult to portray on a static map in an effective way hence it is not shown here.
Well, we definitely have! So in this monthly piece, we pick a high resolution satellite, a time period and a geography, and then report key statistics on the total amount of imagery collected. So without further ado, let’s jump into our analysis.
Graphic Region of Interest: southern Africa (as defined in the accompanying map)
Land Mass Covered: 9,281,242 square kilometers (sq km)
Time Period: December 1, 2012 to February 28, 2013
High Resolution Satellite: Pléiades 1A/1B
Southern Africa Pléiades 1 Imaging Statistics
Total Area Collected: 1,319,762 sq km; ~14,664 sq km per day
Area Collected @ 20% or Less Clouds & 30 Degrees Off-Nadir: 754,516 sq km; ~8,384 sq km per day; 57.2% of total
Have you ever wondered exactly how many satellites are orbiting our planet right now? How about the amount of space debris that is ‘out there’? Well look no farther as the folks at Analytical Graphics, Inc. (AGI) have developed a plugin for Google Earth that tracks the position of more than 13,000 active and inactive satellites, debris and rocket bodies. The database updates every 30 seconds and is based on information maintained by the United States Strategic Command.
 A screengrab of Google Earth showing the position of WorldView-2 as reported by the AGI plugin.
Once you install Google Earth and open the KMZ file you can download here, you will be greeted by an almost overwhelming amount of data on orbiting space objects. In the Google Earth legend, you can toggle on and off the various classes of space objects. And by clicking on the moving icons, you can get information on the object’s orbital height, whether it is active and even on its projected trajectory.
One drawback is that this plugin does not have a search function. While there is no easy workaround for this oversight, here is what I can suggest. If you are looking for a specific satellite, you can search for its current location on this website, then zoom to that area in Google Earth and track it from there.
Until my next edition of Free For All, happy hunting for free geospatial goodies!
Brock Adam McCarty
Map Wizard
(720) 470-7988
brock@apollomapping.com
- For this month’s focus on technology, let’s take a look at recent advancements incorporating the ‘wonder’ material graphene–a single atom thick sheet composed of interlocking hexagonal carbon rings. A team of engineers at Rensselear Polytechnic Institute have demonstrated that replacing the traditional graphite in a lithium-ion battery with graphene can increase the charge/discharge rate by 10 times. To achieve these charge/discharge rates, graphene is shocked with an extreme flash of light to form cracks, pores and other defects in the surface. These defects allow electrons to travel through the graphene much quicker, hence the increased charge/discharge rates. Researchers at Northwestern University created a network of nano-channels which could be used to purify water and in batteries by stacking inexpensive sheets of graphene. In an advancement that could lead to lightweight and powerful artificial muscles, Duke University engineers discovered how to crumple and un-crumple sheets of graphene by attaching them to a thin layer of rubber. A group at Massachusetts Institute of Technology has shown that graphene has the ability to release multiple electrons after absorbing a single one–a property that makes it promising for solar panels, especially given its lightweight and that it is inexpensive to produce. And finally, some fun renewable energy news, like this soccer ball that generates energy as it is kicked, charging a battery which can then power a lamp at night! Or how about this gravity-powered LED lamp that costs $5 and lasts 30 minutes on a single 3 second charge?!
 A screengrab of the night sky over Boulder, Colorado as seen in Planetarium.
- Who doesn’t enjoy gazing at the night sky? Well I certainly do and this highly interactive website, Planetarium, makes the viewing experience all the better. Users are able to change locations easily, move through the night and see how the constellations change. Every star that is part of a constellation has information on its distance from our planet and its magnitude. The maker of this website also has some other gems to check out, such as Fractal Zoomer and Imagination.
- In honor of my favorite sporting event of the year, the NCAA Men’s Basketball Tournament, it would be sacrilegious not to feature this study done in 2006 by a team of two CH2M HILL employees. In their well known piece called Spatial Madness, Ward and Davenhall tried to see if there was a spatial component to predicting the winner of each tournament game. I will not ruin the article by telling you their conclusions–but I will say it is 100% worth the read even if you are only a casual bracketologist. Can you tell what I was doing when I wrote this snippet?!
- From the land of the SEC and the Razorbacks, we travel to Pac-12 country and explore the GIS resources of the City of Los Angeles, California. And let’s talk about the fun and joy that exploring their map data entails. First, it requires the installation a free viewer that I am guessing is not Mac compatible, you can download that here. Now, you can only access the GIS data using Internet Explorer 5.0 or newer. From there, you are supposed to be able to access at minimum streets and parcel information but I speak in theory as after an hour of struggling with just these two seemingly simple steps, I never did gain access to their online mapping services!
Brock Adam McCarty
Map Wizard
(720) 470-7988
brock@apollomapping.com
This month’s Free For All is a little off the beaten track for my usual articles, however, it has a major geographic component. This month I’m highlighting the Half the Sky Movement that works to bring awareness and resources to women and girls in developing countries with limited access to educational materials, medical resources and empowerment opportunities. The movement is spun off of a book of similar name, Half the Sky: Turning Oppression into Opportunity for Women Worldwide, by authors Nicholas Kristof and Sheryl WuDunn.
 As part of the Half the Sky game, you choose your next steps to gain points and move forward.
 By playing a game to collect books for the school, Pearson’s donated a book to an actual child in need.
The book narrates first-hand experiences of women and girls who face overwhelming oppression and injustice. The movement doesn’t stop at just a book, the story continues through a PBS series highlighting women in Africa, the Middle East and Asian countries ; and their fight to end oppression and empower women in their communities. The series features popular celebrity advocates and aims to present viable, long-term solutions.
The Movement recently released a Facebook game to raise awareness and funds to support their cause. The game is set up as a walkthrough, you start by playing a woman by the name of Radhika in India. You are presented with a number of common obstacles–e.g. a sick child with no money for medicine and transportation, or not enough books in the classroom–you then have to decide what actions to take. Along the way, you play games to collect food to sell and books to donate. By completing obstacles and goals, you have opportunities to donate to specific projects. As you progress through the game, sponsors will donate gifts, like books to actual children who don’t have the resources. The game itself is very well made, with colorful graphics and smooth transitions. The dialogue is engaging as well as informative.
Half of the Sky also creates mobile games for people in India, Kenya and Tanzania, with the aim to educate women on healthy eating while pregnant, to avoid intestinal worms and to empower girls to rethink their value to family and society.
Half the Sky is a movement in both the organizational and physical sense. It has created major momentum by reaching a wide number of viewers, participants, activists and celebrities across a variety of platforms . Their Facebook game is a win-win for everyone as the public is educated about Half the Sky and the work that they do, while being entertained and giving back to the organization and their cause.
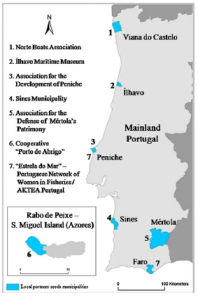 This graphic shows the seven focus sites for the Celebration of Coastal Culture study. Each agency was integral in the collection of data and establishing local contacts.
Researchers at universities in Portugal recently completed a study that examined the role of culture on the coasts of Portugal. Their goal was to document maritime cultural heritage in the many fishing ports that dot the country’s coastline. Through interviews and the use of GPS data collection to illustrate site maps, Souto, Gomes and Carvalho set out to paint a picture of Portugal’s rich culture. The researchers considered multi-functionality when examining the social, economic and environmental development of the region. Recent focus on regulation of primary sector areas, such as food production, and the social exclusion of rural producers from the larger regulatory picture, sparked the authors to tell the story of those who still follow traditional methods of living.
Their research coincided with a European Economic Area grant to fund the Celebration of Coastal Culture project which included seven Portuguese coastal communities. The project was promoted and managed by an insurance company established in the 1940s to specifically support the fishing industry. The seven communities were selected from numerous applicants to show the cultural significance of the fishing trade and to help assure its continuity in the next generation of Portuguese. Each of these communities already featured the local trade through museums, fishing boat preservationist societies, women in fisheries groups and more.
 A cartographic representation of the GPS points collected by urban structures, geophysical features, etc.
The main goal of the study was to identify, catalog and make permanently available information on local and regional maritime-fluvial cultural heritage. The researchers also wanted to develop and implement new strategies for the recognition of cultural heritages along the coastal communities. Their collection of GPS/GIS data was grouped into various categories: geophysical data (e.g. rivers, topography); urban structures of dwelling and workplaces; “emotional” topological points (e.g. interview locations); landscape/architectural monuments (e.g. churches); and places deemed important to the industry (e.g. ports).
The use of GIS allowed for effective visualization of the compiled data which was in turn beneficial to building a case for the recognition of the historic and indigenous practices of these unique fishing communities. The researchers hope that the establishment of a website boasting the heritage of the study sites and participants will lead to outside involvement to document and sustain the practices and issues associated with the coastal communities. The authors did consider if tourism would help sustain the communities but concluded that more research was needed to study the potential environmental and cultural impacts. Ultimately, the study provided a foundation for participant action research so that outside investigators can work in tandem with locals to increase the vitality and quality of life for those who reside in the region.
Justin Harmon
Staff Writer
As approved resellers of DigitalGlobe, Apollo Mapping is proud to offer imagery products from the first-ever 30-centimeter (cm) natural color orthoimagery layer covering the lower 48 states of the United States of America as well as significant portions of Europe. Scheduled to be completed by mid-2013, this impressive dataset will cover more than 10 million square kilometers (sq km). Microsoft and DigitalGlobe have partnered on this long-term project, utilizing an exclusive aerial sensor–the UltraCamG–to collect the most accurate and visually appealing imagery available on the market.
The data included in the Precision Aerial imagery program can be grouped into three categories according to its collection and production specifications:
 Full resolution previews of natural color 30-cm DigitalGlobe aerial imagery obtained over Bloomington, Indiana during October 2011. (Image Courtesy: DigitalGlobe)
 Full resolution previews of natural color 30-cm DigitalGlobe aerial imagery obtained over Bloomington, Indiana during October 2011. (Image Courtesy: DigitalGlobe)


-
High Value Areas (HVAs)
- These are dense urban centers and tourist destinations
- No clouds, cloud shadows, haze, smoke or pollution
- A horizontal accuracy of 2.7-meters (m) Circular Error 90% (CE90%)
- Leaf-off is required
- Free from standing water with only permanent snow and ice
- Data is processed and color balanced across the entire market
-
Standard Blocks
- These are often suburban areas and smaller cities
- No clouds, smoke or pollution; and less than 2% cloud shadows and haze
- A horizontal accuracy of 4.0-m CE90%
- Leaf-off is desired
- Free from standing water with snow and ice only above the timber line
- Data is processed and color balanced by one-degree cells (~10,000 sq km)
-
Remote Blocks
- These are rural areas
- Minimal amounts of clouds, cloud shadows, haze, smoke, pollution, standing water, snow and ice
- A horizontal accuracy of 5.3- m CE90%
- Leaf-off is not available
- Data is processed and color balanced by one-degree cells (~10,000 sq km)
The following specifications are universal across the Precision Aerial imagery dataset:
- Both 30-cm natural color and 60-cm color infrared (CIR) products are available
- Color balanced, seamless orthomosaics
- A projection/datum of UTM WGS84
In this regular monthly piece, we will provide our readers with an update on the progress of DigitalGlobe’s Precision Aerial imagery program, current coverage maps and full resolution previews of the data. If you would like more details on the coverage available in your area and/or on the pricing of the various delivery options, an Apollo Mapping representative would be happy to assist and can be reached by phone at (303) 993-3863 or email at sales@apollomapping.com.
March 2013–Coverage Statistics & Maps
- Collections over the USA have been completed (minus the several restricted air spaces shown in purple on the map below); and are near completion in Europe
- 11,100,000+ sq km of 30-cm natural color and 60-cm CIR data acquired
- 11,000,000 sq km–loaded on DigitalGlobe’s cloud and streaming web services
- Key Areas Completed Acquisition
- Given that it is winter in Europe, no new acquisitions were made in January
In the coverage maps below of DigitalGlobe’s Precision Aerial imagery over the United States and Europe, we have indicated the outlines of the HVAs and blocks that are a part of this program. Each of these outlines is color coded to indicate its current acquisition and/or delivery status.
Have you had a chance to test out our online imagery search engine, Image Hunter?
If not, give it a test drive now as all orders placed with Image Hunter will receive a 5% discount!
We are very excited to announce that the high resolution satellites, Pléiades 1A and 1B and the medium resolution satellites SPOT 4 and SPOT 5 have been added to Image Hunter. With the addition of the Pléiades 1 constellation, you can now preview and order data from ever sub-meter multispectral satellite that is commercially available. We are excited about this change as it will save our Apollo Mapping clients significant time searching for and ordering both high and medium resolution satellite imagery.
Image Hunter can be accessed 24 hours a day, 7 days a week and is a one-stop shop for every major source of medium and high resolution satellite imagery on the market today, including:

- WorldView-2
- QuickBird
- WorldView-1
- GeoEye-1
- IKONOS
- The Pléiades 1 constellation
- SPOT 4 and 5
If any of our readers have struggled with other geospatial search engines that are clunky; only query one data source; and/or do not provide preview images, then Image Hunter is the solution to your woes, as it features:
- Near-instantaneous loading of low resolution preview imagery with associated collection date and key metadata.
- The ability to define your area of interest by address and with coordinates, geometric shape or shapefile/KMZ.
- A responsive base layer with street names and imagery to provide a spatial context when discovering data.
- Online ordering of satellite imagery from 3 data providers and 7 constellations.
- Global coverage with tools to measure distance and create annotated maps.
Image Hunter can be accessed here. If you would like a Quick Start Guide to get up and running, it can be downloaded here. We are excited to find out what you think about Image Hunter and any ideas you might have to improve the user experience–we can be reached anytime at (303) 993-3863 or at sales@apollomapping.com with these suggestions.