
In this, the second part of our examination of the mapping applications that changed the geospatial world, I pivot from last month’s history lesson to the positive and negative impacts that Google Earth and Google Maps have had on our industry. In 2005, my geospatial career started at DigitalGlobe shortly after the launch and addition of high resolution QuickBird imagery to both Google Earth and Maps–which is where this story will begin. As a quick recap, this two-part edition of the Geospatial Frequently Asked Question (G-FAQ), addresses this core set of questions:
How have Google Earth and Google Maps changed the geospatial industry? How and why were they created? How are Google Earth and Maps different? How will they change in the future?
In any discussion that hopes to discuss the impact of an idea or product, one needs to present both the positive and negative aspects as balanced as is possible. In some cases, the negative aspects can be taken as, well just that, negative rather than as part of a balanced discussion. With this in mind, I start this G-FAQ with the statement that I 100% appreciate everything Google Earth and Google Maps have done for the evolution of the mapping industry. I view each of these mapping applications as integral to the experience of geospatial professionals and casual map users alike–in fact, not a day goes by without my recommending clients use Google Earth and/or Maps to locate the latitude and longitude information required to order satellite imagery.
The Negative Impacts
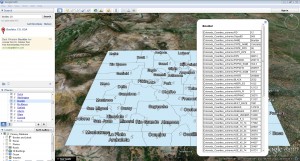 A screengrab of Google Earth showing a KMZ file of the counties in Colorado and the attributes you can tie to each county.
With that said, let me start with the negative impacts of Google Earth and Google Maps on the geospatial industry, and specifically with the largest impact as I see it: the devaluation of medium and high resolution imagery. Free imagery sources have long been part of the ‘mapping experience,’ take for example the Digital Orthophoto Quarter Quads (DOQQs) that the United States Geological Survey (USGS) has had available for download for many years now. But what makes Google Earth and Google Maps different is the amount of free data users can access in one location, nearly instantly and from the comfort of their office desk or family room couch–much of which was not free to start with. For example, the hundreds of millions of square kilometers (sq km) of high resolution imagery Google purchased from DigitalGlobe and GeoEye.
While natural color high resolution data from DigitalGlobe and GeoEye has a list price between $10 and $14 per sq km, users of Google Earth and Maps have come to expect that this imagery should be cheap or even free as it appears in these mapping applications. What these users do not appreciate is the tens of millions of dollars (I estimate well over $75 million since 2004) that Google has spent on employee salaries, IT hardware, satellite imagery, spatial databases, airplanes, cameras and so much more that has been required to build these amazing mapping applications. The enormity of the task of should be apparent to those who have followed Apple’s recent (failed) attempt at developing its own replacement for Google Maps. The free data in Google Earth and Google Maps not only devalues imagery, in some cases it means missed sales for resellers such as Apollo Mapping. Now it is not lost on me that one person’s folly is another person’s fancy, as a lost sale for Apollo Mapping means free data for someone else–and we all love free stuff after all!
Perhaps more universal concerns surrounding Google Earth and Maps are the security and privacy issues that were unheard of in the mapping industry before their launch. When I worked at DigitalGlobe in 2005, it was not uncommon for people to express outrage at the level of detail that was available in Google Earth over sensitive sites such as US Army bases, Washington DC and many urban centers around the world. While I appreciated the concern people expressed at the time, we did not have the contractual ability to control the imagery Google purchased and they maintained it was well within their legal rights to post the imagery online. From a personal perspective, I figured much of the concern was related to the ‘newness’ of the mapping applications as people had never had access to such high resolution data from a wide-variety of geographies; and with time, the emails did trail off as the novelty of high res data wore off. And then in 2008, the Mumbai massacre brought these security concerns to the forefront of media attention as one of the surviving attackers revealed that Google Earth was used to plan the deadly attacks. To this day, little has been done to address these security concerns; and in fact, if anything the resolution is improving in urban centers as users of Google Earth and Maps demand such.
When it comes to privacy concerns, most of them surround the street views that were added to Google Earth and Maps during May 2007. Users quickly found pictures of infidelity, crimes, drug use, solicitation and much more. And again, Google maintained that the street views were not a violation of privacy as they were captured during broad daylight in public locations. Regardless of where you stand on the issue, Google plans to add more street views in locations previously unmapped which is sure to only exacerbate the complaints of those who are concerned.
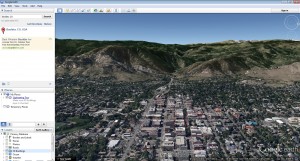 In a 3D world, you can tilt the view so that you get ‘perspective’ on a landscape. In this case, it is the view of the Front Range from about a mile above our office in Boulder, Colorado. You can see why scale does not work in a 3D world where the close up objects are larger and cover a much smaller area than the mountains in the distance.
From a corporate perspective, as they seem to do in many of the markets they enter, Google has also hurt the bottom line of mapping companies that do not focus on imagery sales as we do at Apollo. For instance, Google Earth and Google Maps maintain a dominant position in location based services with their early investment in mapping technology. But their competitors are not simply stepping back to let them continue this dominance, as can be seen by Apple’s failed attempt at their own mapping application. Another example is Nokia who has been in the mapping business for 25 years. They developed a True car mapping system to rival Google’s street views. Nokia’s True cars capture high resolution imagery from a street level and add in LiDAR which can be used to create extremely realistic 3D building models. These moves–which are more responses to Google’s dominance than leading–show that those in the mapping industry have taken notice of the advertising giant’s position in the marketplace.
From the perspective of a total GIS nerd (which both Katie and I qualify as!), Google Earth and Maps have changed the way that people talk about geography and define geographic areas. First there is the KMZ/KML file which is Google Earth’s replacement for the GIS shapefile. While a KMZ is highly portable being a single file, it is not as widely accepted in mapping applications as is a shapefile (though this is changing quickly admittedly), nor can they always be converted to another format. While conversion to another format might not be a huge issue for a casual user of Google Earth, it can be a large problem for a company such as Apollo Mapping who asks clients to define areas of interest with KMZs/KMLs. But again, we confront the dual nature of cause-and-effect in that while it is frustrating not to be able to convert or work with a KMZ file sent to me by a client, before Google Earth they could not have sent me a valid shapefile so we are really no worse off for it then!
Google Earth and Google Maps have not only changed the way we communicate geographic information with the KMZ, these mapping applications changed the concept of scale. In a top-down, 2-dimensional world of GIS, the concept of scale makes sense as it is a way to relate a distance on your computer screen to the real world. For example, a 1:2,000 scale means that one inch on your computer screen equals 2,000 inches in the real world (or about 167 feet). For a user of GIS, the concept of scale is a standardized way for fellow geographers to explain how far they are zooming-in or zooming-out on spatial data. Since the advent of Google Earth, it is more common for people to ask for data taken at an eye height of 2 miles rather than with a scale of 1:2,000. While this sounds minor, it can cause serious confusion when you are trying to get a client the correct data for their needs, as eye height has no relationship to scale and thus I cannot gauge the resolution they require.
Now in an effort to be even handed in my critiques of Google Earth, it should be stated that the concept of eye height is tied to displaying data in a 3D world, regardless of the application. Consider that in a 3D world you can tilt a look angle so that not every point on the ground below is equidistant from the eye. This means that objects closer to you look bigger and those farther away are smaller, as the ground you can see in the distance is also larger. Scale then by definition cannot apply to a 3D world as it requires equidistant measurements across the entire image. In 3-dimensions, you define a view of the ground by the X, Y and Z direction your eye is looking at as well as the height above the ground your eye would be. And once again, I think it is important to note that Google Earth and Google Maps were never invented as a replacement for GIS; and just because people use them that way, there is no reason to blame Google for the changes that may or may not happen in our GIS industry as a result of them. As a quick recap, Google Earth and Maps were invented to advertise to us and you have to admit they have been amazingly effective to that end.
Well now, this Part II of a two part G-FAQ has well turned into a much longer discussion than I had originally planned. As such, I will leave the conclusion of this series on Google Earth and Maps until next month!
Do you have an idea for a future G-FAQ? If so, let me know by email at brock@apollomapping.com.
Find Out More About This Topic Here
- Cracked–Mind-Blowing Google Earth Discoveries
- Daratech–Growth of the GIS/Geospatial Industry
- Google–Company History
- Google–Keyhole Acquisition
- Information Technology and Libraries–Academic Use of Google Earth and Maps (download)
- Mail Online–Changes to Google Maps Charges
- Mashable–Future of Google Maps
- The Atlantic–Google’s Michael Jones
- The Independent–How Google Earth Changed the World
- The New York Times–What Makes Google Maps Good
Brock Adam McCarty
Map Wizard
(720) 470-7988
brock@apollomapping.com

Marking the third successful satellite launch in just the past two years, Astrium Services announced on March 7th that Pléiades 1B is fully operational after only three months in space! The Pléiades 1 twins are able to image a combined 2 million square kilometers (sq km) per day with daily revisits to every location on the planet. With 50-cm resolution imagery, Pléiades 1 is the choice for projects requiring large-area coverage in short time frames.
For those who have never worked with Pléiades 1 imagery, here is a summary of the satellites’ key specifications:
- Spectral Bands: panchromatic & 4-band multispectral (RGB + NIR)
- Product Resolution: 50-cm panchromatic & 2-m multispectral
- Global Revisit Time: 1 day
- Footprint Width: 20 km (at nadir)
- Launch Dates: December 17, 2011 (1A), December 2, 2012 (1B)
To find out more about Pléiades 1 imagery and pricing, please contact the Apollo Mapping sales team at (303) 993-3863 or sales@apollomapping.com.
‘O happy Earth, reality of Heaven!
To which those restless souls that ceaselessly
Throng through the human universe, aspire!
Thou consummation of all mortal hope!
Thou glorious prize of blindly working will,
Whose rays, diffused throughout all space and time,
Verge to one point and blend forever there!
Of purest spirits thou pure dwelling-place
Where care and sorrow, impotence and crime,
Languor, disease and ignorance dare not come!
O happy Earth, reality of Heaven!
– An excerpt from Percy Bysshe Shelley’s Queen Mab
For as long as humankind has been on this planet we have looked to the stars with curiosity and reverence. Even now our Universe is beyond our understanding and comprehension. As our technology becomes more advanced, we are capable of seeing universal phenomenon with more fidelity, often making me second guess if the images are actually artistic interpretations. And yet there are still a plethora of objects and events that are specks in the distance. We know they are occurring, however it is difficult to visualize them with any detail.
This is where astronomical artists hit the scene. With their paint brushes and computer animations, they create intense scenes of alien planets and galactic explosion. These artists bring to life what our imaginations are not capable of illustrating. Planets that are void of life, yet explode with volcanic eruptions and meteor collisions. Gases and cosmic dust rise like plumes or spiral in all directions from star-spawning nebula.
Lucien Rudaux is one of the first known astronomical artists, creating alien landscapes in the late 1800’s. His paintings were more realistic then spectacular. He depicted the moon as it really was, with gradual slopes instead of precipitous cliffs. His landscapes are prudent even today, with great detail and soft colors.
David Hardy has been making space art since the 1950’s. He created illustrations for a number of publications including books and magazines, and has even published a science fiction novel, Aurora: A Child of Two Worlds. Many of these space artists also illustrate science fiction and fantasy works along with hypothetical drawings of planets breaking apart or asteroids colliding with earth. Some of my favorite off-shoots are dinosaur depictions.
Mark Garlick began with galactic paintings, has tried his hand at digital images and has recently done a number of animations. HIs pieces include some comparing the size of the planets and stars, another of a black hole and one hypothesizing how Mars would look after terra-forming. There are a number of artists that contribute to this body of work. You can find more information about astronomical artists and their work at the International Association of Astronomical Artists,
In this monthly feature, we span the globe to examine Our Changing Landscape with time series of medium resolution RapidEye satellite imagery. The RapidEye archive dates back to late 2008 and already contains more than 4 billion square kilometers of data. This month, we look the bloom of lavender fields in the French province, Alpes de Haute.
The RapidEye Constellation
RapidEye is a constellation of five 5-meter medium resolution satellites each offering five spectral bands of information. The RapidEye constellation offers a daily revisit time to every location on the planet with a huge footprint that is 77-km wide. The data is priced competitively with a base price of $1.28 per square kilometer for all five spectral bands–academics do receive discounts. RapidEye adds a fifth band, the red edge, to the ‘traditional’ multispectral set of blue, green, red and near-infrared (NIR). The additional spectral data available in the red edge band allows users to extract more useful land ‘information’ than can be from traditional 4-band imagery sources. When RapidEye imagery is ordered as a Level 3A Orthorectified product, images from multiple dates are extremely well registered, making it the ideal data source for Our Changing Landscape.
French Lavender Fields–Alpes de Haute Provence
 Click on the image above to see an animation of 5-meter natural color imagery over rural Thoard, France from May 29, July 28, August 13 and September 5, 2009. (Images Courtesy: RapidEye)
What we commonly call lavender is actually a collection of 39 plant species that are part of the Lavandula genus. Lavender flowers range in color from white to pink to purple, and the common French species are a brilliant purple. Oil produced from lavender flowers has been used by humans for at least 2,500 years for cooking and bathing as well as in medicine and scented products. While exact figures for lavender harvests are hard to find, according to French government estimates (i.e. ONIPPAM), France accounts for more than 60% of global production. Within France, the Alpes de Haute Provence has the largest number of cultivated lavender fields covering more than 10,000 hectares or 30% of the national total.
French lavender fields are typically planted as cuttings from a mother stem in the Spring. A lavender plant takes three years to reach its full size. The flowers are ready to harvest when they are the most bright and vivid in color which makes them an excellent target for this Our Changing Landscape. Lavender flowers are best cut in the cool of the morning once the dew has dried. In the Alpes de Haute, June to late August is harvest time, with the exact date influenced by relative humidity, longitude and altitude. In the area around Thoard, France, which is where this series of RapidEye images comes from, August 15th is a common harvest date.
If you would like to find out more about using RapidEye for your academic studies, engineering projects or any landscape analysis, let us know at sales@apollomapping.com or (303) 993-3863.
The Planck spacecraft was launched into orbit on May 14, 2009. While it reached orbit a number of years ago, it continues to make astonishing discoveries about the age of the Universe. Ever since the Big Bang light has expanded from the center of the Universe outward. The Planck mission was launched to measure (in greater detail) the variations in the oldest light. Greater fidelity into the cosmic microwave background advances our understanding of the Universe’s age, mass, size, geometry and composition. The most monumental question still to be answered is whether or not the Universe will continue to expand or eventually collapse on itself.
The most recent map derived from Planck satellite data suggests that the Universe is actually older then the most recent estimates by 100 million years. This may seem like a terribly long time to us; however, it has taken that light 13.8 billion years to reach our eyes. The map data is full of new information that scientists are using to unravel more puzzles about our Universe. For example, while the amount of dark energy appears to be less than originally believed, the amount of normal and dark matter is now believed to be more than original estimates.
The Planck satellite makes these discoveries look rather easy, it takes a couple images and BAM!, a new breakthrough. The supercomputer at the Department of Energy would have a thing or two to say about that. While Planck has taken roughly 1,000 images of every point in the sky, the supercomputer has analyzed all of these images.
And analyzing all this data is not a simple task! For one, Planck is imaging light that is behind most of the objects in the Universe, and as you can imagine there are more than enough objects to make this a difficult task. Another major problem is feedback from Planck’s own detectors. Due to their high sensitivity and noise creation, the supercomputer has to isolate this digital noise and remove it from the raw data. The supercomputer has performed these calculations on about a trillion points, and I’m not being demonstrative.
On any other computer this would be an impossible task, I’m sure we can all imagine how many blue screens would pop-up. The supercomputer at the Department of Energy is one of the fastest in the world, making a quintillion calculations per second and was certainly up to the task. With tens of thousands of processors, the supercomputer can sift through all of the data in just a couple weeks, bringing the new Planck map of the Universe to fruition.
The Tianfeng Tower in Ningbo, China was originally built during the Tang Dynasty in the late 7th Century, then again rebuilt during the Song Dynasty in the mid 1th Century, and finally reconstructed for the last time in 1989. It is part of the Cheng Huang Temple Complex (or “city god’s temple”) that is largely reminiscent of the complex that resides in Shanghai. Ningbo is slightly less than 150 miles from Shanghai, the largest city in the Republic of China, and the most populated on Earth. Ningbo is no village though, it has over 7 million inhabitants. The Tianfeng Tower (sometimes referred to as the Tianfeng Pagoda) is the tallest ancient structure in the city at just over 50 meters, with seven stories being above ground and seven below. Its original construction was heavily dependent on large piles of silt to prop up the bricks used to make the tower; and due to the excess of silt brought in for the project, they created two streets bordering the infrastructure–both properly named in Chinese as “big silt street” and “small silt street.”
 Mightier that its short stature would indicate, the Tianfeng Tower is a symbol of China’s staying power. Re-developed throughout the centuries, the Tower is a vivid reminder of China’s resiliency. This photo enhanced image was captured by WorldView-2 on November 27, 2011 and appears courtesy of DigitalGlobe.
 From high-atop the Westin hotel in Ningbo, you can see the progress of the mighty city. Opposite its face is what looks to be a giant “C”; perhaps indicating the country’s stamp on the world as a true player for the future. This photo enhanced image was captured by WorldView-2 on November 27, 2011 and appears courtesy of DigitalGlobe.
Ningbo’s history is rich. Since the Tang Dynasty it has been a key port for the nation, and it has also become a major center for technology and development. Geely, a Chinese car manufacturer, is set to build a $400 million dollar powertrain manufacturing center in the city with construction set to be completed by 2015. Geely is most well-known for its purchase of Volvo Cars in 2010. Another infrastructure project under way in the growing city is the Hangzhou-Ningbo high-speed railway. Set to begin operation this July, the railway will reach speeds of over 350 km/hour, reducing travel time by 36 minutes for those that commute the 150-km trek.
As alluded to above, the city has a history steeped in culture, change and revolt. During the Ming Dynasty in the mid-16th Century, what has become to be known as the Ningbo Massacre of 1542 took place. Portugal was heavily involved in the control of trade in many of the Asian countries at the time, and had created numerous settlements in the Ningbo area. The Portuguese treatment of the Chinese was far less than respectable, and it created an atmosphere of hostility between the two nationalities. The Portuguese’ practices included pillaging and enslavement, and the natives of Ningbo had had enough. A force of 60,000 Chinese troops came down upon the 1,200 Portuguese, and took Ningbo back for the motherland. This was not the only moment of conflict with Portugal, as later in the 1800s, there was the Ningpo Massacre, a collaboration with Cantonese pirates to attack Portuguese ships. The Portuguese had been raiding ships in the ports of Ningbo, and action had to be taken.
It seems obvious that relations between Portugal and China were at one time very strained, but as the decades have rolled by, the relationship appears to have improved. Portugal maintained its colony of Macau (the last remaining European colony in China) until 1999, and then returned its jurisdiction to China. After 450 years of colonization, Portugal took a major step to making amends with the eastern nation, and today their trade is largely based around cultural exchanges. In 2005, the two nations reaffirmed their ‘friendship’ through a formal doctrine.
Ningbo is a city that boasts both the old and the new. Home to the oldest wooden structure in Southern China, the Baoguo Temple, it was built around 1,000 A.D. Its origin is linked to Mahayana Buddhism, one of its two main branches. It is a structure that many with cultural or religious interests make pilgrimages to, and is the ‘other-side of the coin’ to the ever-growing industries that dot the Ningbo skyline. Progressive and timeless, Ningbo has a foot both in the past and in the future.
Justin Harmon
Staff Writer
In this monthly article, we provide details on updates released each month to Astrium GEO’s 2.5-meter (m) SPOTMaps product. SPOTMaps is an orthorectified natural color imagery layer with coverage over more than 100 countries–totaling an impressive 108 million square kilometers (sq km). For projects requiring a value-priced basemap better than what 15-m Landsat can offer, there is no other choice than SPOTMaps.
SPOTMaps Updates & New Areas–March 2013

 A 1.5-meter SPOT 6 natural color image collected over Augusta, Georgia, USA. In the coming months, SPOT 6 imagery will be used to create new SPOTMaps products. © CNES 2012, Distribution Astrium Services / Spot Image S.A., France, all rights reserved
- Portions of Chad are being added to the SPOTMaps database
- Nine (8) markets are currently in update, including portions of:
- Australia
- France
- Greece
- Iran
- Iraq
- Italy
- Kuwait
- Spain
For those who have never worked with SPOTMaps, below is a summary of key product specifications as well as product differentiators.
Key Product Specifications
- Resolution: 2.5-m
- Spectral Bands: simulated natural color (RGB)
- Horizontal Accuracy: 10 to 15-m RMSE (root mean square error)
- Projection/Datum: UTM WGS84
- Source Data: SPOT5 satellite imagery
- File Format: GeoTIFF
Product Differentiators
- Recent and ready for immediate delivery and integration with your GIS
- Seamless, orthorectified coverage across countries and entire regions
- Suitable for work up to 1:10,000 scale
- Custom product framing with minimum orders of ~100 sq km
- Product series is updated every month
- Source data can be delivered with all SPOTMaps mosaics
- Volume and academic discounts are offered
- Multi-user licenses are available
- In the coming months, new 1.5-meter SPOTMaps data made with natural color SPOT 6 and SPOT 7 imagery will be made available
The map below has been color coded to show the collection year which makes up the majority of each SPOTMaps mosaic as well as those markets that were updated this month. An Apollo Mapping representative can provide more details on the specific year ranges used in each mosaic.

If you would like pricing details and/or additional product details, such as date ranges and accuracy specifications, please let us know at sales@apollomapping.com or (303) 993-3863.