
The Pléiades 1 constellation (or at least part of it!) has been in orbit since December 2011 and if you have not had a chance to check out any sample imagery, take a few moments and have a look at the gallery on our website. If you work with high resolution imagery, you should consider Pléiades 1 for your next geospatial project.
A variety of Pléiades 1 products are available from both a growing archive and as a new collection, including 50-centimeter (cm) pansharpened imagery and 50-cm panchromatic–2-meter (m) 4-band multispectral bundles. We are happy to discuss the technical specifications, pricing and tasking options available with this new satellite constellation as Pléiades 1A has been joined in space by its twin, Pléiades 1B, which is now fully operational.

 © CNES 2012, Distribution Astrium Services / Spot Image S.A., France, all rights reserved.
Working with Pléiades 1 for the past year plus, we have noticed that:
- Astrium is able to deliver on their tasking feasibilities.
- The data is crisp with excellent color saturation so that it is on par with competitors’ 50-cm satellites.
Tasking with Pléiades 1
Now that Pléiades 1B is operational, the constellation features daily revisits to every location on the planet with 2 million square kilometers of daily collection capacity. To say that the Pléiades 1 constellation can collect imagery rapidly is a vast understatement.
Pléiades 1 Sample Imagery
This month we feature stunning sample imagery collected by Pléiades 1A over East London, South Africa. If you would like to compare the resolution of Pléiades 1 imagery to SPOT 6, you can find more East London samples in this article at 1.5-meter resolution. We enhanced this 50-cm natural color imagery to improve its colors and sharpness and the results speak for themselves.
Our Contact Details For More Information About Pléiades 1
The Apollo Mapping sales team can answer any questions you might have about the high resolution satellite constellation, Pléiades 1. We can be reached anytime at (303) 993-3863 or sales@apollomapping.com.
More sample images and technical information about Pléiades 1A and 1B can be found on our website here.
Are you in need of a rapid, new collection over a time-sensitive project you are working on?
Or perhaps you need to monitor a construction project in a foreign country?
Do you need imagery that is more recent than the high and medium resolution satellite archives offer but don’t have $2000+ in the budget for tasking?
If you answered yes to any of these questions, then you should consider the EROS A and B satellite constellation for your next project. With the lowest minimum order price for a new collection of high and medium resolution satellite imagery, the EROS constellation is a viable solution for those in need of rapid tasking that is budget friendly.
The EROS satellite constellation delivers panchromatic-only imagery to assure maximum tasking capacity and thus quicker collections of newly tasked data. For our readers who have not worked with panchromatic imagery, it is an excellent substitute for any project that requires natural color data. Admittedly, if your project includes spectral analysis that relies on multispectral bands, then EROS imagery is not an appropriate choice. Here are some instances where panchromatic EROS imagery is an ideal choice:

A 67-cm panchromatic EROS B image collected over New York City, New York on September 23, 2007.
- Regional mapping projects
- Site monitoring over remote construction sites
- Elevation models where project timelines are short
- Planning a demographic survey before you arrive on site
- Updating a GIS database with current imagery over high growth areas
- Collecting new imagery over areas that traditionally have high competition
As many of our clients know, there seem to be an ever-increasing number of high and medium resolution satellites in the commercial marketplace. This can make it challenging to decide what satellite is the correct choice for your project. Here are the features that we believe separate EROS A and EROS B from the competition:
- The lowest price minimum order for a new mono collection of satellite imagery.
- Reasonably priced rush tasking with a guaranteed attempt within 5 days of start collect.
- 5-meter elevation models delivered in short time frames.
- Competitively priced stereo and triplet tasking.
- A 10% discounts for academic research and teaching.
Archive data is also available from both EROS A and EROS B. Given that the EROS constellation focuses on new collections, the archive tends to be highly focused over key areas of interest. The Apollo Mapping sales team is happy to assist with any archive searches you might need for historic EROS A and B data.

A 2-m panchromatic EROS A image collected over New York City, New York on May 3, 2002.
Key Specifications of EROS A
- Launch Date–December 5, 2000
- Spectral Bands–panchromatic only
- Resolution–2.1 meter (m, varies with orbital height and off-nadir angle)
- Revisit Time–~3.5 days (varies with latitude and off-nadir angle)
- Swath Width–15 kilometer (km, varies with orbital height and off-nadir angle)
- Bit Depth–11-bits
- Orbit Height–550 km (varies about this average)
Key Specifications of EROS B
- Launch Date–April 25, 2006
- Spectral Bands–panchromatic only
- Resolution–70 centimeter (varies with orbital height, off-nadir angle and imaging mode)
- Revisit Time–~3.5 days (varies with latitude and off-nadir angle)
- Swath Width–7 km (varies with orbital height and off-nadir angle)
- Bit Depth–10-bits
- Orbit Height–510 km (varies about this average)
For more information about the EROS constellation, pricing requests or tasking feasibilities, please contact the Apollo Mapping sale team at sales@apollomapping.com.
Have you had a chance to test out our online imagery search engine, Image Hunter?
If not, give it a test drive now as all orders placed with Image Hunter will receive a 5% discount!
We are very excited to announce that in April, the newly operational medium resolution satellite, SPOT 6, was added to Image Hunter. With the addition of SPOT 6 imagery, you can now preview and order data from 10 commercial satellite platforms in a single location.
Image Hunter can be accessed 24 hours a day, 7 days a week and is a one-stop shop for every major source of medium and high resolution satellite imagery on the market today, including:

- WorldView-2
- QuickBird
- WorldView-1
- GeoEye-1
- IKONOS
- The Pléiades 1 constellation
- SPOT 4, 5 and 6
If any of our readers have struggled with other geospatial search engines that are clunky; only query one data source; and/or do not provide preview images, then Image Hunter is the solution to your woes, as it features:
- Near-instantaneous loading of low resolution preview imagery with associated collection date and key metadata.
- The ability to define your area of interest by address and with coordinates, geometric shape or shapefile/KMZ.
- A responsive base layer with street names and imagery to provide a spatial context when discovering data.
- Online ordering of satellite imagery from 3 data providers and 10 satellites.
- Global coverage with tools to measure distance and create annotated maps.
Image Hunter can be accessed here. If you would like a Quick Start Guide to get up and running, it can be downloaded here. We are excited to find out what you think about Image Hunter and any ideas you might have to improve the user experience–we can be reached anytime at (303) 993-3863 or at sales@apollomapping.com with these suggestions.
Many times I wonder what comes first in regards to NASA acronyms, the ultimate chicken and egg question. This month’s Reaching Orbit is a great example of this quandary. The Synchronized Position Hold, Engage, Reorient, Experimental Satellites (SPHERES) is undergoing a new experiment called the Visual Estimation and Relative Tracking for Inspection of Generic Objects (VERTIGO). See, I wasn’t kidding. Despite the acronym overload, the experiment itself is very interesting.
To begin, the SPHERES experiment involves the use of three sphere-like satellites. These are not what you would normally imagine when you think of satellites as they are orbiting the Earth only in the sense that they are flying aboard the International Space Station (ISS). These three stooges fly inside the ISS performing flight formations and docking maneuvers. SPHERES is a test bed for a number of algorithms related to satellite flight including collision avoidance, attitude control, re-targeting and fuel balancing. Basically, it allows for testing of maneuvers in microgravity, serving as a miniature test ground with low cost and chance for loss of expensive instruments due to failure in space.
VERTIGO is an experiment that takes advantage of the SPHERES’ capability, giving the satellite a set of eyes. The intention is to equip the satellite with the ability to visualize its surroundings, to create a 3-dimensional model of an object in microgravity. While I’m sure it was strange to watch polyhedron spheres maneuvering in the ISS, spheres with eyes borders on the surreal. Like something out of a sci-fi movie or possibly an animated film, it’s reminiscent of Hal in a Wilson disguise. The set of eyes allows VERTIGO to essentially create stereo images that are then processed into a 3D model. All of the algorithm processing and data crunching happens within the VERTIGO goggles which are basically a small laptop computer. VERTIGO consists of two SATA flash drives, two wireless antennas, a control panel, an ISS Nikon battery, a detachable optics mount with the added advantage of an avionics stack.
The intention of the VERTIGO experiment is to allow the SPHERES to maneuver based on their surroundings, not just programmed flight paths, giving them the ability to process their environment and navigate accordingly. VERTIGO can also be used to image objects in space that are difficult if not impossible for astronauts to investigate safely. VERTIGO technology would allow free-flying satellites to get ‘up close and personal’ with objects like asteroids and to map their surfaces with reduced cost and danger. The VERTIGO experiment has just undergone its first tests aboard the ISS and has performed adequately for its first time out. Pretty ‘neat-o burrito’ in my book!
In this monthly feature, we span the globe to examine Our Changing Landscape with time series of medium resolution RapidEye satellite imagery. The RapidEye archive dates back to late 2008 and already contains more than 4 billion square kilometers of data. This month, we look at Brazilian preparations for the next FIFA World Cup in 2014.
The RapidEye Constellation
RapidEye is a constellation of five 5-meter medium resolution satellites each offering five spectral bands of information. The RapidEye constellation offers a daily revisit time to every location on the planet with a huge footprint that is 77-km wide. The data is priced competitively with a base price of $1.28 per square kilometer for all five spectral bands–academics do receive discounts. RapidEye adds a fifth band, the red edge, to the ‘traditional’ multispectral set of blue, green, red and near-infrared (NIR). The additional spectral data available in the red edge band allows users to extract more useful land ‘information’ than can be from traditional 4-band imagery sources. When RapidEye imagery is ordered as a Level 3A Orthorectified product, images from multiple dates are extremely well registered, making it the ideal data source for Our Changing Landscape.
Building of the Estádio Nacional de Brasília
 Click on the image above to see an animation of 5-meter natural color imagery collected over Brasilia, Brazil on July 28, 2009; July 24, 2010; August 31, 2011; April 20, 2012; and March 7, 2013. The site of the new stadium, Estádio Nacional de Brasília, is in the upper-right of the animation. (Images Courtesy: RapidEye)
On October 30, 2008, Brazil was awarded the hosting rights to the 2014 FIFA World Cup. This will be the second time the nation hosts the Cup, the first time was in 1950 when Uruguay beat Brazil 2 -1 in the final match. Twelve cities were chosen to host the 2014 football games, requiring the construction of six new stadiums, upgrades to five and the demolition and reconstruction of one, Estádio Nacional Mané Garrincha in Brasilia. As of December 2012, Brazil had spent $3.5 billion on preparations for the 2014 World Cup, a full $1 billion over initial estimates with still months of construction left to go.
Brasilia is located in central Brazil with a population of approximately 2.6 million. Estádio Nacional Mané Garrincha was built in 1974 with a capacity of 51,000 fans. Mané Garrincha was demolished in 2010 to make way for the new 70,042 seat stadium, Estádio Nacional de Brasília, which will host seven 2014 World Cup games. The new stadium is the second largest site for the 2014 games, the largest being Estádio Mário Filho which holds 78,000+ in Rio de Janeiro. None of Estádio Nacional de Brasília’s 70,000+ seats will have obstructed views of the 105 meter by 68 meter pitch covered with Bermuda grass grown in the coastal state of Sergipe. The new stadium will be surrounded by 30,000 parking spaces.
As of March 26th, Estádio Nacional de Brasília was 94% complete despite financing issues and nationwide strikes. The final cost of the stadium is expected to be $1.015 billion which is 25% over the initial estimate. The stadium should open a month late, hosting its first match on May 25th between Brazilian professional football clubs Santos FC and Clube de Regatas do Flamengo. In the time series of RapidEye images that accompany this article, you can see the original stadium, its demolition and then the construction of Estádio Nacional de Brasília.
If you would like to find out more about using RapidEye for your academic studies, engineering projects or any landscape analysis, let us know at sales@apollomapping.com or (303) 993-3863.
The Southern Minnesota Beet Sugar Cooperative (SMBSC), based in Renville, Minnesota, utilized 5-meter 5-band RapidEye imagery purchased from Apollo Mapping to calculate the harvested acreage of sugar beet fields. This question and answer series was completed with Jody Steffel, Statistical Assistant, during April 2013.
Question 1: Can you provide me with an overview of your project, its duration and the study sites?
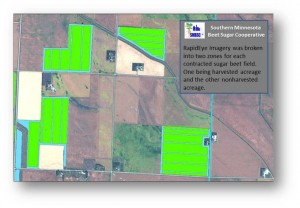
This study used 5-meter 5-band RapidEye imagery to predict harvested acres from multiple imagery dates for sugar beets in Minnesota. Our specific study site was in Central and Southwestern Minnesota and included 20 counties. The study spanned the fall of 2012 from August 28 to October 11. As seen in the image provided, fields with nonharvested acreage are colored bright green while bare ground or harvested acreage is blue.
Question 2: What groups were involved with this research project?
This project was completed by the Southern Minnesota Beet Sugar Cooperative and the information extracted from the RapidEye imagery benefitted all of our member growers. The SMBSC operates a grower-owned sugar factory that is located on a 1 square mile plot of land in south-central Minnesota. Construction of the plant started May 1973 and was originally designed to process 6,500 tons of sugar beets. Today, after several expansions, the plant can process 2.6 million tons of beets a year. These beets are grown on 119,259 acres of Minnesota land by 587 shareholders, covering an area that is 110 miles north to south and 100 miles east to west.
Question 3: How was satellite imagery used in this project?
Our project used satellite imagery to calculate the acreage of harvested (bare ground) versus nonharvested sugar beet canopy. This information allowed us calculate the difference of total acreage classified as bare ground from contracted total field acres to determine the acreage remaining to be harvested. This information, combined with up-to-date delivery records, allowed for an estimate of tons per acre before the sugar beet harvest was completed. These results helped to determine possible sugar beet pile heights at receiving stations and the final size of the crop to make the best management decisions possible.
Question 4: What technology and/or software packages were used to complete the geospatial analysis required for this project?
We utilized Esri’s ArcMap along with a customized tool built specifically for this project to calculate bare ground versus canopy. For infield testing, the geospatial layers, which included the RapidEye imagery along with the classified land cover vectors, were viewed on a GPS unit to verify the locations of the bare ground and canopy strips within the test fields.
Question 5: How did Apollo Mapping contribute to this project?
Apollo provided us with RapidEye satellite imagery in a timely and efficient manner, as well as expertise regarding the availability of other satellite products. We purchased 5-meter 5-band RapidEye imagery from Apollo Mapping at timed intervals, which included multiple tiles and dates, in order to cover key sections of our larger growing area.
Question 6: Could you tell us a bit about your experience working with the Apollo Mapping sales team?
and Apollo Mapping provided exceptional service, going above and beyond in their efforts to provide information on available geospatial products and secure them for our use. This project was intended to be as close to ‘real-time’ as possible to support accurate harvest acreage predictions and final yield estimates. Katie worked very hard in providing us quick turn-around time from the moment the image was taken to the delivery of the product to us.
 A 50-cm Pléiades 1A natural color image collected over Augusta National Golf Club, Georgia on April 13, 2013, Moving Day at the Master’s PGA Golf Tournament and photo enhanced by Apollo Mapping. © CNES 2012, Distribution Astrium Services / Spot Image S.A., France, all rights reserved
It’s Saturday, April 13th, 11:07 AM at the Master’s as Keegan Bradley and Brian Gay have just stepped up to the first tee to open their Third Round at the 2013 Master’s, often referred to as Moving Day. Tiger Woods and the rest of the leaders are about two hours from their tee times and the crowds are already massing around each of the iconic holes.
As this scene unfolded, Astrium GEO’s 50-cm satellite, Pléiades 1A, was high overhead on its orbit through space and it collected gorgeous cloud-free data at exactly 11:07:40 AM Eastern time. In the color image that accompanies this article, you can see crowds of fans around nearly every hole, eagerly awaiting the arrival of their favorite players. This overhead image has rarely if ever been seen by the general public as air space over Augusta is restricted during the Master’s Tournament. We hope you enjoy the image–we certainly did!
 Above is a map of naturally occurring salt deposits throughout the continental United States.
The United States is home to three types of natural gas storage facilities: depleted fields, aquifers and salt caverns. Depleted fields still hold more natural gas than any facility type, but since 2007, salt caverns have become the most common new sites for storage. Salt caverns offer several advantages. They are highly flexible in that they operate under extreme pressure making injection or delivery of natural gas a much quicker process. Salt caverns can also cycle gas more frequently; in other scenarios, there are just two seasons for injection (summer) and withdrawal (winter). Finally, salt caverns require a lower pressure for delivery of gas to customers. This helps to offset their slightly higher capital costs.
The first salt cavern created for storage was in Melville, Saskatchewan, Canada. Built in 1961, the 300,000 barrel cavern is 3,700 feet deep, and eventually led to the technology being used in the United States. In the 1970s, salt caverns were built in Louisiana, Mississippi and Alabama. These salt domes in the southern states were naturally constructed by the deposition of salt in an ancient marine basin. The salt caverns are also used for the disposal of non-hazardous oilfield wastes (NOW), and fall under the oversight of the Safe Drinking Water Act’s Underground Injection Control (UIC) program. There are five levels of hazard classification for injection wells, with the most serious being Class I–i.e. the injection of hazardous and radioactive wastes under a drinking water well. Class II wells, including waste from injection for bringing natural gas to the surface, have been an issue lately as well as they are linked to the debate about ‘fracking’ and its environmental costs.
As stated earlier, salt caverns are created in existing salt domes, many of which were formed some 30 million years ago. When they are created by humans, their locations have been given much thought. Depth to the salt layers, proximity to population centers and future land-use in the area are all considered when designating a salt cavern storage site. In Texas alone, there are 11 caverns at 7 different sites throughout the state. All were selected to minimize the potential for groundwater contamination and/or leakage.

Above is the Texas Midland Basin stratigraphy showing bedded salts in the region.
Once a salt cavern is build or a naturally occurring dome is selected, they are filled with brine and then wastes are injected as a slurry with water and brine. The caverns act as separators, sending hydrocarbons to the top and wastes settle on the bottom. Once a cavern is filled, it is closed in a process where plugs surround water-bearing areas. Over time, pressure builds as gas is formed through bacterial degradation and corrosion. Even though salt is highly impermeable, some of the gas can seep into the formation over time due to the underground pressurization.
While there are few situations where leakage might occur, here are several likely scenarios: inadvertent access; failure of a cavern seal; leaky soluble areas; or cavern roof collapse. Naturally occurring radioactive materials (NORM) can be highly hazardous; however the potential of salt caverns for long-term storage of both fuel sources and waste may be our best, and safest, bet for future energy needs.
Justin Harmon
Staff Writer