
The country of Belarus sits nestled between Russia, Latvia, Lithuania, Poland and the Ukraine. Its capital, Minsk, is located in the north-central portion of the nation, situated alongside the Svislach and Nyamiha Rivers. The Nyamiha was once a powerful river, but due to an urban containment project in the mid-20th Century, the majority of its water is now diverted into a pipe system. The city itself has centuries of history, dating back to its association with the Grand Duchy of Lithuania in the late 13th Century, and formally becoming a town in 1499. For several centuries, the town was governed by the Polish-Lithuanian Commonwealth, an expansive territory of 400,000 square miles and 11 million inhabitants between the 16th and 17th Centuries. Even though it was ruled by a monarch, the political system was ahead of its time being that it relied on a strict system of checks and balances from a nobility-elected legislature. The next several centuries were marked by contention for the region with the Russians, and its leadership saw several exchanges of power. Belarus did not gain its sovereignty until 1990.
 According to archaeological records, the Trinity suburb was first inhabited in the 12th Century, centuries before it became a city. Not much of the Old World is apparent here as modernity has taken hold. This 50-cm image was captured March 7, 2013 by WorldView-2, and comes courtesy of DigitalGlobe. Photo enhanced by Apollo Mapping.
 Construction along the downtown streets of Trinity Hill indicates that the area is thriving. There has been a push for restoration of fallen religious centers by various organizations over the last few years, and we can see the efforts in play here. This 50-cm image was captured March 7, 2013 by WorldView-2, and comes courtesy of DigitalGlobe. Photo enhanced by Apollo Mapping.
During the Soviet war in Afghanistan which took place primarily in the 1980’s, the natives of what eventually became Belarus played a huge part. Contributing some 30,000 troops to the efforts, 771 Belarusians fell during the nine year war. In 1991, the Minsk city government started the planning stages for a memorial to commemorate those who fought and lost their lives in battle, that eventually became the Island of Courage and Sorrow, and is commonly referred to as the Island of Tears by the locals. There sits a beautiful monument depicting statues of mourning women who are said to be the mothers of the men lost in battle. There is also a guardian angel that is said to represent the Afghans who lost their lives in the struggle for their homeland. Situated on Trinity Hill, the oldest surviving district in Minsk, the area was named for the Trinity Convent which no longer exists. The first Roman Catholic Church in Minsk also formally resided there, but it and another prominent monastery are now forgone relics of the past.
Gorbachev introduced the idea of “Glasnost” in the late 1980’s, essentially it was a call for openness and transparency in government institutions. Commonly paired with “Perestroika,” or restructuring, these terms were supposed to be the direction the new Russia would take. And while Belarus gained its independence, it still tries to abide by these philosophies. Though there have been some setbacks since its inception, including an economic crisis in the 1990’s, now that the city has reached its 950th anniversary, it continues to make pace for becoming a place for tomorrow. As the region around it develops on the world-stage, the people of Minsk will hold true to the motto engraved on the monument at the Island of Tears: “This Temple and Memorial was erected to the Sons who died in Afghanistan on the instruction of Belarusian mothers who want no evil to reign in their native land or in any other land.”
Justin Harmon
Staff Writer
Have you heard the news that DigitalGlobe made price changes recently that will affect many of our clients? If not, take the time to read this short article and then send us an email for additional information.
The DigitalGlobe pricing changes will impact satellite imagery products from GeoEye-1, WorldView-1, WorldView-2 and QuickBird. Any quotes sent out before the price changes will be honored on a per case basis.
To find out more about the price changes, please email the Apollo Mapping sales teams at sales@apollomapping.com. One exciting change we can announce in our newsletter is a 30% academic discount on all of the combined imagery and elevation products offered by DigitalGlobe.
 This map shows the areas imaged by Pléiades 1A/1B from January 1 to March 31, 2013 over mainland India (in dark blue). Please note that in many instances, multiple images were collected over the same area which is difficult to portray on this static map.
In this monthly piece, we give our readers a sense of the high-resolution imagery coverage collected over a specified geography during a three month window. To do this, we pick a high resolution satellite, a defined time period and geography, and then report key statistics on the total amount of imagery collected in square kilometers (sq km). Without further delay, let’s jump into our analysis.
Graphic Region of Interest: mainland India (as defined in the accompanying map)
Land Mass Covered: 3,131,994 sq km
Time Period: January 1 to March 31, 2013
High Resolution Satellite: Pléiades 1A/1B
Mainland India Pléiades 1 Imaging Statistics
Total Area Collected: 703,309 sq km; ~7,815 sq km per day
Area Collected @ 20% or Less Clouds & 30 Degrees Off-Nadir: 643,971 sq km; ~7,155 sq km per day; 91.6% of total
As approved resellers of DigitalGlobe, Apollo Mapping is proud to offer imagery products from the first-ever 30-centimeter (cm) natural color orthoimagery layer covering the lower 48 states of the United States of America as well as significant portions of Europe. Scheduled to be completed by mid-2013, this impressive dataset will cover more than 11 million square kilometers (sq km). Microsoft and DigitalGlobe have partnered on this long-term project, utilizing an exclusive aerial sensor–the UltraCamG–to collect the most accurate and visually appealing imagery available on the market.

 Full resolution previews of natural color 30-cm DigitalGlobe aerial imagery obtained over Lawrence, Kansas on April 2011. (Image Courtesy: DigitalGlobe)
The data included in the Precision Aerial imagery program can be grouped into three categories according to its collection and production specifications:
- High Value Areas (HVAs)
- These are dense urban centers and tourist destinations
- No clouds, cloud shadows, haze, smoke or pollution
- A horizontal accuracy of 2.7-meters (m) Circular Error 90% (CE90%)
- Leaf-off is required
- Free from standing water with only permanent snow and ice
- Data is processed and color balanced across the entire market
- Standard Blocks
- These are often suburban areas and smaller cities
- No clouds, smoke or pollution; and less than 2% cloud shadows and haze
- A horizontal accuracy of 4.0-m CE90%
- Leaf-off is desired
- Free from standing water with snow and ice only above the timber line
- Data is processed and color balanced by one-degree cells (~10,000 sq km)
- Remote Blocks
- These are rural areas
- Minimal amounts of clouds, cloud shadows, haze, smoke, pollution, standing water, snow and ice
- A horizontal accuracy of 5.3- m CE90%
- Leaf-off is not available
- Data is processed and color balanced by one-degree cells (~10,000 sq km)
The following specifications are universal across the Precision Aerial imagery dataset:
- Both 30-cm natural color and 60-cm color infrared (CIR) products are available
- Color balanced, seamless orthomosaics
- A projection/datum of UTM WGS84
In this regular monthly piece, we will provide our readers with an update on the progress of DigitalGlobe’s Precision Aerial imagery program, current coverage maps and full resolution previews of the data. If you would like more details on the coverage available in your area and/or on the pricing of the various delivery options, an Apollo Mapping representative would be happy to assist and can be reached by phone at (303) 993-3863 or email at sales@apollomapping.com.
May 2013–Coverage Statistics & Maps
- Collections over the USA have been completed (minus the several restricted air spaces shown in purple on the map below); and are near completion in Europe.
- 11,100,000+ sq km of 30-cm natural color and 60-cm CIR data acquired
- 11,000,000 sq km–loaded on DigitalGlobe’s cloud and streaming web services
-
Key Areas Completed Acquisition
- Given that the sun elevation in Europe is still less than ideal, no new acquisitions were made in May
In the coverage maps below of DigitalGlobe’s Precision Aerial imagery over the United States and Europe, we have indicated the outlines of the HVAs and blocks that are a part of this program. Each of these outlines is color coded to indicate its current acquisition and/or delivery status.


Keeping with the theme of this month’s Geospatial Frequently Asked Questions, let’s explore several websites that might help you break into the geospatial industry. First, there is the old standby, a website with a ton of links to free job boards. I poked around and the best one I could find (well perhaps I am a bit biased as a former Buffalo) is found here and is managed by the University of Colorado Geography department. While this list is not 100% GIS or geospatial, many of the links are for jobs in related fields.
When I was looking to break into the GIS world, I focused my attention on larger companies figuring they would have more entry-level positions than would small firms. Perhaps I am correct with this assumption and perhaps not, either way, here are two large geospatial firms that commonly post entry-level positions:

- Trimble–a leader in position-centric technologies, Trimble has secured more than 1,800 patents in their 34 year history. The jobs you will find working for Trimble might not be based around GIS per say but they do frequently advertise entry-level positions for those with geographic and spatial skills in general.
- DigitalGlobe–a leader in the world of commercial satellite imagery, DigitalGlobe has more than 400 employees in offices spread across the globe. In fact, DigitalGlobe is where I started off my GIS career in customer service. An added bonus is their corporate headquarters which is based minutes from the Foothills of Boulder, Colorado.
A final place I can recommend is the GIS Colorado (GISCO) list server. You will need to sign up for the service (see the instructions included in this article) and once you do, you will become a part of perhaps the most dynamic email discussion about GIS and all things geospatial. I would say that at least once a week (and increasingly in our improving economy) there is a job and/or internship posting on GISCO. Most/all of the jobs are based in Colorado, but hey, there are worse things than moving to the Rockies for your first job!
Until my next edition of Free For All, happy hunting for free geospatial goodies!
Brock Adam McCarty
Map Wizard
(720) 470-7988
brock@apollomapping.com
- This month’s technology focus is on recent advancements in biofuel production. A new source of biofuel might be an invasive species, elephant grass, which grows on marginal lands so it does not compete for land that crops need. Often thought of as a weed, elephant grass is drought-tolerant and is an efficient filterer of nutrients and other contaminants with its robust root system. A team of Virginia Tech researchers may have unlocked the secret of producing hydrogen gas from any plant at a very low cost. By combining a heat-tolerant enzyme extracted from microorganisms with a slur of plant material, they are able to liberate large amounts of hydrogen gas from xylose, the most abundant plant sugar.Brown University researchers have triggered enzymes in Streptomyces which can breakdown lignin, a large constituent of wood and grass biomass. John Love of the University of Exeter has engineered an E. coli strain that can produce diesel from fatty acids–E. coli are hardy organisms that live in our intestinal tracts. MIT researchers have boosted isobutanol production in yeast by ~260%–this heavy alcohol might be an alternative to gasoline. A start up, OriginOil, uses electromagnetic pulses to kill harmful bacteria and other microorganisms which can infect algae colonies a mere hours before harvest, feeding on valuable oils and thus reducing crop quality. Algae are a common source of bio-synthesized gasoline. In related research, scientists at the University of California Davis have found several antioxidants that can boost the growth of algae by up to 85%.Finally, in a two-step process, researchers at UC Berkeley create a biofuel powerful enough for jet fuel. First, they ferment plant sugars with the bacteria Clostridium acetobutylicum and then run the byproduct through chemical catalysis to increase the amount of carbon, thus making it a more powerful fuel source.
 A map of religiosity in major American metropolitan areas created by MPI’s Zara Matheson based on data collected by Gallup-Healthways.
- Do you know what city in America is the most religious? How about the least religious? Well, data from Gallup-Healthways shows that 4 of the 5 most religious cities are in the South while the top 5 least religious cities are in New England, the Rockies and the West Coast. Richard Florida of The Atlantic Cites and Charlotta Mellander of Martin Prosperity Institute (MPI) correlated religiosity with a variety of demographic trends and the results may, or may not, surprise you. You can read the authors’ conclusions here.
- Are you a fan of disc golf? If so and you Google, “GIS and disc golf” you might find this piece by Douglas Swift of Dickerson College. He merged his love of the sport with a GIS class and designed a great map of a local course. Using a handheld GPS unit and some creative symbology in ArcGIS, Douglas came up with this eye-catching map–nice work!
- From the Front Range of the Rockies we head east and north to explore the online GIS capabilities of Connecticut’s largest city, Bridgeport. The city maintains a robust online web map with a variety of layers including parcels, aerial imagery and contours. The online map allows you to export your current view as a JPEG with labels you can add on your own. The one downfall is that the GIS data appears to be view only as I could not find any place to download the actual shapefiles and rasters that power the tool. You can access the city’s GIS website here.
Brock Adam McCarty
Map Wizard
(720) 470-7988
brock@apollomapping.com
In this monthly article, we provide details on updates released each month to Astrium GEO’s 2.5-meter (m) SPOTMaps product. SPOTMaps is an orthorectified natural color imagery layer with coverage over more than 100 countries–totaling an impressive 108 million square kilometers (sq km). For projects requiring a value-priced basemap better than what 15-m Landsat can offer, there is no other choice than SPOTMaps.
SPOTMaps Updates & New Areas–April 2013

 A 1.5-meter SPOT 6 natural color image collected over East London, South Africa. If you would like to see East London in 50-cm resolution as a comparison click here. In the coming months, SPOT 6 imagery will be used to create new SPOTMaps products. © CNES 2012, Distribution Astrium Services / Spot Image S.A., France, all rights reserved.
- No changes in the updates and new areas being added to SPOTMaps since last month
- Portions of Chad are being added to the SPOTMaps database
- Nine (8) markets are currently in update, including portions of:
- Australia
- France
- Greece
- Iran
- Iraq
- Italy
- Kuwait
- Spain
For those who have never worked with SPOTMaps, below is a summary of key product specifications as well as product differentiators.
Key Product Specifications
- Resolution: 2.5-m
- Spectral Bands: simulated natural color (RGB)
- Horizontal Accuracy: 10 to 15-m RMSE (root mean square error)
- Projection/Datum: UTM WGS84
- Source Data: SPOT5 satellite imagery
- File Format: GeoTIFF
Product Differentiators
- Recent and ready for immediate delivery and integration with your GIS
- Seamless, orthorectified coverage across countries and entire regions
- Suitable for work up to 1:10,000 scale
- Custom product framing with minimum orders of ~100 sq km
- Product series is updated every month
- Source data can be delivered with all SPOTMaps mosaics
- Volume and academic discounts are offered
- Multi-user licenses are available
- In the coming months, new 1.5-meter SPOTMaps data made with natural color SPOT 6 and SPOT 7 imagery will be made available

The map below has been color coded to show the collection year which makes up the majority of each SPOTMaps mosaic as well as those markets that were updated this month. An Apollo Mapping representative can provide more details on the specific year ranges used in each mosaic.
If you would like pricing details and/or additional product details, such as date ranges and accuracy specifications, please let us know at sales@apollomapping.com or (303) 993-3863.

A map of all SPOT 6 collections since its launch as well as those with less than or equal to 10% cloud cover. In all, SPOT 6 has collected nearly 400 million square kilometers (sq km) of coverage in less than a year.
In the past two years, Astrium GEO has launched three satellites which have already proven their capabilities to tasking large areas in time frames shorter than possible in the past. In this article, we would like to highlight three collection scenarios–one for the medium resolution satellite, SPOT 6 which launched September 9, 2012, and then two for the high-resolution Pléiades 1 constellation with individual launches in 2011 and 2012.
If you have any questions about the technical specifications and/or pricing of SPOT 6 and Pléiades 1, please contact the Apollo Mapping Sales team at sales@apollomapping.com.
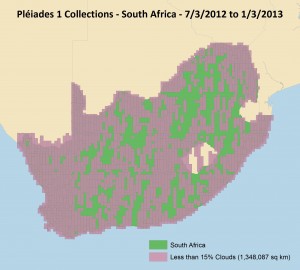 In just six months, Pléiades 1A (just half the constellation) imaged well more than half of South Africa with 15% or less cloud cover. With both satellites imaging the country, a full collection would have been possible in the same time frame.
 In ten months, the Pléiades 1 constellation (and most of the time only P1A) imaged the entire 4,400-km plus border of Saudi Arabia with 15% or less cloud cover.