
Do you have a limited budget but require high resolution imagery over a large area?
Perhaps you need imagery for an archeological study?
Or maybe you need to historic satellite imagery over an area that is changing rapidly?
Whatever the need is, now’s the time to buy with 75% off discounts offered on DigitalGlobe satellite imagery products until the end of the year! This offer applies to purchases of 1,000 square kilometers (sq km) of satellite imagery that is older than 18 months, including WorldView-2, QuickBird, GeoEye-1, IKONOS and WorldView-1.
If you would like to check for coverage over your area of interest, give our online search engine, Image Hunter, a try. We have made significant upgrades to the user experience recently; and now you can search for all DigitalGlobe satellite imagery quicker and easier than you can on their own site. It will literally only take a second or two to load all of the search results over your area of interest!
Here are the specifics on this discount offering from DigitalGlobe:
- Minimum Order: 1,000 sq km (across all polygons; at least 25 sq km per polygon)
- Age Restriction: greater than 18 months old
- Satellites Offered: WorldView-2, QuickBird, GeoEye-1, IKONOS and WorldView-1
- Products Offered: georeferenced panchromatic, natural color, 4-band pansharpened/bundle and 8-band bundle
- Promotion Dates: now through December 31, 2013
- Academic discounts still apply
If you would rather we check for coverage over your area of interest, no problem! Just send an email with your latitude/longitude coordinates, shapefile or KMZ to sales@apollomapping.com.

Have you considered how your digital maps look to those with color blindness? Are you trying to improve your color ramps to find ones that everyone can see, even those who have tritanopia? If so, here is a lightweight freeware application that does just that, Color Oracle.
 A screengrab showing you the three types of color blindness Color Oracle can simulate.
Once installed, you can easily toggle your screen colors to simulate three color blind conditions: deuteranopia, protanopia and tritanopia. Once you toggle between the various view modes, your screen is transformed to a new color palette so you can evaluate if the colors you choose are visible to everyone. And once you click your mouse or keyboard again, the color palette is instantly returned to normal. This application works with both Windows, Mac and Linux operating systems which is an added bonus!
Until my next edition of Free For All, happy hunting for free geospatial goodies!
Brock Adam McCarty
Map Wizard
(720) 470-7988
brock@apollomapping.com
For those of you in need of ready-to-use, wide-area coverage mosaics, 5-meter natural color RapidEye Mosaics are a perfect fit. RapidEye Mosaics are virtually cloud-free and have been created with recent imagery collected during narrow time frames. With a 77-km wide footprint and five identical satellites in orbit, there is no better constellation to image huge areas in short times than RapidEye. These wide-area mosaics are competitively priced so ask your Apollo Mapping representative for a quote to support your next mapping project.
Coverage Update
- Nigeria–added in July 2013
- Eretria & Somalia–added in February 2013
- Hawaii, USA–added in October 2012
Here is a summary of the key features and product specifications for RapidEye Mosaics:
 A map of the off-the-shelf 5-meter RapidEye Mosaics that are available. Custom mosaics are available upon request.
RapidEye Mosaic Features
- Priced at less than $1.50 per square kilometer with a 500 sq km minimum order size
- Recent and virtually cloud free imagery (no more than 3%) collected in the most narrow time frame possible
- GIS-ready format
- Quick delivery as they are off-the-shelf mosaics
- Custom mosaics available if they are not offered now
RapidEye Mosaic Specifications
- Image Bands: True natural color mosaics created from raw red, green and blue spectral bands
- Resolution: 5-meters
- File Format: GeoTIFF with associated metadata files
- Bit Depth: 8-bit color balanced
- Projection/Datum: UTM WGS84
For more information about RapidEye Mosaics, you can reach an Apollo Mapping representative at (303) 993-3863 or at sales@apollomappping.com.
In this two-part Geospatial Frequently Asked Question (G-FAQ), I turn my attention to a topic that perhaps more cartographers should consider: making maps that are just as usable for the color blind as they are for people with normal vision. While you may not have considered this topic in the past, it is important when you consider that, (1) colors are often a very large part of the visual cues we associate with maps and that (2) nearly 5% of the population is color blind. In the first part of this G-FAQ series, we will explore the medical condition known as color blindness with a focus on this set of core questions:
How does the human eye see color? What causes color blindness? What are the types of color blindness and how prevalent are each?
How The Human Eye Sees Color
The human eye is much like a camera as it collects light (i.e. photons) and focuses them on sensors behind the lens. Specifically, photons enter the eye by passing through the cornea, into the pupil and then striking the back of the eye, or the retina (see Figure 1 for a more detailed diagram of the parts of the eye). The retina contains roads and cones which detect specific wavelengths of photons. When struck by a photon at the correct wavelength, the rods/cones are stimulated, producing an electrical pulse which travels to the brain along the optic nerve. It is the optical lobe that interprets these signals to produce a color image of the world around us.
The human eye has more than 100 million rods in the retina. Rods detect white, black and shades of grey. Rods are less sensitive to small changes in shades of grey as between white and black. In low light, there are not enough photons to excite cones, only the rods are excited in these conditions. So in low light, we only see in black and white.
 Figure 1. A diagram of the parts of the human eye. For a more detailed description of each of these parts, please refer to this National Eye Institute website. (Diagram Credit: National Eye Institute)
The human eye sees color when red, green and/or blue-sensitive cones are excited by photons. There are far fewer cones in the eye, with over 6 million color photoreceptors in the average eye. Cones have pigments that absorb photons over a small range of wavelengths (see Figure 2 and its caption for a short lesson on photons, wavelengths and energy). The wavelength range that each type detects overlap slightly so that certain colors cause two or even three cone types to fire at once. In fact, the secondary colors (i.e. yellow, cyan and magenta) which are formed by mixing the primary colors our cones see (i.e. red, green and blue) are brighter as two cones are excited at once by these photons. Sensitivity to photons varies by cone type as well. For instance, blue cones need about twice as much light to react at any given light intensity, so that blue-violet colors are darker than the other colors we see. There are also more red cones than green cones, and also more green than blue cones–this accentuates problems of color reproduction in the human eye.
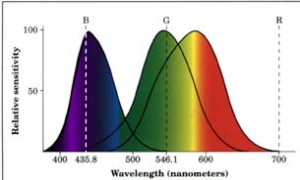 Figure 2. Let’s start with a quick lesson on the physics of light. Light is composed of wave-like particles of energy, called photons, that can be described by their wavelength (i.e. the distance from peak to peak or trough to trough of the wave shape) and their frequency (i.e. the number of wave cycles that pass a single point per unit of time). The frequency of a wave is inversely related to its wavelength so that photons with high frequency have short wavelengths and vice versa. And similarly the energy of a photon is proportionally related to is frequency so high frequency means high energy. In the chart that is above, you can see the specific wavelengths that human cones are sensitive to, from blue to green to red cones in each of the three, overlapping parabolic graphs. Also noted on the chart is the center wavelength of the colors blue, green and red. Below the three graphs are the colors your eye sees as photons of this energy strike your cones. By inspecting this figure, you will discover several of the reasons the human eye has far less than perfect color reproduction: (1) the peak response of our cones is not exactly matched with the center wavelength for the three primary colors; (2) the response of our cones overlaps so that more than one cone typically fires at the same time; and (3) blue cones are far less sensitive to photons than are red and green cones. (Chart Credit: Western Michigan University)
Now a final note on the eye and color that I could ignore, i.e. the spatial component to our visual perception. Even if light is evenly spread across the retina, we still perceive colors at the center of our vision differently than at the edges. This is an advantage as then we can determine information about the objects we are looking at even if it is evenly lit. So for example, we can see the edges of a brightly lit building so we do not run into it.
The Causes of Color Blindness
Someone that is color blind has an abnormality which prevents them from seeing colors as a typical person would. In some cases, those who are color blind cannot see specific colors; and in other cases they have reduced ability to distinguish between various shades. For most color blind people, the cause is congenital, meaning that the condition developed before they were born. By far, the most common congenital cause is inherited genetics, and specifically the X chromosome. Since males have only one X chromosome, if they have the recessive allele which causes color blindness, then they will exhibit the condition. Women have two X chromosomes so it would be rare for them to have two X chromosomes with the mutated allele. For this reason, women are more often carriers of the genes that cause color blindness but can still see color normally. Color blindness can also be caused by recessive alleles on non-sex chromosomes as well as by prenatal brain damage.
The other broad category for the causes of color blindness are those which afflict a person after they are born. These causes are most often linked to pharmaceutical drug use and specifically to Plaquenil which is used to treat rheumatoid arthritis. Severe trauma to the head and/or body has been linked to color blindness as have degenerative diseases and Vitamin A deficiencies. Disruptions to the optic nerve and/or parts of the brain that interpret optical signals from this nerve can also cause color blindness.
The Types of Color Blindness
When trying to categorize any topic, you invariably end up with outliers from the classification scheme you develop. With this in mind, here is the most encompassing categories I could develop after looking over various online resources. The most widely accepted classification appears to be based on the number of functioning eye sensors, the three categories are: monochromatism, dichromatism and trichromatism.
Monochromatism
This is a type of color blindness where those afflicted only have one rod and/or cone that functions properly. The sub-categories are as follows:
- Rod Monochromatism–the condition of only having rods in the eye so that the world is seen in shades of grey.
- Cone Monochromatism Type I–the condition of having only one type of cone and rods that function. With this condition, you can see colors but not distinguish between various shades.
- Cone Monochromatism Type II–the condition of having only one type of functioning cone. Unlike those with Type I, you cannot see at night with this condition.
These types of color blindness are very rare, impacting about 0.001% of people.
Dichromatism
Those afflicted with this type of color blindness have two functioning cones as well as functioning rods. The sub-categories are as follows:
- Deuteranopia–the condition of missing green cone pigment. This impacts 1% of males and 0.01% of females.
- Protonopia–the condition of missing red cone pigment. This impacts 1% of males and 0.02% of females.
- Tritanopia–the condition of missing blue cone pigment. This impacts 0.002% of males and 0.001% of females.
To get a better sense of how a person with dichromatism sees the world, please refer to this month’s Free for All.
Trichromatism
This is the most common type of color blindness and those afflicted with it have three cones but one of the color pigments is altered and thus they see colors differently than would an unafflicted person. The sub-categories are as follows:
- Deuteranomaly–the condition of being less sensitive to green light than a ‘normal’ person. This impacts 5% of males and 0.04% of females.
- Protanomaly–the condition of being less sensitive to red light than a ‘normal’ person. This impacts 1% of males and 0.01% of females.
- Tritanomaly–the condition of being less sensitive to blue light than a ‘normal’ person. This is not sex-linked so it impacts 0.0001% of all people.
Overall, about 8% of males and then 0.5% of females exhibit some form of color blindness, be it the total lack of color perception or altered color reproduction. Given that color blindness impacts nearly 1 in 20 people, creating maps that can be viewed as effectively as possible by all people is an important consideration for any cartographer. As such, in our final part of this G-FAQ, we will look at tips for creating maps that everyone can use effectively.
Do you have an idea for a future G-FAQ? If so, let me know by email at brock@apollomapping.com.
Find Out More About This Topic Here
- Abelard–The Theory of Color
- David Hubel–Eye, Brain and Vision
- Macalester College–Two Type of Color Blindness, Part I / Part II
- National Eye Institute–Diagram of the Eye
- University of Utah–Cognitive Psychology
- University of Washington–Contemporary Optics
- Western Michigan University–Color Reproduction
Brock Adam McCarty
Map Wizard
(720) 470-7988
brock@apollomapping.com
In this monthly piece, we give our readers a sense of the high-resolution imagery coverage collected over a specified geography during a three month window. To do this, we pick a high resolution satellite, a defined time period and geography, and then report key statistics on the total amount of imagery collected in square kilometers (sq km). Without further delay, let’s jump into our analysis.
 This map shows the areas imaged by Pléiades 1from January 1 to March 31, 2013 over Australia (in purple). Please note that in many instances, multiple images were collected over the same area which is difficult to portray on this static map.
Graphic Region of Interest: Australia
Land Mass Covered: 7,683,406.3 sq km
Time Period: January 1 to March 31, 2013
High Resolution Satellite: Pléiades 1
Australia Pléiades 1Imaging Statistics
Total Area Collected: 1,215,182.3 sq km; ~13,502.0 sq km per day
Area Collected @ 20% or Less Clouds & 30 Degrees Off-Nadir: 727,111.3 sq km; ~8,079.0 sq km per day; 59.8% of total
Researchers at the Hong Kong Polytechnic University School of Hotel and Tourism Management recently studied tourist migration patterns across the country. The goal was to better understand how tourists move within the area and possibly predict those patterns to better serve tourists, decrease congestion and enhance access for all parties engaged in Hong Kong’s tourism sector. The study considered past research on inter-destination tourist movements between one tourist destination and another, but found the literature lacking in intra-destination movement. The authors’ stated that tourist movements’ can be influenced by three major factors: ‘human push’ factors such as tourist role, travel party and prior visits; ‘physical pull’ factors such as destination geomorphology; and time factors such as the length of stay at destinations and total time of travel.
 Map of common tourist destinations in Hong Kong.
Using the World Trade Organization’s definition of a local destination, a ‘focal point in the delivery of tourism products and the implementation of tourism policy’, the researchers set out to understand the travel patterns of Hong Kong’s 25 million annual visitors. Building on past research done in the area, the authors laid out 6 categories of movement patterns. Single point which involves no diversions, i.e. traveling from point A to point B and back again, often using the same route each way. Multiple which consisted of three subcategories: base-site, travel starts from one location, always returning to the base-site before heading to a new destination; stopover, which focuses on one particular destination for the trip, but may consist of side trips en route; and chaining loop, where tourists go through several destinations without repetition, and often the stops are related in some manner. The final category was complex, and consisted of two subcategories: destination region-loop where tourists have a main destination point but proceed in circuitous routes surrounding the main destination; and complex neighborhood where tourists go from one destination to another without repeating any travelling leg.
 Map of movement of 94 tourists on their first day in Hong Kong.
In the study, researchers analyzed the travel itineraries of 94 Australian and British visitors. They were then split into two categories, i.e. first-time and previous visitors. The 44 who were new to the destination primarily stayed in the central business district, whereas the 50 who had experienced the area before spread out much further. Their findings led them to believe that repeat visitors had the most diverse travel pattern on their first day in the destination city; whereas first-timers stayed close to the tourist bubble in the early days until they became more comfortable with the lay of the land, so to speak. As the days left on vacation decreased, both groups were more likely to stay near their base-site or primary destination. The average length of stay was about 5 days.
Since tourist motivations are based on attractions in host cities, the authors felt that this study should be reproduced in as many diverse environments as possible to see if their results could be generalized in any fashion. Since number of attractions and spacing of attractions varies as much as the destination locale, there might not be broad and applicable findings to attribute to all destinations. However, the analytic model is transferability to other host destinations.
Justin Harmon
Staff Writer
In this monthly article, we provide details on updates released each month to Astrium GEO’s 2.5-meter (m) SPOTMaps product. SPOTMaps is an orthorectified natural color imagery layer with coverage over more than 100 countries–totaling an impressive 108 million square kilometers (sq km). For projects requiring a value-priced basemap better than what 15-m Landsat can offer, there is no other choice than SPOTMaps.
 A 1.5-meter SPOT 6 natural color image collected over Jersey City, New Jersey, USA on April 28, 2013. If you would like to see this golf course in Pléiades 1 50-cm resolution as a comparison, please click here. In the coming months, SPOT 6 imagery will be used to create new SPOTMaps products. © CNES 2012, Distribution Astrium Services / Spot Image S.A., France, all rights reserved
SPOTMaps Updates & New Areas–July 2013
- There have been no changes in the database since our July edition
- Portions of China are being added to the SPOTMaps database
- Four (4) markets are currently in update, including portions of:
- Angola
- Italy
- Korea
- South Africa
For those who have never worked with SPOTMaps, below is a summary of key product specifications as well as product differentiators.
Key Product Specifications
- Resolution: 2.5-m
- Spectral Bands: simulated natural color (RGB)
- Horizontal Accuracy: 10 to 15-m RMSE (root mean square error)
- Projection/Datum: UTM WGS84
- Source Data: SPOT5 satellite imagery
- File Format: GeoTIFF
Product Differentiators
- Recent and ready for immediate delivery and integration with your GIS
- Seamless, orthorectified coverage across countries and entire regions
- Suitable for work up to 1:10,000 scale
- Custom product framing with minimum orders of ~100 sq km
- Product series is updated every month
- Source data can be delivered with all SPOTMaps mosaics
- Volume and academic discounts are offered
- Multi-user licenses are available
- In the coming months, new 1.5-meter SPOTMaps data made with natural color SPOT 6 and SPOT 7 imagery will be made available

The map below has been color coded to show the collection year which makes up the majority of each SPOTMaps mosaic as well as those markets that were updated this month. In addition, we have added symbols to each polygon to make it more visible for those who are color blind. An Apollo Mapping representative can provide more details on the specific year ranges used in each mosaic.
If you would like pricing details and/or additional product details, such as date ranges and accuracy specifications, please let us know at sales@apollomapping.com or (303) 993-3863.