
For those of you in need of ready-to-use, wide-area coverage mosaics, 5-meter natural color RapidEye Mosaics are a perfect fit. RapidEye Mosaics are virtually cloud-free and have been created with recent imagery collected during narrow time frames. With a 77-km wide footprint and five identical satellites in orbit, there is no better constellation to image huge areas in short times than RapidEye. These wide-area mosaics are competitively priced so ask your Apollo Mapping representative for a quote to support your next mapping project.
November 2013 Coverage Update
- The country of Angola was added in the past month
Here is a summary of the key features and product specifications for RapidEye Mosaics:
 A map of the off-the-shelf 5-meter RapidEye Mosaics (in green) that are available. Custom mosaics are available upon request.
RapidEye Mosaic Features
- Priced at less than $1.50 per square kilometer with a 500 sq km minimum order size
- Recent and virtually cloud free imagery (no more than 3%) collected in the most narrow time frame possible
- GIS-ready format
- Quick delivery as they are off-the-shelf mosaics
- Custom mosaics available if they are not offered now
RapidEye Mosaic Specifications
- Image Bands: True natural color mosaics created from raw red, green and blue spectral bands
- Resolution: 5-meters
- File Format: GeoTIFF with associated metadata files
- Bit Depth: 8-bit color balanced
- Projection/Datum: UTM WGS84
For more information about RapidEye Mosaics, you can reach an Apollo Mapping representative at (303) 993-3863 or at sales@apollomappping.com.
In this monthly feature, we span the globe to examine Our Changing Landscape with time series of medium resolution RapidEye satellite imagery. The RapidEye archive dates back to late 2008 and already contains more than 4 billion square kilometers of data. This month, we look at the devastation caused by the 2011 Joplin, Missouri tornado and the recovery.
The RapidEye Constellation
RapidEye is a constellation of five 5-meter medium resolution satellites each offering five spectral bands of information. The RapidEye constellation offers a daily revisit time to every location on the planet with a huge footprint that is 77-km wide. The data is priced competitively with a base price of $1.28 per square kilometer for all five spectral bands–academics do receive discounts. RapidEye adds a fifth band, the red edge, to the ‘traditional’ multispectral set of blue, green, red and near-infrared (NIR). The additional spectral data available in the red edge band allows users to extract more useful land ‘information’ than can be from traditional 4-band imagery sources. When RapidEye imagery is ordered as a Level 3A Orthorectified product, images from multiple dates are extremely well registered, making it the ideal data source for Our Changing Landscape.
The 2011 Joplin Tornado
In every natural disaster, it is well, the disaster, that captures the headlines and is what ‘the public’ seems to focus on. Typically far less covered by the media and of less interest to the public is the recovery; which is by far the most important story to those who came out the other side of the disaster. The story is the same for one of the most powerful and destructive tornadoes in history, the EF5 that hit Joplin, Missouri on May 22, 2011. With that in mind, there have been plenty of stories written about the disaster itself, for instance this nice summary, so here we focus instead on the recovery.
 Click on the image above to see an animation of 5-meter natural color imagery collected over Joplin, Missouri on April 28 and July 1, 2011, June 16, 2012 and September 7, 2013. In the July 1, 2011 image, you can clearly see the path of destruction left by the tornado and then in the subsequent images the recovery that continues to this day. (Images Courtesy: RapidEye)
A year after the tragedy in 2012, the recovery had made significant progress but of course not enough for the hundreds of families living in FEMA trailers still waiting on new homes. During the year, approximately 3 million cubic yards of debris had been removed, the remnants of the 8,000 plus structures that were destroyed in the town. The city issued more than 600 new home permits and almost 3,000 rebuild/repair permits during this time, a total of more than $310 million in construction projects. Other recovery landmarks included a slew of rebuilt small and big-box retails stores, a new hospital that can withstand 250 mile per hour winds, 3 of the 10 schools that were destroyed and countless new safe houses. There were ~500 ecstatic owner-animal reunions as well as an adoption event that found homes for 745 more of the homeless pets.
Here we are now two years out from the tragedy and the recovery continues. The new wind-resistant hospital is set to open in 2015 and some 80% of new homes in Joplin include a safe house. 75% percent of residences have been rebuilt and 90% percent of the impacted businesses are back open. All but 12 families displaced by the tornado have yet to leave FEMA trailers for permanent or longer-term housing. As of September, about $837 million had been spent on construction since the May 2011 tornado.
In the four images that accompany this article, you can see pre, post and recovery photos highlighting the path of the fateful Joplin tornado.
If you would like to find out more about using RapidEye for your academic studies, engineering projects or any landscape analysis, let us know at sales@apollomapping.com or (303) 993-3863.
In this monthly article, we provide details on updates released each month to Astrium GEO’s 2.5-meter (m) SPOTMaps product. SPOTMaps is an orthorectified natural color imagery layer with coverage over more than 100 countries–totaling an impressive 108 million square kilometers (sq km). For projects requiring a value-priced basemap better than what 15-m Landsat can offer, there is no other choice than SPOTMaps.
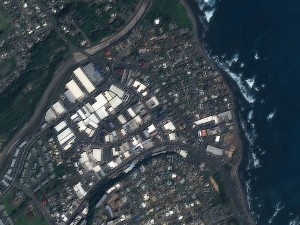
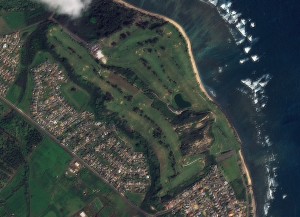 A 1.5-meter SPOT 6 natural color image collected over Waiehu, Hawaii and Waiehu Golf Course on October 25, 2012. If you would like to see this golf course in Pléiades 1 50-cm resolution as a comparison, please click here. In the coming months, SPOT 6 imagery will be used to create new 1.5-meter SPOTMaps products. © CNES 2012, Distribution Astrium Services / Spot Image S.A., France, all rights reserved
SPOTMaps Updates & New Areas–December 2013
- In anticipation of the launch of the new 1.5-meter SPOTMaps mosaics, there have been no recent additions or updates to the 2.5-meter database.
For those who have never worked with SPOTMaps, below is a summary of key product specifications as well as product differentiators.
Key Product Specifications
- Resolution: 2.5-m
- Spectral Bands: simulated natural color (RGB)
- Horizontal Accuracy: 10 to 15-m RMSE (root mean square error)
- Projection/Datum: UTM WGS84
- Source Data: SPOT5 satellite imagery
- File Format: GeoTIFF
Product Differentiators
- Recent and ready for immediate delivery and integration with your GIS
- Seamless, orthorectified coverage across countries and entire regions
- Suitable for work up to 1:10,000 scale
- Custom product framing with minimum orders of ~100 sq km
- Product series is updated every month
- Source data can be delivered with all SPOTMaps mosaics
- Volume and academic discounts are offered
- Multi-user licenses are available
- Starting in early 2014, new 1.5-meter SPOTMaps made with natural color SPOT 6 and (coming in 2014) SPOT 7 imagery will be available
The map below has been color coded to show the collection year which makes up the majority of each SPOTMaps mosaic as well as those markets that were updated this month. An Apollo Mapping representative can provide more details on the specific year ranges used in each mosaic.

If you would like pricing details and/or additional product details, such as date ranges and accuracy specifications, please let us know at sales@apollomapping.com or (303) 993-3863.

To our best knowledge, this discount will not be extended beyond December 2013 so take advantage of those yearend funds while you have them and can save significantly!
Do you have a limited budget but require high resolution imagery over a large area?
Perhaps you need imagery for an archeological study?
Or maybe you need to historic satellite imagery over an area that is changing rapidly?
Whatever the need is, now’s the time to buy with 75% off discounts offered on DigitalGlobe satellite imagery products until the end of the year! This offer applies to purchases of 1,000 square kilometers (sq km) of satellite imagery that is older than 18 months, including WorldView-2, QuickBird, GeoEye-1, IKONOS and WorldView-1.
If you would like to check for coverage over your area of interest, give our online search engine, Image Hunter, a try. We have made significant upgrades to the user experience recently so that now you can search for all DigitalGlobe satellite imagery quicker and easier than you can on their own site. It will literally only take a second or two to load all of the search results over your area of interest!
Here are the specifics on this DigitalGlobe discount offer:
- Minimum Order: 1,000 sq km (across all polygons; at least 25 sq km per polygon)
- Age Restriction: greater than 18 months old
- Satellites Offered: WorldView-2, QuickBird, GeoEye-1, IKONOS and WorldView-1
- Products Offered: georeferenced panchromatic, natural color, 4-band pansharpened/bundle, 8-band bundle and stereo
- Promotion Dates: now through December 31, 2013
- Academic discounts still apply
If you would rather we check for coverage over your area of interest, no problem! Just send an email with your latitude/longitude coordinates, shapefile or KMZ to sales@apollomapping.com.

As anyone who has programmed can appreciate, developing your own custom online applications can take longer than originally expected. As such, we have pushed back the start of the Flex GIS Cloud beta program to January. So if you are interested in joining in, let us know!


Before we give you some details on the beta program, let’s explore our new Flex GIS Cloud. What we feel separates our spatial cloud from competitor’s is its extreme flexibility and streamlined setup. Most GIS clouds require days or even weeks to get setup and start using, but not our Flex GIS Cloud. The setup takes less than 5 minutes and once your account is active, you can start using it immediately! And unlike others, our Flex GIS Cloud has no setup fees. You pay as you go for the data you use.
It seems like the term ‘GIS cloud’ has taken on a variety of meanings depending on the user group and need. The Apollo Mapping Flex GIS Cloud is comprised of storage, viewing and free data:
-
Data Storage & Access
- No upfront commitment and you only pay for the storage you use. Whether you have a few megabytes or a few terabytes of spatial data, our cloud scales to handle your needs.
- Ample bandwidth to access all of your cloud-hosted files by OGC-compliant streaming feeds such as WMS and WFS. With data hosted in multiple locations, you get faster access from any location on the globe as well as improved data redundancy.
-
Online GIS Viewer
- For those on your team who cannot access a desktop GIS application, our flex cloud will feature an internet-based viewer and editor.
- And for those who do have their own GIS, why burn out your computer’s motherboard running geospatial queries when you can harness the power of our cloud to view, query and edit your spatial data from any device.
-
Free Data!
- Let’s call it what it is, everyone loves free stuff–and our Flex GIS Cloud will feature a collection of free vector and raster files that you can stream into your GIS or view online.
Does our new Flex GIS Cloud sound like something you can use? We envision this product to be useful for organizations who have spatial data users in multiple locations with some lacking access to GIS. If that is your organization, drop us a line and we will add you to our beta program list. The beta program will feature a month long access to our cloud with limited storage–the free data component will likely not be available to start.
If you are interested in joining the beta program, let us know by email at sales@apollomapping.com.
In July, we unveiled the new and improved Image Hunter, have you checked it out yet?!?! If not, you should!
Listening to the feedback we received over the past months, the new version of Image Hunter features a major overhaul to the user interface as well as to the backend architecture. Image Hunter Version 2 is built on open-source technology so now it works on all computers, not just on Windows machines. We slimmed down the user interface to make it easier to find the imagery filters and other available tools. Image Hunter is now lightening fast with better previews and the option to search for RapidEye imagery. All things said, we really think you will enjoy your new imagery browsing experience with Image Hunter (Version 2).
Key November 2013 Improvements
This month, we downloaded and staged all of the high resolution data previews on our own servers. This will significantly decrease the time it takes to load and render these browse images which equates to a big improvement for all of our Image Hunter users.
If you have any ideas and/or feedback to improve the new Image Hunter, please let us know at sales@apollomapping.com or (303) 993-3863.
Image Hunter can be accessed 24 hours a day, 7 days a week and is a one-stop shop for every major source of medium and high-resolution satellite imagery on the market today, including:

- WorldView-2
- QuickBird
- WorldView-1
- GeoEye-1
- IKONOS
- The Pléiades 1 constellation
- The entire SPOT constellation
- RapidEye
If any of our readers have struggled with other geospatial search engines that are clunky, only query one data source and/or do not provide preview images, then Image Hunter is the solution to your woes, as it features:
- Online browsing of satellite imagery from 4 data providers and 14 satellites.
- Near-instantaneous loading of low resolution preview imagery with collection date, cloud cover and other key metadata.
- The ability to define your area of interest by address and with coordinates, geometric shape or shapefile/KMZ.
- Responsive basemap with street names to provide a spatial context when discovering data as well as crowd sourced updates for the most accurate map possible.
- Exports of the area of interest you create as well as the scenes you select in shapefile or KMZ format.
- Support for all operating systems, and not just our friends with Windows machines!
The new version of Image Hunter can be accessed here. We are excited to find out what you think about Version 2!
Ecuador is known for many things, and the Galapagos Islands are probably high on that list. Sitting roughly 600 miles west of Ecuador in the Pacific Ocean, the Islands make up a portion of a national park and biological marine reserve. While not a native Ecuadorian, perhaps one of the most famous names associated with the Islands is that of Charles Darwin. A research expedition in 1835 aboard the HMS Beagle gave Darwin the opportunity for biological studies that were integral to his understanding of natural selection and ultimately appeared in his game-changing book, The Origin of Species. But never fear, the mainland is known for its natural reserves as well, for example the volcanic formations that tourists flock to every year.
 The lush foliage on Pichincha masks the fact that it is an active stratovolcano (a conical volcano built on many layers of ash, hardened lava and pumice), but that doesn’t keep the tourists away. Image captured by the 50-cm satellite, WorldView-2 (WV2) on November 17, 2012, and appears courtesy of DigitalGlobe. Photo enhanced by Apollo Mapping.
 The trail down from Pichincha on the Eastern slopes to Quito, the capital city of Ecuador. Image captured by WV2 on November 17, 2012, and appears courtesy of DigitalGlobe. Photo enhanced by Apollo Mapping.
Quito is the only capital city that is threatened by an active volcano, Pichincha, which has two peaks topping off at over 15,000 feet a piece. The highest is Guagua, which means ‘child,’ and the other is called Rucu, or ‘old person.’ While both peaks are hikeable, there is a tram which takes visitors up to about 2,000 feet shy of the top. Another popular volcanoes in Ecuador is Cotopaxi, coming in at just under 20,000 feet. This mountain hosts a refuge at roughly 16,000 feet where climbers camp for the night in order to make their push to the summit the following morning. And the hot springs near Tungurahua are a ‘hot’ spot for locals (pun intended), as people come from all over to soak in the life-giving minerals.
Pichincha sits in the Andes Mountains, the longest continental mountain range on the planet, covering over 4,000 miles. There are six other countries intersect the mountain range; and in Ecuador there are two narrow Andes’ ranges that run parallel to each other: the Cordilleras Oriental and the Occidental. Sitting in the middle is the Central Valley, and it is home to the majority of the country’s major cities. West of the ranges is primarily hot and humid coastal lowland, and east of the ranges is tropical rainforest and part of the Amazon Basin. The Basin is drained by the Amazon River, and Ecuador’s portion of South American rainforest is just a small fraction of the continent’s 2.1 million square miles.
Ecuador gained its independence from Spain in 1822, and went on to form Gran Columbia with the nations of Venezuela and Colombia shortly thereafter. In 1830, it separated from the confederation and became the Republic of Equator, which is Incan for equator. Ecuador is roughly equivalent to Arizona in land cover, and it has approximately 15 million inhabitants. Quito sits about 9,000 feet above sea level and is home to roughly 2 million residents, making it the highest capital city in the world and the most populated city in the country.
Ecuador is one of the numerous countries that have the equator running through it, but it does not pass through Quito. Ciudad Mitad del Mundo (middle of the world city), just north of Quito, is home to the Equator Museum where the equator exists as an actual line for a little while and is marked by several monuments. Although recent advances in GIS technology have disputed the placement of two of the monuments, it is still, imaginably, an amazing site to behold. Many people love to stand on the four corners in the USA, but how cool would it be to stand in both the Northern and Southern hemispheres at once?!
Justin Harmon
Staff Writer