
In the coming months, Apollo Mapping will be unveiling the industry’s most affordable, scalable and secure spatial cloud, the GISrack. While we are busy building out the infrastructure and technology required to support the most flexible GIS cloud on the market, now is a great time to explain a bit about the GISrack.
Some of you may have used other GIS cloud services in the past, and in many ways the GISrack will be similar to these. But the GISrack will distinguish itself in a variety of important manners. Here is a list of the key features that will be unique to the GISrack:


- Near-instant set-up–unlike other GIS clouds, the GISrack will take less than five minutes to sign up for, load data on to and get started using. No other cloud comes close to that flexibility.
- Tons of free spatial data–included with every subscription is access to more than 4 terabytes (TB) of free vector and raster data covering the United States and many parts of the world.
- A marketplace for spatial data – all users will have access to a library of spatial data that can be added to your GIS cloud. Further, users will be able to post data they have created to the marketplace to sell to other users (or let them use for free if you wish).
- Cloud computing – we will ask all users for feedback on the spatial operations they perform most frequently and will then implement the most popular ones in the GISrack.
- Free entry-level subscriptions – users will be able to use the full-functionality of the GISrack with up to 25 megabytes (MB) of free storage and bandwidth. And once you pass this storage limit, subscriptions will start at just $5.00 per month!
- A robust online viewer–for those users in your organization lacking access to a GIS application, the GISrack will feature an online viewer that can be accessed from anywhere in the world as long as users have internet access.
- Enhanced browsing speeds – we will have all of your spatial data cached in multiple locations around the world so access times will be greatly reduced for international users.
- Flexible streaming architecture – administrators will be able to setup multiple WMS and WFS feeds that can be shared with the appropriate teams of data users. Each feed can be seeded with the datasets these users need access to.
- Industry-leading data redundancy – with 99.999999999% data redundancy, you can be assured that your data will not be lost once placed on the GISrack.
Do you have any specific questions you would like answered about the GISrack? Or perhaps you want to join the beta program? If so, let us know by email at sales@apollomapping.com.
DigitalGlobe’s Advanced Elevation Series (AES)is a suite of elevation products that are reasonably priced with global coverage. By utilizing existing archive coverage and their constellation of 50-cm WorldView satellites, DigitalGlobe is able to offer an industry first: global elevation data delivered in reasonable time frames at competitive market prices.
There are three basic product offerings within the AES: Mapping, Precision and Very High Precision elevation data. The three products are differentiated by their resolution and accuracy–this information is summarized in the table below. For each of the products, DigitalGlobe offers both a Digital Surface Model (DSM) which includes human-made and natural features (such as trees, bushes and buildings); and a Digital Terrain Model (DTM) with these features removed. Other important specifications include:
- Minimum Order Size
- 100 square kilometers
- Geographic Coverage
- Global
- Price lifts do exist for some Asian countries
- Cloud Cover
- 5% or less
- Cloudy pixels in final product are identified with an Esri polygon shapefile
- Data Sharing
- Data can be shared with up to 5 end users for no additional charge
- Uplifts can be applied to accommodate more end users
A Summary Table of Key AES Product Specifications
| Resolution | Absolute Vertical Accuracy (LE90%) | Relative Vertical Accuracy (LE90%) | Absolute Horizontal Accuracy (CE90%) | Relative Horizontal Accuracy (CE90%) | Ground Control (GCPs) Required? | Formats Available | |
| Mapping | 8 m | 8 m | 5 m | 10 m | 8 m | No | DSM / DTM |
| Precision | 4 m | 4 m | 2 m | 5 m | 4 m | Yes* | DSM / DTM |
| Very High Precision | 2 m | 2 m | 1 m | 2 m | 3 m | Yes* | DSM / DTM |
* Horizontal and vertical accuracies stated here assume GCP accuracy of 50-cm CE90%/LE90% accuracy or better.
 An animated comparison of 2-meter Very High Precision DigitalGlobe elevation models created over Dunedin, New Zealand; the first image is a DSM and the second is a DTM. (Data Source: DigitalGlobe)
Below is a comparison of two Very High Precision products created over Dunedin, New Zealand: one is a DSM and the other a DTM. DSMs are commonly used in line of sight and watershed analysis as they include human and natural features; while DTMs are commonly used in orthorectification where a ‘true’ model of Earth’s surface is crucial for improved horizontal accuracy. In this animation, we start with the DSM and then transition to the DTM, using the same color ramp with low elevations in red and higher elevations in green.
With pricing to meet different budget requirements and global coverage, DigitalGlobe’s AES elevation suite is the ideal solution for:
- Regional studies which require an analysis of elevation.
- Academics in need of a reasonably-priced solution to replace dated and low resolution public sources.
- Engineers looking to replace costly field labor in distant lands.
- More accurate orthorectification, particularly in areas of high topographic change.
If you would like more information about the global AES offering by DigitalGlobe, you can send requests to sales@apollomappping.com or call us at (720) 720-7988.
From the nation of our friendly neighbors to the north, Canada, our next stop on the Pléiades 1 Golf Course of the Month takes us halfway around the world to Sheshan International Golf Course in Shanghai, China. From October 31st to November 3rd, Sheshan GC will host the World Golf Championships-HSBC Champions tournament. Started in 2005, this tournament became part of the World Golf Championships (WGC) in 2009 and then part of the official USA PGA Tour in 2013. The field is comprised of a variety of tournament winners, such as those of the four major PGA championships, and other top rated golfers. The winner of the WGS-HSBC Champions receives a $1.4 million payout from the most lucrative purse in the Fall 2014 schedule at $8.5 million as well as 500 FedEx Cup points. Since the inception of the WGC, the four tournaments that make up the championship series have contributed more than $38 million to local charities.
 A 50-cm color image of Sheshan International Golf Course collected on March 20, 2013 by Pléiades 1B. To see this course in 1.5-meter resolution, check out this month’s feature on SPOTMaps. Image photo enhanced by Apollo Mapping. © CNES 2012, Distribution Airbus Defense and Space / Spot Image S.A., France, all rights reserved.
Opened in 2004, Sheshan International Golf Course was designed by Nelson & Haworth Golf Design who have built more than 70 courses worldwide. Requiring more than 1.6 million cubic meters of additional soil, Sheshan is one of the most hilly and forested courses in the Shanghai area. The 18-hole course plays through forests of pines, deciduous and 1,000 year-old Ginkgo trees that will eventually be so thick that players will not be able to see other from neighboring holes. Many of the holes play around and over water features such as canals, lakes and even a 50-meter deep quarry. Sheshan has been consistently recognized as one of the world’s premier golf courses. The 7,266 yard links features creeping bent greens and a rye grass-paspalum mix elsewhere. The longest hole on the course is the par 5, 603 yard 8th; and then the shortest is the par 3, 200 yard 6th.
The 2013 WGC-HSBC Champions tournament was won by US player, Dustin Johnson, by three strokes over runner-up English golfer, Ian Poulter. Given that the WGC tournaments are comprised of a field of previous event winners and top rated golfers, the event is always a star studded one. So far, more than 45 top golfers have qualified for the event, such as Jason Day, Rickie Fowler, Rory McIlroy and Adam Scott. While you ponder who the winner of the 2014 WGS-HSBC Champions will be, sit back and enjoy these 50-cm Pléiades 1 images of Sheshan International Golf Course.
The Pléiades 1 High-Resolution Satellite Constellation
The Pléiades 1 constellation (or at least part of it!) has been in orbit since December 2011 and if you have not had a chance to check out any sample imagery, take a few moments and have a look at the gallery on our website. If you work with high resolution imagery, you should consider Pléiades 1 for your next geospatial project.
A variety of Pléiades 1 products are available from both a growing archive and as a new collection, including 50-centimeter (cm) pansharpened imagery and 50-cm panchromatic–2-meter (m) 4-band multispectral bundles. We are happy to discuss the technical specifications, pricing and tasking options available with this satellite constellation.
Working with Pléiades 1 since the launch of the first twin satellite, P1A, we have noticed that:
- Airbus Defense and Space is able to deliver on their tasking feasibilities.
The Apollo Mapping sales team can answer any questions you might have about the high resolution satellite constellation, Pléiades 1. We can be reached anytime at (303) 993-3863 or sales@apollomapping.com.
In this monthly feature, we span the globe to examine Our Changing Landscape with time series of medium resolution RapidEye satellite imagery. The RapidEye archive dates back to late 2008 and already contains more than 5 billion square kilometers of data. This month, we look at the damage done by the 2013 Bohol earthquake around Tubigon, Philippines.
The RapidEye Constellation
RapidEye is a constellation of five 5-meter medium resolution satellites each offering five spectral bands of information. The RapidEye constellation offers daily revisits to every location on the planet with a huge footprint that is 77-km wide. The data is priced competitively with a starting cost of $1.28 per square kilometer for all five spectral bands–academics do receive discounts. RapidEye adds a fifth band, the red edge, to the ‘traditional’ multispectral set of blue, green, red and near-infrared (NIR). The additional spectral data in the red edge band allows users to extract more useful land ‘information’ than can be from traditional 4-band imagery sources. When RapidEye imagery is ordered as a Level 3A Orthorectified product, images from multiple dates are extremely well registered, making it the ideal data source for Our Changing Landscape.
The 2013 Bohol Earthquake
 Click on the image above to see an animation of 5-meter natural color RapidEye imagery collected over Tubigon, Philippines on July 25, 2013, October 19, 2013 (right after the earthquake) and February 28, 2014. Sometimes in failure there is success in that in this imagery, very little damage from the earthquake can be detected visually even just several days out from the disaster. This suggests that most of the damaged structures in a smaller community will not be detected at 5-meter resolution. In the July 2013 and then the February 2014 images, you can see that the colors of the structures in Tubigon have changed in many locations, suggesting some rebuilding following the disaster. (Images Courtesy: RapidEye)
On October 15, 2013 at 8:12AM, a magnitude 7.2 earthquake rocked the Pilipino island province of Bohol with an intensity equal to 32 Hiroshima atomic bombs. The epicenter of the quake was located close to the center of the island, about 2 kilometers (km) southeast of Carmen, Bohol, and then 12-km below ground. As of 1PM the next day, the quake resulted in 885 aftershocks, with at least 15 of them felt by the local population. The strongest shaking was recorded in Tagbilaran City which is on the southwest corner of the island. Bohol has a long history of seismic activity, in fact it is one of the most active locations in the Philippines. A multitude of faults crisscross the island, including the East Bohol Fault which was originally deemed responsible for the 2013 earthquake; however, a team of academics discovered a new fault, the North Bohol Fault, which they believe was actually the guilty party. The Bohol earthquake was powerful enough to shift the island 55 centimeters due west and then create some 500 meters of new shoreline.
The 2013 Bohol earthquake was categorized as Very High Intensity (a Level VII quake on a scale that goes up to X) according to the Mercalli intensity scale which measures the affects of the event on the local population and infrastructure. As a Level VII quake, the damage it caused was not localized to the epicenter, rather there were wide areas along the north and northwest of Bohol island that were devastated. In all, some 200,000 residents were impacted or about 40,000 households, leaving 209 dead, 877 injured and 8 missing in Bohol province.
One of the hardest hit cities on Bohol was Tubigon which is located on the central west coast of the province. Some 8,000 families or 40,000 people were in need of assistance following the 2013 earthquake. 30% of the houses in the town were condemned which equated to 2,368 structures, 681 of them collapsed and 1,558 damaged beyond repair. Most of the structures that were impacted by the quake experience complete failure and the material did not make a difference as both masonry buildings and those made with local materials were equally impacted. Bridges, roads and even ports were heavily damaged so relief efforts were hampered by the lack of access to the region. Further, there was no electricity nor water for drinking purposes and local hospitals were over-whelmed, offering minimal treatments in open air tents. As the final straw that broke the camel’s back, Bohol was hit by Super Typhoon Haiyan on November 7th, sending 40,000 Bohol residents to evacuation centers.
If you would like to find out more about using RapidEye for your academic studies, engineering projects or any landscape analysis, let us know at sales@apollomapping.com or (303) 993-3863.
In this monthly article, we provide details on updates to Airbus Defense and Space GEO’s SPOTMaps product. SPOTMaps is an orthorectified 2.5-meter (m) and now 1.5-m natural color imagery layer with coverage over more than 110 countries–totaling an impressive 115 million plus square kilometers (sq km). For projects requiring a value-priced basemap better than what 15-m Landsat can offer, there is no other choice than SPOTMaps.
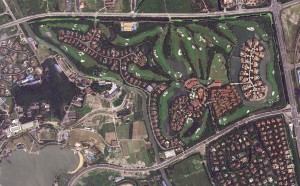
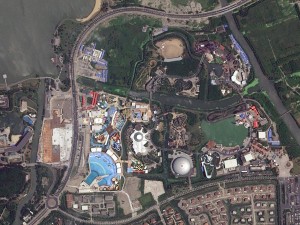 1.5-meter SPOT 6 natural color images collected over Sheshan Golf Course, Shanghai, China and the surrounding areas on July 13, 2013. If you would like to see this golf course in Pléiades 1 50-cm resolution as a comparison, please click here. © CNES 2012, Distribution Airbus Defense and Space / Spot Image S.A., France, all rights reserved
 This map of SPOTMap1.5 coverage shows the regions that have been released as well as those currently in production. An Apollo Mapping representative can provide more details on the specific year ranges used in each mosaic.
 This map of SPOTMap2.5 coverage has been color coded to show the collection year which makes up the majority of each mosaic as well as those markets that were added in the final month of production (i.e. August 2013). An Apollo Mapping representative can provide more details on the specific year ranges used in each mosaic.
SPOTMaps Product Updates–October 2014
- 22 million sq km of SPOTMap1.5 coverage is to be released in 2014 alone!
- These countries are currently in production and will be added to the SPOTMaps1.5 database soon:
- Algeria (part of the country)
- Australia (part of the country)
- Botswana
- Egypt (part of the country)
- Israel and the Occupied Territories
- Jordan
- Lebanon
- Libya (part of the country)
- Mauritania (part of the country)
- Senegal
- Production of SPOTMaps2.5 is complete now that SPOTMaps1.5 are being released.
For those who have never worked with SPOTMaps, below is a summary of key product specifications of the 1.5-m and 2.5-m versions as well as product differentiators.
Key Product Specifications
- SPOTMaps1.5
- Resolution: 1.5-m
- Spectral Bands: true natural color (RGB)
- Horizontal Accuracy: 6 to 10-m CE90 (circular error 90%)
- Projection/Datum: UTM WGS84
- Source Data: SPOT6/7 satellite imagery
- File Format: GeoTIFF
- SPOTMaps2.5
- Resolution: 2.5-m
- Spectral Bands: simulated natural color (RGB)
- Horizontal Accuracy: 10 to 15-m RMSE (root mean square error)
- Projection/Datum: UTM WGS84
- Source Data: SPOT5 satellite imagery
- File Format: GeoTIFF
Product Differentiators
- Recent and ready for immediate delivery and integration with your GIS
- Seamless, orthorectified coverage across countries and entire regions in 1.5-m and 2.5-m resolution
- Suitable for work up to 1:10,000 scale
- Custom product framing with minimum orders of ~100 sq km
- Product series is updated nearly every month
- Source data can be delivered with all SPOTMaps mosaics
- Volume and academic discounts are offered
- Multi-user licenses are available
If you would like pricing details and/or additional product details, such as date ranges and accuracy specifications, please let us know at sales@apollomapping.com or (303) 993-3863.
While touching up on some facts and history about Belize City, I noticed how small the population was, just shy of 58,000 people. I knew that it was once the capital city (that honor now belongs to Belmopan which is significantly smaller at 14,000), but for some reason I thought the city was bigger, if for no other reason than it is a much talked about tourist destination. In case you’re wondering, I know I was, King Edward Point of the South Georgia and South Sandwich Islands is the smallest capital city in the world with a population of 18 folks. But I guess when the total population of the country is only 350,000, you have to expect that there won’t be much room for large cities. With such few inhabitants of the country, Belize has the lowest population density of all Central American countries. But don’t let that fool you as their growth rate is one of the highest in the Western hemisphere, so all those wide open spaces won’t be there for too much longer!
 Adjacent to St’ John’s Cathedral in Belize City is the Yarborough Cemetery, the oldest cemetery in the country. It was used for a little over a century starting in the late 1700’s. 50-cm color image captured by GeoEye-1 on June 23, 2011 and comes courtesy of DigitalGlobe. Photo enhanced by Apollo Mapping.
 Traffic jams in the water, traffic jams on the bridge. Better time your trips well, because if you get caught at one of the two times the bridge goes up every day, you’ll add over an hour to your trip. 50-cm color image captured by GeoEye-1 on June 23, 2011 and comes courtesy of DigitalGlobe. Photo enhanced by Apollo Mapping.
Belize is the only country in Central America that has English as its official language, which is likely a big reason it is such a travel hot spot for Americans, but there are eight recognized regional languages which helps to showcase their diversity in culture and history. Originally part of the British Empire and formally known as the British Honduras until 1973 (in hindsight, what a good PR move changing that name, with Honduras being home to the murder capital of the world), Belize was previously under Mayan control as a territory of the Yucatán Peninsula. The Spanish tried to colonize the country, but due to the perceived lack of natural resources and the stern Mayan defense, the Spaniards were thwarted–for a time at least.
The Battle of St. George’s Caye was the Spaniards’ seventh attempt at colonizing what is now known as Belize. The battle lasted from September 3rd to the 10th and it pitted Great Britain and Spain against one another, both claiming rights to the territory. Spain assumed it was theirs because they occupied and controlled both Mexico and Guatemala, but Britain had been in Belize for nearly 150 years at the time of this conflict. The 10th was the day the brunt of the battle was bore, as the Spaniards previous attempts to gain footing on the soil failed. On that final day, the Baymen (the British settlers in Belize) were able to defeat the Spaniards and send them on their way, thus leading to British control for nearly another 200 years after the seven-day battle.
As previously mentioned, Belize City was once the capital of Belize, but Hurricane Hattie’s devastation in 1961 pushed the government further inland, much to the disdain of the inhabitants of the former capital. The bureaucrats hoped the constituents would follow, but they chose to stick in the more active and metropolitan Belize City. The city is divided into north and south by a swing bridge at the mouth of the Haulover Creek, where the Belize River meets the Caribbean. The bridge is the only manually-moved swing bridge left in operation in the world, and it swings open twice a day to allow large boats to pass by. It does so once at ‘rush’ hour in the evening, creating significant traffic jams. Plan accordingly!
Another attraction that brings in locals and tourists alike is the Museum of Belize. Built in 1857, it was formerly a jailhouse known as Her Majesty’s Prison. Inside you’ll tour through nearly 400 years of Belize history and 3,000 years of Mayan culture. For example, you will find an originally preserved jail cell, but don’t get too comfortable, they no longer have ‘three hots and a cot’ to keep you cozy and full. Other attractions include the Buenavista Vase, with a depiction of the mythical Mayan Hero Twins, and the earliest stamp of Queen Victoria from 1837–I imagine its current value is far greater than that with which it is adorned!
Justin Harmon
Staff Writer
There has been a slurry of pricing updates from DigitalGlobe with the long-awaited launch of WorldView-3, and this month is no exception.
As such, here is a handy summary of the current pricing changes and promotions available for DigitalGlobe satellite imagery products.
- There is a new price list for 30-cm satellite imagery products offered by DigitalGlobe. Please email the Apollo Mapping sales team at sales@apollomappping.com for additional details on these new prices. The new price list also includes changes to 8-band WorldView-2/3 archived and tasked imagery.
- 30-cm WorldView-3 products will not be available until Q1 2015. Check our monthly newsletter, The Geospatial Times, for details on exactly when 30-cm products will be made available.
- 40-cm and 50-cm tasking requests for WorldView-3 only will be subject to the new 30-cm resolution pricing table.
- New collections at 30-cm resolution will have regional prices dependent on the country that is being tasked. We can tell you more about the regional prices to expect if you email us at sales@apollomappping.com.
- Through the end of 2014, requests for WorldView-3 only 40-cm tasking orders will be priced 50% off the list price.
- Any WorldView-3 order placed before February 25, 2015 are eligible for 50% off redelivery at 30-cm once the US government eases the resolution restriction.
- Through the end of 2014, customers based in the Americas who are also ordering data over the Americas will receive these discounts: (a) 8-band archive imagery at 4-band data pricing; and (b) 8-band tasked imagery for a 10% uplift on 4-band data pricing. There is a 25 square kilometer (sq km) minimum order for archive data and then 500 sq km for tasked imagery.
- There is a 50% off discount for DigitalGlobe imagery older than 18 months–you can find out more about this promotion here.
If you have questions about any of these WorldView-2/3 price changes and/or promotional discounts, please contact the Apollo Mapping sales team at sales@apollomapping.com.
In this monthly piece, we give our readers a sense of the high-resolution imagery coverage collected over a geography during a specified window. To do this, we pick a high resolution satellite, a defined time period and area of interest, then report key statistics on the total amount of imagery collected in square kilometers (sq km). Without further delay, let’s jump into our analysis.
 This map shows the areas imaged by WorldView-2 from June 1 to August 31, 2014 over Scandinavia. Please note that in many instances, multiple images were collected over the same area which is difficult to portray on this static map.
Graphic Region of Interest: Scandinavia
Land Mass Covered: 1,174,752.7 sq km
Time Period: June 1 to August 31, 2014
High Resolution Satellite: WorldView-2
WorldView-2 Imaging Statistics–Scandinavia
Total Area Collected: 912,976.9 sq km
Area Collected @ 20% or Less Clouds & 30 Degrees Off-Nadir: 268,761.9 sq km; 2,921.3 sq km per day; 29.4% of total