


Gaborone happens to be the capital and largest city of Botswana. Gaborone is the political and economic capital of Botswana, home to its largest companies and the Botswana Stock Exchange. It also serves as the headquarters of the Southern African Development Community. Gaborone has a hot semi-arid climate. Most of the year, Gaborone is very sunny. Precipitation in Gaborone is scanty and erratic. About 46 percent of Gaborone’s surface area has been zoned for agricultural production. While agriculture comprises less than 2 percent of GDP in Botswana, it is vital to the livelihood of many citizens who operate subsistence farms. Livestock production, especially cattle, drives an estimated 80% of the agricultural GDP. Beef is Botswana’s primary agricultural product for export. Livestock production exceeds domestic needs, and the country has exported range-fed beef to the European Union. Cereals are the most commonly raised crop in Gaborone, but it is constrained by productivity, unreliable water supply and the fact that 70% of Botswana’s landscape consists of desert and poor soils. Local cereal production is dominated by sorghum, maize and millet. In the images above, we can see the colorful fields of cereals being grown northeast of Gaborne and also dwellings scattered amongst the fields. These 30-cm WorldView Legion images were collected on January 29, 2025, and have custom processing and color balance applied by Apollo Mapping. (Satellite Imagery © 2025 Maxar Technologies)
In this monthly article, we travel the world to check out unique, fun and sometimes a bit weird 30-centimeter (cm) color imagery samples from the WorldView constellation. In May, our focus was an image of Isla Floreana in the Galapagos Islands. For this edition of the 30-cm Color WorldView Image of the Month, we feature two images over agricultural fields northeast of Gaborone, Botswana.
30-cm WorldView-3 (WV3) launched in late 2014, WorldView-4 (WV4) launched in late 2016 and then the first WorldView Legion satellites launched in 2024. Taken together, this is the most advanced satellite constellation the commercial marketplace has ever had access to. Here are a few of the features that really set these satellites apart from the competition:
- Improved Resolution
- Higher resolution means you can see more detail in WorldView imagery.
- Data collected at nadir will have 31-centimeter (cm) panchromatic, 1.24-meter (m) visible and near infrared, 3.7-m SWIR (WV3 only) and 30-m CAVIS (WV3 only) bands.
- Additional Spectral Bands
- If spectral analysis is part of your project, then no other satellite can match WorldView-3 and WorldView Legion with their 8 bands of visible and near-infrared data; and then 8 shortwave infrared bands (WV3 only) which are crucial for geological studies.
- Better Positional Accuracy
- With accuracies of 3.5-m CE90% or better (without ground control even!), the 30-cm WorldView constellation has no rivals for its enhanced positional accuracy.
- Daily Revisits
- With multiple WorldView-3 and WorldView Legion satellites orbiting our planet, daily revisits are available for most locations.
- WV4 is no longer collecting new imagery.
- Increased Collection Capacity
- WV3/4 feature 13.1-km swath widths (at nadir) with the ability to collect up to 680,000 square kilometers (sq km) of high-resolution data per day per satellite (though WV4 is dead now).
- When fully launched, WorldView Legion will feature six 30-cm satellites, significantly boosting the collection capacity of this leading high-resolution constellation.
If you are interested in WorldView-3, WorldView-4 and/or WorldView Legion imagery for your next project, please let us know by phone, 303-993-3863, or by email, sales@apollomapping.com.
You can also find more WV3 samples and technical information on our website here; WV4 samples and information can be found here; and then finally here is .

Cricket’s Chirp is created for Apollo Mapping by Ron Ruelle, a Wilmington, NC (formerly Boulder, CO) based cartoonist, lllustrator and teacher. No animals are harmed in the creation of these comics, but Ron sometimes breaks a pencil in frustration. You can see more of his work at www.ronruelle.com

If it has been a while since you updated your Apollo Mapping price list, it might be a good time to update it now! In the past months, we have seen a series of significant pricing changes including:
- Simplified Maxar pricing with the removal of newer than 90-day pricing.
- Reduced pricing for 50-cm WorldView and GeoEye-1 data.
- The addition of 50-cm SuperView Neo-3.
If you would like to get your updated Apollo Mapping price list, send us an email at sales@apollomapping.com and we will get right back to you.
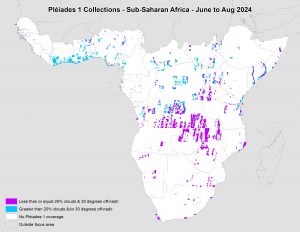 This map shows the areas imaged by the Pléiades 1 constellation from June 1 to August 31, 2024 over Sub-Saharan Africa. Please note that in many instances, multiple images were collected over the same area which is difficult to portray on this static map.
In this monthly piece, we give our readers a sense of the high-resolution imagery coverage collected over a geography during a specified window. To do this, we pick a high-resolution satellite constellation, a defined time period and area of interest, then we report key statistics on the total amount of imagery collected in square kilometers (sq km). Without further delay, let’s jump into our analysis.
Graphic Region of Interest: Sub-Saharan Africa plus off-shore islands
Land Mass Covered: 16,510,458.9 sq km
Time Period: June 1 to August 31, 2024
High-Resolution Satellite Constellation: Pléiades 1A/1B
Pléiades 1 Constellation Imaging Statistics–Sub-Saharan Africa
Total Area Collected: 2,163,616.5 sq km; 11,758.8 sq km per satellite/per day
Area Collected @ 20% or Less Clouds & 30 Degrees or Less Off-Nadir: 955,850.6 sq km; 5,194.8 sq km per satellite/per day; 44.18% of total

We love maps.
We love imagery.
We love work breaks.
We hope you like them as well!
It may be a bit blustery still in New York, but avid golfers are dreaming of the May PGA Championship this year. In 2023, magic happened in the 4th Round of the PGA Championship held at Oak Hill Country Club in Rochester; and that magic was captured by the 50-centimeter GeoEye-1 image featured here collected on May 21, 2023 at 10:48AM local time!
Golfer Brooks Koepka started the day with a one-shot lead and birdied three holes early on. Viktor Hovland hung in there though, birding the fourth hole and taking a shot back on Koepka on the next two holes. But Koepka’s three-shot swing on the 16th hole made his victory seem certain. Koepka closed with a 3 under 67, securing a two-shot victory.
This year, the PGA Championship returns to the prestigious Quail Hollow Club in Charlotte, North Carolina, from May 15 to 18. As the second major of the year, this storied event will once again showcase the world’s best golfers as they compete for the coveted Wanamaker Trophy. Quail Hollow previously hosted the 2017 PGA Championship where Justin Thomas claimed his first major victory, as well as the 2022 Presidents Cup.
Be sure and check out our image and see if it inspires you to grab those golf clubs and start practicing your swing!
Have a great rest of your workday! 😊
(Image Courtesy: Maxar. Processed by Apollo Mapping for improved color accuracy and clarity.)
Something special happens to your brain when you become a “GIS person.” You think differently. You see patterns where others don’t. You notice connections more quickly. It changed your brain. Eventually, it will probably touch most people. It becomes hard to not see the shapes and networks that emerge.
Often when I describe GIS to regular folks, people that haven’t met GIS yet, as points, lines, polygons, and images that are connected to a place with data about or associated with that place. Consider your city a dot on the map. There are many details about your city, and therefore we can associate all those details with the dot on the map that represents your town. Because of the data associated with that dot and all the other city dots, we can look at a map and ask questions. How many dots are within a state? How many of those dots have 20k people or less? How many were founded before 1900? You and that favorite mobile device are a point with many gigs of tracked information. Your dot has become a line or route. Your dot crosses into a geofence or polygon that prompts interactions at a store. To the regular person, they can begin to imagine a map of city dots with different sizes to represent the population data. They think about walking into the store. As GIS professionals you get it. Have you thought about how the notion of a point or the power of a point has changed over time?
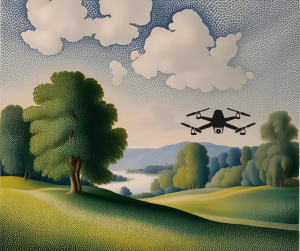 Image created in Canva–AI created background in Seurat style.
The power of the point could be aligned to art. Dots can be art. Pointillism began with Georges Seurat and Paul Signac in the late 1800s as they created collections of dots that formed an image like seen in “A Sunday on La Grande Jatte.” The fascination and creativity to give meaning and purpose to a dot as a collective artwork was cutting edge. Even if you’re not an art person, this should appeal to the modern GIS-er. Dots in mass become hotspots. Can you imagine if we processed Seurat’s painting as locations and ran hotspot analysis? Glowing people and animals would emerge.
Thanks to lidar and photogrammetry tools, points aren’t just cities or objects. Landscapes, anything really, can be measured and documented as a point cloud. I imagine that Seurat would have loved this concept. Dots become sculpture with the help of drones and other cool tools!
Now, “art” is 3D. We fly through landscapes, see details that are humanly impossible to reach or very unlikely and dangerous to capture by human hand. A recent Titanic digital twin was created and showcased in a National Geographic documentary, “amounting to 16 terabytes of data (equivalent to the hard drive footprint of six million e-books).” Researchers and subject matter experts dispelled myths associated with the Titanic. They helped prove personal accounts that had been dismissed to create an even more realistic interpretation of what happened April 15, 1912. Points changed history again.
The points of the cloud, the dots on the map, your destination, or the point you’re making in your presentation…all important. I’m reminded of the poem by Linda Ellis, “The Dash Between,” that shares the importance of the dash on a tombstone and what it really represents. The power of that dash is like the power in a point to tell a story, mark a moment, inspire a crowd, or right a wrong. Let’s continue to put our points to work and make a difference!
If you need me, I think that I will dust off my watercolor tools and get artsy to add some creativity to my dot.
Barbaree Duke
Geospatial Crusader

Cricket’s Chirp is created for Apollo Mapping by Ron Ruelle, a Wilmington, NC (formerly Boulder, CO) based cartoonist, lllustrator and teacher. No animals are harmed in the creation of these comics, but Ron sometimes breaks a pencil in frustration. You can see more of his work at www.ronruelle.com
- Technology is cool! Don’t’ think so? Read on and I bet you will agree then 😊
Low-cost catalyst to produce hydrogen gas invented.
Bigger veggies through gene research.
Innovative method to re-use waste plastics.
New technique to detect life on other planets.
These solar cells are 100% recyclable in water.
More efficient mobile displays could be on the way.
This blanket cleans water with the help of sunlight.
A safe way to clean up microplastics.
This new carbon-negative material could revolutionize construction.
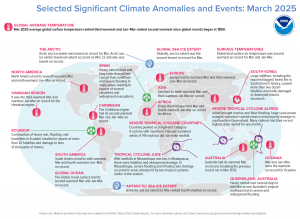 In March 2025, more than 20 people died and tens of thousands of homes were damaged by heavy rain, flooding and landslides in Ecuador. Large wildfires, including the reported biggest forest fire in South Korea’s history, led to more than two dozen fatalities and destroyed historic structures. Tropical Cyclone Alfred brought riverine and flash flooding, large-scale power outages and property damage to southeastern Queensland. Hawaii recorded the third warmest March and warmest January-March on record for the region. The Antarctic Sea ice extent for March ranked as the fourth smallest on record and in the Arctic, the sea ice extent was the lowest on record for March. (Image Credit: NOAA Global Climate Report)
- The NOAA Global Climate Change Report for March 2025 has been released by the National Centers for Environmental Information and it reveals further proof that global climate change remains a concern. March 2025 was the third warmest March on record for the globe in NOAA’s 176-year record. The March global surface temperature was 1.31°C (2.36°F) above the 20th Century average of 12.7°C (54.9°F). This is 0.03°C (0.05°F) less than the record-warm March of last year. March 2025 marked the 49th consecutive March with global temperatures, at least nominally, above the 20th Century average. Approximately 3.9% of the global land surface was affected by record-warm conditions in March. Global land-only March temperatures ranked second warmest on record at 2.24°C (4.03°F) above average. Ocean-only temperatures also ranked second warmest on record for March at 0.90°C (1.62°F) above average. Sea surface temperatures were record warm across a large area of the western tropical Pacific, parts of mid-latitude central Pacific, as well as small areas in the southeast Pacific, the southwest Atlantic, and small parts of the Southern Ocean.
- Farmers markets get underway in April and May across the USA. They’re the perfect place for farmers and growers to sell their products to local consumers, whether it’s honey from their own bees, fresh cut flowers from their own properties, or veggies and fruits from their personal gardens. Some vendors bake an array of goodies while others whip up batches of salsa, jams and jellies. There are states that use GIS for a variety of purposes related to farmers markets. The South Carolina Department of Public Health uses GIS to map out farmers markets and roadside markets to highlight where community members can find fresh fruits and vegetables to help promote a healthy diet. The state of Iowa uses GIS to create a map of farmers markets that pulls a variety of data from the Iowa Department of Agriculture and Land Stewardship data directory. The state of Massachusetts relies on the Farmer’s Markets GIS that pulls data from their farmer’s markets database that connects local farmers with shoppers. For more than two decades, the Sustainable Agriculture Network has set out to improve the lives and production practices of more than 1.2 million farmers around the world. The SAN Intelligence Hub (iHub) is an information management solution specifically designed for agricultural operations and supply chains to simplify decision making process and add value to the Farms for the Future program’s participants. Using GIS technology, iHub helps identify the best practices that farmers need help with, and then guides that support to the right farmer audiences. The system includes many features such as customized baseline assessments and compliance checklists, performance dashboards, geographic location and maps of farms, group management, and charts and reports that facilitate the overview and real time monitoring of farms and supply chains.
Brock Adam McCarty
Map Wizard
(720) 470-7988
brock@apollomapping.com